AI Terminal
MULBERRY GROUP PLC
Earnings Release • Nov 19, 2025
7800_rns_2025-11-19_f4ff7961-a7ad-4694-80fb-d55efb823489.html
Earnings Release
Open in ViewerOpens in native device viewer
National Storage Mechanism | Additional information 
RNS Number : 0630I
Mulberry Group PLC
19 November 2025
Mulberry Group plc
Results for the twenty-six weeks ended 27 September 2025
Strong momentum, executing strategy at pace
Mulberry Group plc (the "Group" or "Mulberry"), the British luxury brand, announces unaudited results for the twenty-six weeks ended 27 September 2025 (the "period").
aNDREA BALDo, CHIEF EXECUTIVE OFFICER, COMMENTED:
"This has been an encouraging first half as we continue to deliver our 'Back to the Mulberry Spirit' strategy. We're still early in the turnaround, but the foundations we've put in place are working, and we're starting to see that reflected in performance.
We're strengthening our margin and improved our cash position through a greater focus on full-price sales and disciplined cost management, while our refreshed product offer and creative direction are reconnecting the brand with customers. The strong response to new icons the Roxanne and Hackney shows that Mulberry's distinctive spirit continues to resonate.
While we remain mindful of the wider trading environment, current momentum gives us confidence as we enter the key festive trading period. We're focused on maintaining this progress and continuing to build a stronger, resilient business for the long term."
Financial Highlights
· Trading in line with the Board's expectations.
· The focus during the period was on executing the "Back to The Mulberry Spirit" strategy previously outlined, and on operational discipline to improve margins and cost control.
· Group revenue in the period down 4% to £53.9m (2024: £56.1m) but with a strong reaction from Wholesale (+36%) aligned to the strategic emphasis.
· Overall like-for-like Retail & Digital revenue declined 2%; but in Retail Stores, both Full Price and Off Price, like-for-like revenue increased 4% in the key markets (UK, Europe and USA), with positive momentum building since Q2.
· Asia Pacific revenue was down 17% versus last year, driven by like-for-like declines in stores (-14%) and store closures (-3%) as the strategy of structure simplification continued.
· Gross margin increased to 69% (2024: 67%), from maintaining a full price, non-discounted offering in Retail and Digital.
· Total operating expenses decreased 16% to £42.7m (2024: £50.7m) as action was taken to manage the cost base and drive efficiencies, offset by continued investment in marketing and brand.
· Reduced the underlying Group loss before tax to £7.4m (2024: £15.3m) driven by stable gross profit, strong cost control, and a focus on profitable locations in core markets.
· More than halved the reported loss before tax to £6.9m (2024: £15.7m).
· We continue, as expected, on our path towards sustainable profit and cash generation, unlocked through the £20m fundraise via Convertible Loan Notes from our two largest shareholders.
Operating Highlights
· First product launch under new creative team successfully delivered; the Roxanne family and continued evolution of iconic families including the Bayswater 9 to 5.
· Strong engagement with new marketing campaigns to connect with new and existing customers; including Cynthia Erivo as a brand ambassador in September 2025.
· Optimisation of store network including closure of six stores in Asia, and new wholesale agreements in the UK with John Lewis, Liberty and Harvey Nichols.
· Strengthened senior management team with new Brand Director and Chief Digital & Customer Officer.
· Cost base review resulting in underlying operating expenses down by 13% for the period.
· Launch of new retail incentive scheme driving improved performance; for example, European stores increased their revenue by 11% and UK stores by 10%, versus the same stores year on year.
· The continued success of the buyback scheme enhanced Mulberry's approach to the circular business model; the period saw a 46% increase in pre-loved sales revenue compared to the same period last year.
Current Trading AND OUTLOOK
· Positive trading momentum continues, despite ongoing external headwinds and inflationary pressures for the sector.
· Our strategy, which has restoring profitability at its core, means as a brand we have focused significantly on reducing the volume of promotional and marked down sales, emphasising margin over top line growth.
· Second half sees the launch of new product icons - the Hackney, the Lennox and the Boston.
· Well set for the key festive trading period, with new Christmas campaign launched in early November.
FOR FURTHER DETAILS PLEASE CONTACT:
Mulberry
Billie o'Connor Tel: +44 (0) 20 7605 6793
Headland (Public Relations)
Lucy Legh / Joanna clark Tel: +44 (0) 20 3805 4822
HOULIHAN LOKEY UK LIMITED (FINANCIAL ADVISER AND NOMAD)
Tim Richardson Tel: +44 (0) 20 7389 3355
PEEL HUNT (CORPORATE BROKER)
JAMES THOMLINSON TEL: +44 (0) 20 7419 8900
Overview
The wider macro-economic environment, including ongoing inflationary pressures, continues to present uncertainty and challenges. We continue to take appropriate cost actions and manage inventory levels to ensure they align with revenue expectations for the remainder of this year and next. Trading for the full financial year is expected to be weighted towards the second half given the important festive trading period.
Mulberry is a much-loved British icon with a rich heritage. While delivery of the Board's strategic goals of becoming a global luxury brand, pursuing international retail expansion, and big product launches has been hampered by the ongoing challenging trading conditions, the Board is convinced there is a clear path back to profitability driven by our focus on improving operational flexibility to ensure we can always act with agility and pace.
The capital raising announced at the end of the period provides the financial flexibility to support this. This funding is being used on rebuilding core stocks including 'iconic families' silhouettes to drive sales, selective marketing spend in core markets, and upgrades to existing customer engagement and digital platforms.
Our CEO's initial review on joining focused on enhancing operational efficiency and targeted product, pricing and distribution strategies to improve margin and cash position and we are seeing initial results of the strategy in the period's results.
STRATEGY
A Two-Phased Strategy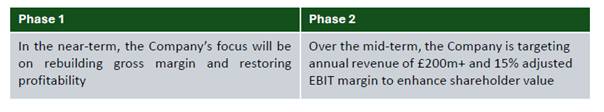
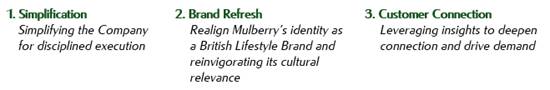
Strategic Priorities
In order to achieve these goals, the Board has set the following three strategic priorities:
APPOINTMENT OF NEW BOARD MEMBER
On 30 July 2025 James France of Frasers Group plc ("Frasers") joined the Board as a Non-Executive Director. Having joined Frasers' property division in 2016, Mr. France is a senior member of the Frasers' leadership team and has been instrumental in shaping Frasers' growth and investment approach to ensure success in a dynamic retail landscape.
FINANCIAL REVIEW
Loss before tax
| 2025 | 2024 | |||
| £'m | £'m | % change | ||
| Revenue | 53.9 | 56.1 | (4%) | |
| Cost of sales | (16.6) | (18.8) | 12% | |
| Gross profit | 37.3 | 37.3 | - | |
| Other operating expenses | (42.7) | (50.7) | 16% | |
| Other operating income | 0.4 | 0.3 | 48% | |
| Operating loss | (4.9) | (13.1) | 63% | |
| Share of results of associates | - | - | - | |
| Finance expense | (2.1) | (2.6) | 21% | |
| Loss before tax | (6.9) | (15.7) | 56% |
The table above summarises the Group Income Statement, showing the reported loss before tax for the period of £6.9m (2024: £15.7m). Further details are discussed within this Financial Review.
| 2025 | 2024 | |||
| £'m | £'m | % change | ||
| Underlying loss before tax pre-SaaS costs | (7.2) | (14.4) | 50% | |
| SaaS costs | (0.2) | (0.8) | 73% | |
| Underlying loss before tax | (7.4) | (15.2) | 52% | |
| Store closure credit | 1.0 | 0.8 | 27% | |
| Strategic project costs | - | (0.4) | 100% | |
| Restructuring costs | (0.5) | (0.8) | 34% | |
| Reported loss before tax | (6.9) | (15.7) | 56% |
The table above shows the reconciliation from the reported loss before tax in the period of £6.9m (2024: £15.7m) to the underlying loss.
The Group's underlying loss for the period of £7.4m (2024: £15.2m) was delivered through stable gross profit, enhanced by the results of the review of the operating cost base in implemented in FY25 and continuing cost control. The operating expenses table within this financial review shows the operational costs decrease of £8.0m to £42.7m for the period (2024: £50.7m). Underlying operating expenses decreased by £6.6m to £42.9m (2024: £49.5m).
Reported loss before tax for the period of £6.9m (2024: £15.7m), includes adjusting items of a net credit of £1.0m (2024: credit £0.8m) for the closure of five retail stores and UK head office restructuring costs of £0.5m (2024: £0.8m).
Group revenue
Revenue analysis for the 26 weeks ended 27 September 2025 compared to the same period last year is as follows:
| 2025 | 2024 | Like For Like | |||
| £'m | £'m | % change | % change | ||
| Digital | 16.6 | 18.4 | (10%) | (9%) | |
| Stores | 30.0 | 32.3 | (7%) | 4% | |
| Retail (omni-channel) | 46.6 | 50.7 | (8%) | (2%) | |
| Franchise and Wholesale | 7.3 | 5.4 | 36% | N/A | |
| Group Revenue | 53.9 | 56.1 | (4%) | N/A | |
| Digital | 10.0 | 11.8 | (16%) | (13%) | |
| Stores | 18.2 | 19.4 | (7%) | 10% | |
| Omni-channel - UK | 28.1 | 31.2 | (10%) | (1%) | |
| Digital | 2.1 | 1.7 | 22% | 26% | |
| Stores | 4.0 | 3.6 | 10% | 11% | |
| Omni-channel - Europe | 6.0 | 5.3 | 14% | 16% | |
| Digital | 3.0 | 3.2 | (6%) | (8%) | |
| Stores | 1.7 | 1.7 | 2% | (1%) | |
| Omni-channel - USA | 4.7 | 4.9 | (4%) | (6%) | |
| Digital | 1.6 | 1.7 | (4%) | (8%) | |
| Stores | 6.1 | 7.6 | (20%) | (14%) | |
| Omni-channel - Asia Pacific | 7.7 | 9.3 | (17%) | (14%) | |
| Retail (omni-channel) | 46.6 | 50.7 | (8%) | (2%) |
Like for Like stores, or digital concessions, are defined as being open for a full financial year and the store or concession must have traded for all weeks 1-26 in the prior period.
| Q1 | Q2 | H1 2025 | |||||||
| Revenue £'m |
% change | Revenue £'m |
% change | Revenue £'m |
% change | ||||
| Digital | 8.2 | (14%) | 8.4 | (5%) | 16.6 | (10%) | |||
| Stores | 14.5 | (17%) | 15.4 | 5% | 30.0 | (7%) | |||
| Retail (omni-channel) | 22.7 | (16%) | 23.9 | 1% | 46.6 | (8%) | |||
| Franchise and Wholesale | 3.8 | (9%) | 3.5 | 192% | 7.3 | 36% | |||
| Group revenue | 26.6 | (15%) | 27.4 | 10% | 53.9 | (4%) |
Group revenue down 4% to £53.9m (2024: £56.1m)
o UK retail sales declined 10% to £28.1m (2024: £31.3m), with store sales down 7% and digital down 16% driven by closure of non-profitable stores and a focus on reduced promotion online. UK Off Price sales grew ahead of Full Price sales due to improved inventory management while store sales were less impacted than digital from the reduction in promotions. Full Price stores benefited from a new retail incentive scheme.
o Europe retail sales increased 13% to £6.0m (2024: £5.3m), supported by strong performance predominantly in Ireland which grew by 25%, due to a full half year of Brown Thomas, and European Mulberry.com growth.
o USA retail sales declined 4% to £4.7m (2024: £4.9m), with store sales up 2% and digital down 6%. Digital miss was driven by digital concessions rather than Mulberry.com which was 5% up for the same period year on year.
o Asia Pacific retail sales decreased 17% to £7.7m (2024: £9.3m), with digital sales down 6% and store sales down 20%. The region has experienced double-digit revenue decline compared to last year, driven by economic conditions as well as the closure of unprofitable stores.
o Franchise and wholesale revenue rose 36% to £7.3m (2024: £5.4m) driven by new wholesale agreements in the UK including John Lewis, Liberty and Harvey Nichols.
Q1 saw a decrease of 15% in Group revenue while Q2 revenue increased 10%; this was distorted slightly by the timing of wholesale orders and therefore the Retail (omni-channel) split was 16% decrease in Q1 and a Q2 increase of 1% versus the same period last year.
Gross margin
| 2025 | 2024 | |||
| £'m | £'m | % change | ||
| Revenue | 53.9 | 56.1 | (4%) | |
| Cost of sales | (16.6) | (18.8) | 12% | |
| Gross profit | 37.3 | 37.3 | - | |
| Gross profit margin | 69.2% | 66.5% |
Gross profit margin during the period was 69.2% (2024: 66.5%), resulting in Gross profit being in line with the prior period on lower revenue. This improvement in gross margin rate year on year is related to improved full price sales mix and optimised inventory management.
Other operating expenses
| 2025 | 2024 (Restated*) |
|||
| £'m | £'m | % change | ||
| Operating expenses | 16.7 | 16.2 | 3% | |
| Staff costs | 16.7 | 19.9 | 16% | |
| Depreciation and amortisation | 6.2 | 6.8 | 8% | |
| Systems and comms | 3.5 | 4.7 | 26% | |
| Foreign exchange (gain)/loss | (0.1) | 0.2 | (142%) | |
| Underlying operating expenses | 42.9 | 49.5 | 13% | |
| SaaS costs | 0.2 | 0.8 | 73% | |
| Store closure credit | (1.0) | (0.8) | 27% | |
| Strategic project costs | - | 0.4 | 100% | |
| Restructure costs | 0.5 | 0.8 | 34% | |
| Operating expenses | 42.7 | 50.7 | 16% |
* Prior period overhead absorption costs of £2.5m have been restated into underlying operating expenses, from non-underlying operating expenses. The total operating expenses remain unchanged from the reported prior period at £50.7m.
Operating expenses decreased by 16% to £42.7m (2024: £50.7m), reflecting ongoing cost discipline. A cost base review has resulted in underlying operating expenses reducing by 13% for the first half versus the same period last year.
In light of the March 2021 IFRIC agenda decision to clarify the treatment of Software as a Service (SaaS) costs, during the period we expensed £0.2m (2024: £0.8m) of SaaS costs which would previously have been capitalised, in line with the accounting for configuration and customisation cost arrangements. We expect to incur further SaaS costs in the second half.
Taxation
The Group reported a tax charge for the period of £0.1m (2024: £0.4m.) This relates to prior and current period current tax charges.
Balance Sheet
Net working capital, which comprises inventories, trade and other receivables and trade and other payables decreased by £0.4m to £10.5m at the period end (2024: £10.9m). This decrease was driven by a reduction in inventories of £2.0m as we continue to build stock cover from the low point at March 2025, which has been offset by a reduction in trade and other payables of £2.6m, due to timing of supplier payments.
At the period end, other trade receivables had decreased by £1.0m, principally due to the timing of wholesale receipts at period end.
Lease liabilities (current and non-current) reduced by £12.8m to £32.6m (2024: £45.4m) due to the release of regular lease payments made in the period and store closures.
Cash flow
| 2025 | 2024 | |||
| £'m | £'m | % change | ||
| Operating cash inflow/(outflow) | 0.2 | (7.0) | 103% | |
| Net change in working capital | (4.8) | 15.7 | (131%) | |
| Cash (used)/generated by operations | (4.6) | 8.7 | (153%) | |
| Income taxes paid | - | (0.2) | 97% | |
| Net cash (outflow)/inflow from operating activities | (4.6) | 8.5 | (154%) | |
| Purchases of property, plant and equipment | (0.1) | (0.7) | 90% | |
| Acquisition of intangible assets | (0.1) | (1.2) | 90% | |
| Other | 0.1 | 0.1 | (35%) | |
| Net cash used in investing activities | (0.1) | (1.8) | 94% | |
| Interest paid | (2.1) | (2.6) | 21% | |
| Proceeds from issue of shares | 0.1 | - | 100% | |
| Proceeds from convertible loan note | 20.0 | - | 100% | |
| Proceeds from net borrowings | - | 3.8 | - | |
| Proceeds received under a supplier financing agreement | 10.3 | - | 100% | |
| Repayment of net borrowings | (8.1) | (2.1) | (295%) | |
| Repayments under a supplier finance agreement | (10.2) | - | (100%) | |
| Principal elements of lease payments | (6.3) | (4.1) | (53%) | |
| Net cash generated by/(used in) financing activities | 3.7 | (2.4) | 174% | |
| Net (decrease)/increase in cash and cash equivalents | (1.0) | 1.7 | (158%) |
The net decrease in cash and cash equivalents of £1.0m (2024: increase of £1.7m) included proceeds of £20m from the Group's previously announced fundraising which were received in this reporting period. Following the fundraising, £8.1m of net borrowings were re-paid.
As a result of the financial performance in the period there was an operating cash inflow of £0.2m (2024: outflow £7.0m). This cash inflow has been offset by an increase in net working capital which had a cash outflow of £4.8m (2024: inflow £15.7m). The outflow was largely driven by the increase in inventories of £4.9m to bring stock cover to an optimal level on core stock lines.
Borrowing facilities
The Group had bank borrowings relating to drawdowns under its RCF of £9.5m at 27 September 2025 (2024: £17.5m). The borrowings shown in the balance sheet also include the convertible loan note of £19.3m (2024: £nil), loans from minority shareholders in the Chinese subsidiary of £6.9m (2024: £7.8m), and an overdraft of £nil (2024: £6.4m). Shown separately on the balance sheet is the liability under a supplier trade finance arrangement of £5.9m (2024: £nil.)
The Group's net debt balance (comprising cash and cash equivalents, less overdrafts and borrowings excluding loans from minority shareholders) at 27 September 2025 was £21.6m (2024: net debt of £16.4m), with available liquidity of £18.5m. Net debt comprises cash balances of £7.2m (2024: £8.8m) less bank borrowings of £9.5m (2024: £25.2m), and convertible loan note of £19.3m (2024: £nil), excluding loans from related parties and non-controlling interests of £6.9m (2024: £7.8m). Net debt also excludes lease liabilities of £32.6m (2024: £45.4m) and liabilities under a supplier finance arrangement of £5.9m (2024: £nil) which are not considered to be core borrowings.
The Group continues to have a £17.5m RCF, a £6.0m supplier trade finance facility which is backed by UK Export Finance and a £4.0m overdraft facility in the UK.
Significant transactions in the period
Fundraise
On 20 June 2025, the Group announced a new fundraising initiative via a convertible loan note of £20m, with both its major shareholders Challice Limited and Frasers Group Plc, to further strengthen the balance sheet. The initiative was concluded and funds received by 14 July 2025.
Retail Offer
On 10 July 2025 the Group announced a conditional offer of new ordinary 5p shares to the remaining shareholders for an issue price of £0.975 per share. On 31 July 2025 107,720 new shares were issued under the offer raising £0.1m net of expenses.
CONSOLIDATED INCOME STATEMENT
26 WEEKS ENDED 27 SEPTEMBER 2025
| Note | Unaudited 26 weeks ended 27 September 2025 £'000 |
Unaudited 26 weeks ended 28 September 2024 £'000 |
Audited 52 weeks ended 29 March 2025 £'000 |
|
| Revenue | 53,932 | 56,145 | 120,389 | |
| Cost of sales | (16,588) | (18,813) | (39,953) | |
| Gross profit | 37,344 | 37,332 | 80,436 | |
| Impairment charge relating to intangibles | - | (161) | ||
| Impairment charge relating to property, plant and equipment | - | - | (338) | |
| Impairment charge relating to right-of-use assets | - | - | (281) | |
| Other operating expenses | (42,663) | (50,725) | (107,149) | |
| Other operating income | 415 | 281 | 626 | |
| Operating loss | (4,904) | (13,112) | (26,867) | |
| Share of results of associates | 36 | 11 | 42 | |
| Finance expense | (2,079) | (2,623) | (4,995) | |
| Loss before tax | (6,947) | (15,724) | (31,820) | |
| Tax charge | 4 | (78) | (374) | (381) |
| Loss for the period | (7,025) | (16,098) | (32,201) | |
| Attributable to: | ||||
| Equity holders of the parent | (6,605) | (15,068) | (30,376) | |
| Non-controlling interests | (420) | (1,030) | (1,825) | |
| Loss for the period | (7,025) | (16,098) | (32,201) | |
| Basic loss per share | 5 | (10.0p) | (27.0p) | (49.8p) |
| Diluted loss per share | 5 | (10.0p) | (27.0p) | (49.8p) |
All activities arise from continuing operations.
CONSOLIDATED STATEMENT OF COMPREHENSIVE INCOME
26 WEEKS ENDED 27 SEPTEMBER 2025
| Unaudited 26 weeks ended 27 September 2025 £'000 |
Unaudited 26 weeks ended 28 September 2024 £'000 |
Audited 52 weeks ended 29 March 2025 £'000 |
|
| Loss for the period | (7,025) | (16,098) | (32,201) |
| Items that may be reclassified subsequently to profit or loss; | |||
| Exchange differences on translation of foreign operations | (213) | 51 | 140 |
| Total comprehensive expense for the period | (7,238) | (16,047) | (32,061) |
| Attributable to: | |||
| Equity holders of the parent | (7,108) | (15,227) | (30,413) |
| Non-controlling interests | (130) | (820) | (1,648) |
| Total comprehensive expense for the period | (7,238) | (16,047) | (32,061) |
CONSOLIDATED BALANCE SHEET
AT 27 SEPTEMBER 2025
| Unaudited 27 September 2025 £'000 |
Unaudited 28 September 2024 £'000 |
Audited 29 March 2025 £'000 |
|
| Non-current assets | |||
| Intangible assets | 4,149 | 8,258 | 5,230 |
| Property, plant and equipment | 13,152 | 17,219 | 14,702 |
| Right-of-use assets | 23,348 | 30,591 | 26,738 |
| Interests in associates | 398 | 93 | 450 |
| 41,047 | 56,161 | 47,120 | |
| Current assets | |||
| Inventories | 23,102 | 25,079 | 18,223 |
| Trade and other receivables | 12,069 | 13,120 | 13,107 |
| Current tax asset | - | - | 45 |
| Cash and cash equivalents | 7,200 | 8,761 | 8,200 |
| 42,371 | 46,960 | 39,575 | |
| Total assets | 83,418 | 103,121 | 86,695 |
| Current liabilities | |||
| Trade and other payables | (24,694) | (27,259) | (24,715) |
| Liabilities under a supplier finance arrangement | (5,869) | - | (5,726) |
| Current tax liabilities | (24) | (290) | - |
| Lease liabilities | (8,784) | (10,526) | (10,153) |
| Borrowings | (16,368) | (25,175) | (17,596) |
| (55,739) | (63,250) | (58,190) | |
| Net current liabilities | (13,368) | (16,290) | (18,615) |
| Non-current liabilities | |||
| Trade and other payables | (2,189) | (2,155) | (2,318) |
| Lease liabilities | (23,690) | (34,898) | (29,735) |
| Borrowings | (19,326) | (7,785) | (7,229) |
| (45,205) | (44,838) | (39,282) | |
| Total liabilities | (100,944) | (108,088) | (97,472) |
| Net liabilities | (17,526) | (4,967) | (10,777) |
| Equity | |||
| Share capital | 3,529 | 3,004 | 3,524 |
| Share premium account | 21,874 | 12,160 | 21,779 |
| Own share reserve | (396) | (490) | (365) |
| Capital redemption reserve | 154 | 154 | 154 |
| Foreign exchange reserve | (503) | (379) | (290) |
| Retained earnings | (33,880) | (12,070) | (27,405) |
| Equity attributable to holders of the parent | (9,222) | 2,379 | (2,603) |
| Non-controlling interests | (8,304) | (7,346) | (8,174) |
| Total equity | (17,526) | (4,967) | (10,777) |
CONSOLIDATED STATEMENT OF CHANGES IN EQUITY
26 WEEKS ENDED 27 SEPTEMBER 2025
| Share capital £'000 |
Share premium account £'000 | Own share reserve £'000 | Capital re-demption reserve £'000 | Foreign exchange reserve £'000 | Retained earnings £'000 | Total £'000 |
Non-controlling interest £'000 | Total equity £'000 | |
| As at 1 April 2024 | 3,004 | 12,160 | (438) | 154 | (430) | 2,955 | 17,405 | (6,526) | 10,879 |
| Loss for the period | - | - | - | - | - | (15,068) | (15,068) | (1,030) | (16,098) |
| Other comprehensive expense for the period | - | - | - | - | 51 | - | 51 | - | 51 |
| Total comprehensive expense for the period | - | - | - | - | 51 | (15,068) | (15,017) | (1,030) | (16,047) |
| Credit for employee share-based payments | - | - | - | - | - | (9) | (9) | - | (9) |
| Impairment of shares in trust | - | - | (52) | - | - | 52 | - | - | - |
| Non-controlling interest foreign exchange | - | - | - | - | - | - | - | 210 | 210 |
| As at 28 September 2024 | 3,004 | 12,160 | (490) | 154 | (379) | (12,070) | 2,379 | (7,346) | (4,967) |
| Loss for the period | - | - | - | - | - | (15,308) | (15,308) | (795) | (16,103) |
| Other comprehensive expense for the period | - | - | - | - | 89 | - | 89 | - | 89 |
| Total comprehensive expense for the period | - | - | - | - | 89 | (15,308) | (15,219) | (795) | (16,014) |
| Issue of shares | 520 | 9,619 | - | - | - | - | 10,139 | - | 10,139 |
| Charge for employee share-based payments | - | - | - | - | - | 98 | 98 | - | 98 |
| Impairment of shares in trust | - | - | 125 | - | - | (125) | - | - | - |
| Non-controlling interest foreign exchange | - | - | - | - | - | - | - | (33) | (33) |
| As at 29 March 2025 | 3,524 | 21,779 | (365) | 154 | (290) | (27,405) | (2,603) | (8,174) | (10,777) |
| Loss for the period | - | - | - | - | - | (6,605) | (6,605) | (420) | (7,025) |
| Other comprehensive expense for the period | - | - | - | - | (213) | - | (213) | - | (213) |
| Total comprehensive expense for the period | - | - | - | - | (213) | (6,605) | (6,818) | (420) | (7,238) |
| Issue of shares | 5 | 95 | - | - | - | - | 100 | - | 100 |
| Charge for employee share-based payments | - | - | - | - | - | 99 | 99 | - | 99 |
| Impairment of shares in trust | - | - | (31) | - | - | 31 | - | - | - |
| Non-controlling interest foreign exchange | - | - | - | - | - | - | - | 290 | 290 |
| As at 27 September 2025 | 3,529 | 21,874 | (396) | 154 | (503) | (33,880) | (9,222) | (8,304) | (17,526) |
CONSOLIDATED CASH FLOW STATEMENT
26 WEEKS ENDED 27 SEPTEMBER 2025
| Unaudited 26 weeks ended 27 September 2025 £'000 |
Unaudited 26 weeks ended 28 September 2024 £'000 |
Audited 52 weeks ended 29 March 2025 £'000 |
|
| Operating loss for the period | (4,904) | (13,112) | (26,867) |
| Adjustments for: | |||
| Depreciation and impairment of property, plant and equipment | 1,714 | 2,063 | 4,577 |
| Depreciation and impairment of right-of-use assets | 3,560 | 3,745 | 7,623 |
| Amortisation and impairment of intangible assets | 967 | 982 | 2,115 |
| Gain on lease modifications and lease disposals | (1,203) | (802) | (1,228) |
| Loss on sale of property, plant and equipment | - | 65 | 217 |
| Loss on sale of intangibles | - | - | 2,568 |
| Share-based payments expense/(credit) | 99 | (9) | 89 |
| Operating cash inflow/(outflow) before movements in working capital | 233 | (7,068) | (10,906) |
| (Increase)/decrease in inventories | (4,853) | 8,080 | 14,619 |
| Decrease in receivables | 1,038 | 2,333 | 2,346 |
| (Decrease)/increase in payables | (990) | 5,332 | 2,590 |
| Cash (used)/generated by operations | (4,572) | 8,677 | 8,649 |
| Income taxes paid | (6) | (208) | (550) |
| Net cash (outflow)/inflow from operating activities | (4,578) | 8,469 | 8,099 |
| Investing activities: | |||
| Purchases of property, plant and equipment | (68) | (704) | (1,152) |
| Acquisition of intangible fixed assets | (117) | (1,188) | (1,818) |
| Dividend received from associate | 71 | 109 | 109 |
| Net cash used in investing activities | (114) | (1,783) | (2,861) |
| Financing activities: | |||
| Interest paid | (2.060) | (2,623) | (4,995) |
| Proceeds from issue of shares | 100 | - | 10,139 |
| Proceeds from convertible loan notes | 20,000 | - | - |
| Proceeds from new borrowings | - | 3,752 | - |
| Proceeds received under a supplier financing agreement | 10,282 | - | 9,647 |
| Repayment of borrowings | (8,096) | (2,051) | (5,878) |
| Repayments under a supplier finance agreement | (10,220) | - | (3,921) |
| Principal elements of lease payments | (6,274) | (4,100) | (9,092) |
| Net cash generated/(used) in financing activities | 3,732 | (5,022) | (4,100) |
| Net (decrease)/increase in cash and cash equivalents | (960) | 1,664 | 1,138 |
| Cash and cash equivalents at beginning of period | 8,200 | 7,138 | 7,138 |
| Effect of foreign exchange rate changes | (40) | (41) | (76) |
| Cash and cash equivalents at end of period | 7,200 | 8,761 | 8,200 |
Notes to the condensed financiAL statements
26 WEEKS ENDED 27 SEPTEMBER 2025
1. GENERAL INFORMATION
Mulberry Group plc is a company incorporated in the United Kingdom under the Companies Act 2006. The half year results and condensed consolidated financial statements for the 26 weeks ended 27 September 2025 (the interim financial statements) comprise the results for the Company and its subsidiaries (together referred to as the Group) and the Group's interest in associates. The interim financial statements for the 26 weeks ended 27 September 2025 have not been reviewed or audited.
The information for the 52 weeks ended 29 March 2025 does not constitute statutory accounts as defined in section 434 of the Companies Act 2006. The statutory accounts for that period were approved by the Board of Directors on 10 July 2025 and have been filed with the Registrar of Companies. The auditor's report on those statutory accounts was not qualified, although included an emphasis of matter in respect of material uncertainty around going concern and did not contain statements under section 498(2) (3) of the Companies Act 2006. The report stated that should there be an extreme and prolonged decline in trading performance which is over and above the current trading levels and the level of mitigating actions including promotional activity was not achieved, then the Group would breach its covenants during the going concern period. This would give rise to a material uncertainty, which may cast significant doubt on the Group and parent company's ability to continue as a going concern, meaning it may be unable to realise its assets and discharge its liabilities in the normal course of business.
2. ACCOUNTING POLICIES AND BASIS OF PREPARATION
The accounting policies and methods of computation followed in the interim financial statements are consistent with those published in the Group's Annual Report and Financial Statements for the 52 weeks ended 29 March 2025.
These condensed consolidated interim financial statements for the 26 weeks ended 27 September 2025 have been prepared in accordance with the Disclosure and Transparency Rules of the Financial Services Authority and with International Accounting Standards (IAS) 34, Interim Financial Reporting, in accordance with the requirements of the Companies Act 2006. This report should be read in conjunction with the Group's financial statements for the 52 weeks ended 29 March 2025, which have been prepared in accordance with UK-adopted International Financial Reporting Standards in conformity with the requirements of the Companies Act 2006.
The Annual Report and Financial Statements are available from the Group's website (www.mulberry.com) or from the Company Secretary at the Company's registered office, The Rookery, Chilcompton, Bath, England, BA3 4EH.
CONVERTIBLE LOAN NOTES
The interest-bearing element of convertible loan notes are initially recorded at fair value and are subsequently measured at amortised cost using the effective interest rate method. The Group has determined that the conversion feature of the loan notes should be classified as a derivative financial liability. Derivative financial instruments are initially recorded at fair value and are subsequently remeasured to their fair value at each reporting date. The resulting gain or loss is recognised in the income statement immediately.
CRITICAL ACCOUNTING JUDGEMENTS AND KEY SOURCES OF ESTIMATION UNCERTAINTY
Preparation of the condensed consolidated interim financial statements requires the Directors to make certain estimates and judgements that affect the measurement of reported revenues, expenses, assets and liabilities.
The critical accounting judgements and key sources of estimation uncertainty applied in the preparation of the condensed consolidated interim financial statements are consistent with those described on pages 74-75 of the Group's Annual Report and Financial Statements for the 52 weeks ended 29 March 2025.
PRINCIPAL RISKS AND UNCERTAINTIES
The management of the business and the execution of the Group's growth strategies are subject to a number of risks and uncertainties that could adversely affect the Group's future development. The principal risks and uncertainties for the Group and the key mitigating actions used to address them are consistent with those outlined on pages 30-33 of the Group's Annual Report and Financial Statements for the 52 weeks ended 29 March 2025.
ALTERNATIVE PERFORMANCE MEASURES
In reporting financial information, the Group presents an APMs, which is not defined or specified under the requirements of IFRS. The Group believes that these APMs, which are not considered to be a substitute for, or superior to, IFRS measures, provide stakeholders with additional helpful information on the performance of the business. These APMs are consistent with how the business performance is planned and reported within the internal management reporting to the Board of Directors. Some of these measures are also used for the purpose of setting remuneration targets.
The Group makes certain adjustments to the statutory profit or loss measures in order to derive the APMs. Adjusting items are those items which, in the opinion of the Directors, should be excluded in order to provide a consistent and comparable view of the performance of the Group's ongoing business. Generally, this will include those items that are largely one-off and material in nature as well as income or expenses relating to acquisitions or disposals of businesses or other transactions of a similar nature. Treatment as an adjusting item provides stakeholders with additional useful information to assess the year-on-year trading performance of the Group.
A reconciliation of reported (loss)/profit before tax to underlying loss before tax is set out below:
| Unaudited 26 weeks ended 27 September 2025 £'000 |
Unaudited 26 weeks ended 29 September 2024 £'000 |
Audited 52 weeks ended 29 March 2025 £'000 |
|
| Reconciliation to underlying loss before tax | |||
| Loss before tax | (6,947) | (15,724) | (31,820) |
| Store closure credit | (979) | (773) | (547) |
| Restructuring costs | 541 | 824 | 3,106 |
| Strategic project costs | - | 424 | 982 |
| Impairment charge related to intangibles | - | - | 161 |
| Impairment charge related to property, plant and equipment | - | - | 338 |
| Impairment charge related to right-of-use assets | - | - | 281 |
| Legal claim | - | 1,250 | |
| Intangible software costs | - | 2,563 | |
| Underlying loss before tax - non-GAAP measure | (7,385) | (15,249) | (23,686) |
| Underlying basic loss per share | (10.9p) | (26.7p) | (40.1p) |
| Underlying diluted loss per share | (10.9p) | (26.7p) | (40.1p) |
| Store closure charge During the period 5 stores (2024: 1 store) were closed. The credit on disposal comprises the release to the income statement of lease and other liabilities of £1,197,000 (2024: £802,000) and the charge of lease exit costs of £218,000 (2024: £29,000). Restructuring costs During the period the Group continued its restructuring programme which began in the second half of the prior period and incurred redundancy costs of £541,000 (2024: £824,000). |
3. GOING CONCERN
In determining whether the Group's accounts can be prepared on a going concern basis, the Directors considered the Group's business activities and cash requirements together with factors likely to affect its performance and financial position.
The Group's net debt balance (comprising cash and cash equivalents, less overdrafts and borrowings excluding loans from minority shareholders) at 27 September 2025 was £21.6m (2024: net debt of £16.4m), with available liquidity of £18.5m. Net debt comprises cash balances of £7.2m (2024: £8.8m) less bank borrowings of £9.5m (2024: £25.2m), and convertible loan note of £19.3m (2024: £nil), excluding loans from related parties and non-controlling interests of £6.9m (2024: £7.8m). Net debt also excludes lease liabilities of £32.6m (2024: £45.4m) and liabilities under a supplier finance arrangement of £5.9m (2024: £nil) which are not considered to be core borrowings.
The Group's full year financial statements for the period ended 29 March 2025 were announced on 10th July 2025 and the Directors concluded that there were adequate resources for the Group to continue as a going concern for the foreseeable future. However, the Directors acknowledged the existence of a material uncertainty in the severe but plausible scenario of either a prolonged macro climate downturn or the non-renewal of uncommitted facilities, and an inability to mitigate this impact through cost savings and working capital management. The Directors have continued to review the 12-month forecasts including their resilience in the face of possible downside scenarios.
Based on the assessment outlined above, the Directors have a reasonable expectation that the Group has access to adequate resources to enable it to continue to operate as a going concern for the foreseeable future. For these reasons, the Directors consider it appropriate for the Group to continue to adopt the going concern basis of accounting in preparing the Interim Report and financial statements.
4. TAXATION
The tax charge relates to prior period and current period current tax charges.
5. EARNINGS PER SHARE ('EPS')
| Unaudited 26 weeks ended 27 September 2025 |
Unaudited 26 weeks ended 29 September 2024 |
Audited 52 weeks ended 29 March 2025 |
|
| Basic loss per share | (10.0p) | (27.0p) | (49.8p) |
| Diluted loss per share | (10.0p) | (27.0p) | (49.8p) |
| Underlying basic loss per share | (10.9p) | (26.7p) | (40.1p) |
| Underlying diluted loss per share | (10.9p) | (26.7p) | (40.1p) |
Earnings per share is calculated based on the following data:
| Unaudited 26 weeks ended 27 September 2025 |
Unaudited 26 weeks ended 29 September 2024 |
Audited 52 weeks ended 29 March 2025 |
|
| Loss for the period for basic and diluted earnings per share | (7,025) | (16,098) | (32,201) |
| Adjusting items: | |||
| Restructuring costs * | 406 | 618 | 2,330 |
| Store closure (credit)/charge * | (1,003) | (773) | (565) |
| Strategic costs | - | 318 | 737 |
| Impairment charge related to intangibles | - | - | 161 |
| Impairment charge related to property, plant and equipment* | - | - | 335 |
| Impairment charge related to right-of-use assets* | - | - | 385 |
| Legal claim | - | 938 | |
| Intangible software costs | - | 1,922 | |
| Underlying loss for the period for basic and diluted earnings per share | (7,622) | (15,935) | (25,958) |
*These items are included net of tax
| Unaudited 26 weeks ended 27 September 2025 Million |
Unaudited 26 weeks ended 29 September 2024 Million |
Audited 52 weeks ended 29 March 2025 Million |
|
| Weighted average number of ordinary shares for the purpose of basic EPS | 70.1 | 59.7 | 64.7 |
| Effect of dilutive potential ordinary shares | - | - | - |
| Weighted average number of ordinary shares for the purpose of diluted EPS | 70.1 | 59.7 | 64.7 |
The weighted average number of ordinary shares in issue during the period excludes those held by the Employee Share Trust.
6. BUSINESS AND GEOGRAPHICAL SEGMENTS
IFRS 8 requires operating segments to be identified on the basis of internal reports about components of the Group that are regularly reviewed by the Chief Operating Decision Maker ("CODM"), defined as the Board of Directors, to allocate resources to the segments and to assess their performance. Inter-segment pricing is determined on an arm's length basis. The Group also presents analysis by geographical destination and product categories.
a) Business segment
The Group continues to extend its omni-channel network in order to support the Group's global growth ambitions. Mulberry has thus become increasingly reliant on individual market-level profitability metrics to enable them to make timely market-centric decisions that are operational and investment in nature. It is therefore appropriate for the segmental analysis disclosures to be a regional view of segments to reflect the current business operations and the way the business internally reports and the information that the CODM reviews and makes strategic decisions based on its financial results.
As previously advised in the Group's Annual Report and Financial Statements for the 52 weeks ended 29 March 2025 due to the increased significance of the USA region to the Group, USA, which was previously reported as part of the Other International region, is now reported in its own segment. The reportable segments are now UK, Europe, USA and Asia Pacific (Other International has been renamed as Europe). The segmental reporting for the 52 weeks ended 29 March 2025 on the new basis was previously disclosed in the Annual Report and is shown below. The segmental reporting for the 26 weeks ended 28 September 2024 has been restated to reflect the revised segments.
The principal activities are as follows:
· The Group designs, manufactures and manages the Mulberry brand for the segment and therefore the finance income and expense are not attributable to the reportable segments.
· The accounting policies of the reportable segment are the same as described in the Group's financial statements. Information regarding the results of the reportable segment is included below. Performance for the segment is assessed based on operating profit/(loss).
GROUP INCOME STATEMENT
26 WEEKS ENDED 27 SEPTEMBER 2025
| UK £'000 |
Europe £'000 |
USA £'000 |
Asia Pacific £'000 |
Eliminations £'000 | Total £'000 |
||
| Revenue | |||||||
| Omni-channel | 61,010 | 6,018 | 4,728 | 7,705 | (32,861) | 46,600 | |
| Wholesale | 1,336 | 5,114 | 44 | 838 | 7,332 | ||
| Total revenue | 62,346 | 11,132 | 4,772 | 8,543 | (32,861) | 53,932 | |
| Segment (loss)/profit | (4,776) | 3,696 | (212) | (2,113) | (3,405) | ||
| Central costs | (1,937) | ||||||
| Store closure credit | 979 | ||||||
| Restructuring costs | (541) | ||||||
| Operating loss | (4,904) | ||||||
| Share of results of associates | 36 | ||||||
| Finance expense | (2,079) | ||||||
| Loss before tax | (6,947) | ||||||
| UK £'000 |
Europe £'000 |
USA £'000 |
Asia Pacific £'000 |
Central £'000 |
Total £'000 |
||
| Segment cost of sales | 40,586 | 4,740 | 1,019 | 3,104 | (32,861) | 16,588 | |
| Segment depreciation and amortisation | 3,715 | 420 | 275 | 874 | 957 | 6,241 | |
| Segment capital expenditure | 129 | - | - | 32 | - | 161 | |
| Segment assets | 54,988 | 6,025 | 5,271 | 10,876 | 6,258 | 83,418 | |
| Segment liabilities | 54,782 | 3,439 | 4,419 | 11,996 | 26,308 | 100,944 |
26 WEEKS ENDED 28 september 2024 (restated*)
| UK £'000 |
Europe (restated*) £'000 |
USA (restated*) £'000 |
Asia Pacific £'000 |
Eliminations £'000 | Total £'000 |
||
| Revenue | |||||||
| Omni-channel | 51,019 | 5,330 | 4,900 | 9,267 | (19,774) | 50,742 | |
| Wholesale | 343 | 4,128 | 36 | 896 | 5,403 | ||
| Total revenue | 51,362 | 9,458 | 4,936 | 10,163 | (19,774) | 56,145 | |
| Segment (loss)/profit | (8,020) | 1,457 | (423) | (4,047) | (11,033) | ||
| Central costs | (1,604) | ||||||
| Store closure credit | 773 | ||||||
| Restructuring costs | (824) | ||||||
| Strategic project costs | (424) | ||||||
| Operating loss | (13,112) | ||||||
| Share of results of associates | 11 | ||||||
| Finance expense | (2,623) | ||||||
| Loss before tax | (15,724) | ||||||
| UK £'000 |
Europe (restated*) £'000 | USA (restated*) £'000 |
Asia Pacific £'000 |
Central £'000 |
Total £'000 |
||
| Segment cost of sales | 28,062 | 5,358 | 1,252 | 3,915 | (19,774) | 18,813 | |
| Segment depreciation and amortisation | 4,108 | 326 | 324 | 1,073 | 959 | 6,790 | |
| Segment capital expenditure | 792 | - | - | 198 | - | 990 | |
| Segment assets | 71,162 | 3,832 | 6,433 | 13,339 | 8,355 | 103,121 | |
| Segment liabilities | 72,931 | 3,411 | 7,534 | 16,147 | 8,065 | 108,088 |
*As described above Europe and USA which were previously reported as Other International, are now reported in their own segments for clarity.
52 WEEKS ENDED 29 MARCH 2025
| UK £'000 |
Europe £'000 |
USA £'000 |
Asia Pacific £'000 |
Eliminations £'000 | Total £'000 |
||
| Revenue | |||||||
| Omni-channel | 113,336 | 11,803 | 10,968 | 18,865 | (45,560) | 109,412 | |
| Wholesale | 850 | 8,141 | 79 | 1,907 | 10,977 | ||
| Total revenue | 114,186 | 19,944 | 11,047 | 20,772 | (45,560) | 120,389 | |
| Segment (loss)/profit | (11,906) | 1,470 | (499) | (4,245) | (15,180) | ||
| Central costs | (3,553) | ||||||
| Store closure credit | 547 | ||||||
| Restructuring costs | (3,106) | ||||||
| Impairment of intangibles | (161) | ||||||
| Impairment of property, plant and equipment | (338) | ||||||
| Impairment of right-of-use assets | (281) | ||||||
| Strategic costs | (982) | ||||||
| Legal claim | (1,250) | ||||||
| Intangible asset write off | (2,563) | ||||||
| Operating loss | (26,867) | ||||||
| Share of results of associates | 42 | ||||||
| Finance expense | (4,995) | ||||||
| Loss before tax | (31,820) | ||||||
| UK £'000 |
Europe £'000 |
USA £'000 |
Asia Pacific £'000 |
Central £'000 |
Total £'000 |
||
| Segment cost of sales | 64,525 | 10,458 | 2,653 | 7,877 | (45,560) | 39,953 | |
| Segment depreciation and amortisation | 8,370 | (82) | 858 | 3,253 | 1,916 | 14,315 | |
| Segment capital expenditure | 1,585 | 34 | 4 | 478 | - | 2,101 | |
| Segment assets | 57,305 | 5,925 | 5,607 | 10,894 | 6,964 | 86,695 | |
| Segment liabilities | 64,507 | 4,024 | 6,194 | 15,158 | 7,589 | 97,472 |
For the purposes of monitoring segment performance and allocating resources between segments, the Chief Operating Decision Maker, which is deemed to be the Board, monitors the tangible, intangible and financial assets. All assets are allocated to the reportable segment.
(b) Product categories
Leather accessories account for around 90% of the Group's revenues, of which bags represent over 70% of revenues. Other important product categories include small leather goods, shoes, soft accessories and women's ready-to-wear. Net asset information is not allocated by product category.
7. CONVERTIBLE LOAN NOTE
On 20 June 2025, the Group announced a new fundraising initiative via a convertible loan note of £20m, with both its major shareholders Challice Limited and Frasers Group Plc participating, funds were received by 14 July 2025.
The interest-bearing element of the convertible loan notes were initially recorded at fair value and subsequently remeasured at amortised cost using the effective interest rate method. The value of the loan notes including accrued interest at 27 September 2025 is £19.3m and is classified as borrowings within non-current liabilities.
The conversion feature of the loan notes has been classified as a derivative financial liability and was initially recorded at fair value and subsequently remeasured to fair value at the balance sheet date. The fair value of the derivative at 27 September 2025 is £0.5m and is included within trade and other payables in current liabilities.
This information is provided by RNS, the news service of the London Stock Exchange. RNS is approved by the Financial Conduct Authority to act as a Primary Information Provider in the United Kingdom. Terms and conditions relating to the use and distribution of this information may apply. For further information, please contact [email protected] or visit www.rns.com.
RNS may use your IP address to confirm compliance with the terms and conditions, to analyse how you engage with the information contained in this communication, and to share such analysis on an anonymised basis with others as part of our commercial services. For further information about how RNS and the London Stock Exchange use the personal data you provide us, please see our Privacy Policy.
END
IR DVLFFEFLXFBQ