AI assistant
Invinity Energy Systems Plc Earnings Release 2025
6158_10-k_2026-06-01_c8a22cb3-7be2-4265-85dd-2515afac390b.html
Earnings Release
Open in viewerOpens in your device viewer
National Storage Mechanism | Additional information 
RNS Number : 4055G
Invinity Energy Systems PLC
01 June 2026

1 June 2026
Invinity Energy Systems plc
("Invinity" or the "Company")
2025 Financial Results
Invinity Energy Systems plc (AIM: IES), a leading global manufacturer of utility-grade energy storage, announces its Full Year Results for the year ended 31 December 2025.
The Company will hold a virtual meeting for analysts at 9.30 a.m. today. Analysts wishing to attend are kindly requested to email [email protected] to receive dial-in details.
Invinity's management team will also host a results presentation and Q&A for all shareholders on Wednesday 3 June 2026 at 4.00 p.m. (UK). Those wishing to join the session can sign up to the Investor Meet Company platform for free via this link.
2025 Financial and Operational Highlights
· Revenue and Other Income of £8.7m and Project Grants* of £9.1m, totalling £17.8m (256% increase YoY - 2024: £5.0m).
· Sales of 31.4 MWh (504% increase YoY - 2024: 5.2 MWh).
· Product shipments totalling 24.9 MWh (241% increase YoY - 2024: 7.3 MWh).
· Gross Loss of £2.9m (17% reduction YoY - 2024: £3.5m).
· Total cash as at 31 December 2025: £28.8m (2024: £32.4m).
· The Group remains debt free.
*For all references to "Project Grants", please refer to Note 31 in the notes to the consolidated financial statements
Strategic Highlights
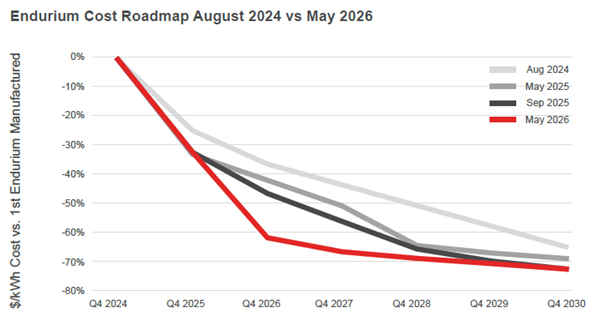
Cost - on target to achieve a forecast minimum 66% reduction in unit costs for Endurium versus our VS3 product within two years. Aggressive cost reduction achieved 18 months ahead of initial management expectations.
Customers - Tripled battery shipments from our factories against a backdrop of high-quality service delivered to our customers as evidenced by numerous public and private endorsements received.
Commercial - Six-fold increase in sales year-on-year, including the first sale of our new Endurium Enterprise product, and expanding our partnership network to gain access to some of the world's fastest growing markets (including India and China). Endurium has been included in 16.7 GWh of UK LDES Cap & Floor bids and our wider commercial opportunity pipeline also continues to grow, driven by improved product costs and performance and now contains a number of highly significant commercial, industrial and datacentre opportunities across Europe, North America and Asia.
Track Record - 9 GWh of energy has been dispatched by our products globally to date. Projects using our batteries are now increasingly backed by third party lending and we have continued to improve our bankability credentials through third-party technical studies and validation.
Scale - Manufacturing capabilities were expanded during the year as well as enhancing our quality control and supply chain functions.
Post Period:
· Invinity selected to design a 1.5 GWh VFB system for FlexBase Group project in Switzerland. Engineering design phase of the project now underway.
· Delivery of all VFBs to Copwood VFB Energy Hub completed in May 2026 ahead of anticipated grid-connection and the commencement of operations later in 2026.
· 2 MWh sale to a C&I project in Wisconsin, USA as part of a U.S. Department of Energy-funded project.
The Company's 2025 Annual Report will soon be available to be downloaded from the Investor section of the website.
Jonathan Marren, Chief Executive Officer at Invinity said:
"I am immensely proud of the progress delivered across Invinity during 2025 and into the current year. The results reflect a business that has deliberately invested in its foundations and is now clearly entering a new phase of accelerating growth.
"Over the past year, we have taken meaningful steps to remove the barriers to scale - significantly reducing product costs, increasing unit shipments and growing sales while expanding our reach through strategic partnerships into some of the world's fastest growing energy storage markets. These efforts are now translating into tangible commercial momentum, with a growing pipeline of opportunities across multiple geographies and customer segments.
"At the same time, confidence in our technology continues to build, with a growing base of satisfied customers and flagship projects such as the Copwood VFB Energy Hub and FlexBase's Technology Centre Laufenburg increasingly demonstrating Invinity's credentials as a trusted partner capable of delivering at scale.
As the world demands cheaper, more secure energy, the opportunity ahead is clear. With momentum building and strong foundations in place, I am incredibly excited for what comes next."
Stay up to date with news from Invinity. Join the distribution list for the Company's monthly investor newsletter here.
Enquiries:
| Invinity Energy Systems plc | +44 (0)20 4551 0361 |
| Jonathan Marren, Chief Executive Officer Joe Worthington, Senior Director, Corporate Affairs |
|
| Canaccord Genuity (Nominated Adviser and Joint Broker) | +44 (0)20 7523 8000 |
| Henry Fitzgerald-O'Connor / Harry Pardoe / Charlie Hammond | |
| VSA Capital (Joint Broker) | +44 (0)20 3005 5000 |
| Andrew Monk / Andrew Raca |
Notes to Editors
Invinity Energy Systems plc (AIM: IES) is a world-leading manufacturer of vanadium flow batteries for energy storage. Built in our factories in the UK and Canada, the Company's proven, commercialised, longer duration energy storage technology has been deployed at scale and dispatched gigawatt-hours of electricity for customers across the world.
Invinity's safe, scalable and durable battery technology is a trusted and safer alternative to lithium-ion batteries. Endurium VFBs are engineered for heavy-duty, high throughput applications, they don't wear out, cannot catch fire and are designed to be operated for 30 years or more. Our products address the challenges of our global energy system, unlocking the power of renewable generation by delivering energy storage without limits.
To find out more, visit invinity.com, sign up to our monthly Investor Newsletter here or contact Investor Relations on via +44 (0)20 4551 0361 or [email protected].
Audited Financial Results for the Year Ended 31 December 2025
Chair's Report
Powering the Future: Meeting the Needs of a Modern Network
The abundance of cheap, clean power in electric grids is breaking records everywhere. 2025 saw renewables provide more than 50% of UK power generation for the second year running and growth forecasts outline that the world will get 50% of its power from renewables by 2030. This is undeniable proof that the world wants clean, low-cost renewable power and the Invinity team remains focused on providing an economic energy storage solution which will be a critical part of our energy future.
I'm pleased to note that Invinity's core technology, capable of providing both high-throughput and longer duration energy storage, is now increasingly a part of modern power system infrastructure. The requirement for flexible, dispatchable, low-carbon energy storage capacity in our electric grids has shifted from aspiration to necessity.
Numerous policies across the UK, North America and Europe are actively accelerating the deployment of long duration energy storage (LDES) batteries. Securing energy sovereignty is a key foreign and domestic policy objective for governments across the world, as is generating the electricity needed to power the increasing electrification of industry and transport. It's beyond doubt that both the deployment and use of low-cost, low-carbon, 24/7 renewable energy powers growth in economies today and to this end, our team continues to participate in strategic dialogues with governments in our key markets.
Importantly, there has been much commercial progress during the period. Jonathan Marren's Chief Executive report gives greater detail but I would wish to highlight the expansion of our existing Endurium product range, with the launch of our Enterprise product in September, and the team's notable achievements in product cost reductions. I am pleased to report that Jonathan, the broader senior leadership group, and the entire Invinity team continue to make important progress in achieving our long-term strategy.
Partnerships were a key feature of 2025 and the relationships Invinity has developed over recent years have provided numerous benefits to the Company. They have not only enhanced our reputation in the industry but augmented our offering to customers. Our relationship with Gamesa Electric, now part of ABB Renewable Energy, enabled the first deployment of our Endurium product at a site where the product has met or exceeded our expectations in operation. The backing of National Wealth Fund (NWF), alongside funding from the Department of Energy Security and Net Zero (DESNZ), has enabled us to deploy the Copwood VFB Energy Hub (formerly the LoDES project) - the UK's largest LDES battery and an important strategic asset for the Company. Furthermore, the development of our relationship with Atri Energy Transition (Atri Energy) has opened up numerous opportunities in the Indian market and our growing partnerships in China and Hong Kong with UESNT, C&D Inc. and International Resources Limited (IRL) are supportive to key corporate objectives such as our product cost reduction programme.
These local partners are key to our ability to scale to meet growing demand for our product. Energy storage markets are inherently regional: regulatory frameworks, grid requirements and customer expectations differ significantly by country. To succeed at scale requires strong local presence and Invinity's approach prioritises in-country partnerships to deliver competitive pricing, secure supply chains and ensure best-in-class customer support. Local production also reduces logistical risk, enhances eligibility for domestic content incentives and demonstrates long-term commitment to host markets, all of which is highly valued by governments, policymakers and above all else, our customers.
Product leadership is core to our success. Our products are designed to address the full spectrum of our customers' needs, from large-scale renewable generators to energy intensive Commercial & Industrial (C&I) applications and datacentres. I'm delighted that we recently reached 9 GWh of electricity dispatched by our batteries in service for our customers. The launch of our Endurium product has enabled us to sell into significantly larger projects, including the recently announced GWh-scale VFB for our new partner FlexBase Group in Switzerland, and at the same time open up major opportunities in large-scale procurement schemes such as those we have been selected for through the UK's LDES Cap & Floor Scheme. Furthermore, our Enterprise product continues to gain traction in the C&I space, with our first sale announced in late 2025 to a French aquaculture business.
These important steps were supported by the appointment of Dr. Margaret Amos to Invinity's Board in June, who brings valuable financial and business expertise. Additionally, the completion of the redomiciliation earlier in the year has opened up a number of opportunities to streamline our corporate structure and simplify our operations to better manage our long-term growth. This move also enabled our long-standing Board member, Michael Farrow, to retire in 2025. My sincere thanks go to him, on behalf of the Board and all Invinity, for his guidance over his many years of service and we wish him the very best in his retirement.
I firmly believe that Invinity remains on the right course towards success. We are now better structured for long-term growth, have the support of strong global and regional partners and have commercialised a technology which offers a solution to one of the most pressing issues the global energy market is facing. Our leadership in this industry has positioned us strongly for the future. To succeed, we must continue to execute on the opportunity we have created and I remain confident that under the leadership of Jonathan, Adam and Matt, Invinity is ready not only to participate in the next phase of the energy transition, but to help lead it.
Neil O'Brien
Non-Executive Chair
29 May 2026
CEO Report:
Charging Ahead: A Year of Progress Across Our Five Strategic Pillars
I am immensely proud of the progress made across the business throughout 2025 and into the current year. More important than any single metric or achievement, however, is what that progress represents: a business that has deliberately invested in its foundations and is now positioned for its next phase of accelerated, sustainable growth.
Over the period and in the year to date, we have made significant reductions to the cost of our flagship Endurium product, increased battery sales sixfold year‑on‑year, more than tripled product shipments from our factories and expanded our network of strategic partnerships to access some of the world's fastest‑growing energy storage markets. These achievements reflect not just operational progress, but evidence the focus we have placed on removing constraints that limit our ability to scale.
At the same time, we continued to build an increasingly compelling commercial pipeline, including opportunities across multiple geographies and customer segments. Encouragingly, we are also seeing increased demand from existing customers who return to Invinity because they trust us to deliver reliably, competitively and at scale. For me, this trust, earned through performance, is the strongest validation of both our technology and our people.
By combining world‑class flow battery technology, the highest standards of customer service and aggressive cost reduction, we are positioning Invinity to compete effectively, win more business and deliver long‑term value for all stakeholders as the business grows and matures.
Our progress has been defined by relentless, disciplined focus across five core strategic pillars. Our achievements in these areas, delivered across 2025 and during the current year to date, are driving Invinity's journey from a niche market challenger that was constrained by product costs and capacity towards a global leader within a fast growing and extremely exciting market segment. There is still a long way to go, with significant challenges to overcome, but I'm delighted to report on material steps forward achieved during the year.
Our Strategic Pillars
Revenue and Project Grants*
Achieving consistent revenue growth remains critical at this stage of our journey. I am therefore pleased that the team delivered a 256% year‑on‑year increase in total revenue and Project Grants* to £17.8 million in 2025.
This performance reflects deliveries to customers across Europe and the USA, in addition to continued progress on the Invinity Copwood VFB Energy Hub ("Copwood") project in the UK, our largest delivered to date. Supported by the Department for Energy Security and Net Zero and the National Wealth Fund, we began construction of Copwood during 2025 and with all batteries now on site, we are incredibly excited to bring Europe's largest collocated vanadium flow battery online later this year.
Beyond its financial contribution (both in terms of grant income for the year in review and in terms of future cashflow for the business), Copwood is strategically important: it strengthens our delivery credentials, enhances bankability and provides a powerful reference asset. It will be a critical source of real‑world operating data, enabling customers, investors and policymakers to see Invinity's technology delivering value at scale.
Product
2025 marked an important year of external validation for our products. ABB Renewable Energy's successful testing of our first Endurium VFB at La Plana provided critical field‑level confirmation of Endurium's performance at a time when long‑duration energy storage (LDES) is moving rapidly from concept to deployment.
Our disciplined focus on operational and technical excellence is an important strength of Invinity, the results of which include highly positive feedback from customers and the consistent achievement of high technical scores in competitive tendering processes. Further confidence was reinforced during the year in review in the form of product validation reports from DNV, helping to further underpin discussions with prospective partners and financiers as we continue to grow and develop as a business.
The year also saw the launch of Endurium Enterprise, expanding our value proposition for Commercial & Industrial (C&I) customers. Our first Enterprise sale, to a French business in December 2025, was an important milestone, validating our strategy and opening a meaningful new market segment for future growth.
Commercial
Commercial momentum accelerated significantly during the year, with 31.4 MWh of sales announced - a sixfold increase in booked orders year‑on‑year. This significant improvement was achieved as a result of a number of factors including improvements in cost and technical performance flowing through to our commercial proposals, as well the investment we have made in our global commercial team who are deepening our customer relationships and building a significant commercial pipeline that includes a number of highly significant commercial, industrial and datacentre opportunities in Europe, North America and Asia. To this end, we were delighted to recently announce that Invinity has been selected by FlexBase Group to design and deliver an up to 1.5 GWh flow battery - the world's largest to date - for use at their Technology Centre Laufenburg project in Switzerland, supporting an AI datacentre and technology campus as well as providing stabilisation services for the local grid. This project represents a significant step-change in the scale of commercial opportunities for Invinity and is an important indicator for growing demand in our sector.
This growing demand, combined with the launch of a number of large-scale procurement schemes in the LDES space during the year, contributed to a 73% year‑on‑year increase in average commercial deal size. The most notable scheme that was launched was the UK's LDES Cap and Floor Scheme, through which 16.7 GWh of Invinity batteries across 21 bids secured eligibility status through collaborations with partners including Frontier Power. This outcome strongly reinforces our technology's suitability for large‑scale, government‑backed projects - another key target market.
Cost
As prices continue to fall across the energy storage sector, cost competitiveness remains fundamental to success. Under the leadership of our President, Matt Harper, the team is on target to achieve a forecast minimum 66% reduction in unit costs for Endurium versus our VS3 product within two years. Removing two-thirds of the cost from our product in less than two years is an incredible achievement and is the product of a multi‑faceted strategy encompassing value engineering, higher‑volume manufacturing processes and a significantly strengthened supply chain.
The majority of the programme is now close to completion, roughly 18 months ahead of our initial expectations, and has already materially reduced the sale price of our products, helping to improve our commercial prospects by opening up new markets.
Our strategic partnerships, including with UESNT, Atri and C&D Inc, which continued to develop strongly throughout the year in review, will also support our cost down efforts through the implementation of our relatively low‑capex, partnership‑led manufacturing model. This approach allows Invinity to access best‑cost regions, supports local content requirements and enables us to scale efficiently as demand grows.
Capital
Maintaining financial discipline has been a consistent priority. Under CFO Adam Howard's leadership, we continued to streamline our corporate structure following the redomiciliation, reducing overheads and improving transparency.
The implementation of a new Enterprise Resource Planning ("ERP") system is simplifying processes across supply chain, finance and customer‑facing functions, while helping to identify further efficiencies as we scale.
In September, the £25 million Subscription from Atri Energy and Next Gen Mobility strengthened our working capital position and opened significant commercial and operational opportunities in India, a relationship we expect to deepen over time.
Navigating the Age of Electricity
The world is entering what many describe as the "Age of Electricity". Electrification across AI, air conditioning and electric vehicles is driving unprecedented demand growth, while ongoing geopolitical events ensure that energy security and sovereignty remain high on national agendas across the world.
The defining challenge is no longer simply generation. It is aligning abundant, variable renewable energy with increasingly complex demand profiles. Invinity's technology sits at the centre of this challenge, enabling greater energy security, unlocking renewable potential and helping to lower long‑term system costs, which ultimately means lower energy bills for households and businesses.
A Leading Voice in the LDES Industry
Invinity continues to play an active role in shaping the global LDES conversation. Throughout the year, we engaged extensively with governments and policymakers across the UK, Canada, China, India and the USA, reinforcing our position as both a technology leader and a trusted delivery partner.
These engagements, from ministerial visits to our UK facilities to collaborations with U.S. national laboratories, enhance our credibility and influence, while supporting the broader development of the LDES market globally.

Summary and Outlook
As outlined in the Strategy section of our Annual Report, we have a clear path toward establishing Endurium as the de facto technology choice for stationary energy storage globally.
The progress delivered during 2025 and into this year represents a step change in Invinity's ability to deliver at scale. Cost barriers have come down, delivery credibility has risen, technical bankability has been strengthened and, critically, a substantial pipeline and value proposition have been built behind the scenes.
Our primary challenge now is delivery at scale: converting preparation into momentum, pipeline into revenue and capability into self-sustaining growth. While there remains work ahead, particularly in driving manufacturing volumes, further reducing costs and reaching cashflow break‑even, the foundations are firmly in place.
My thanks go to Matt, Adam, the Board and the entire Invinity team for their dedication, as well as to our partners and customers for their trust.
As the world demands cheaper, more secure energy, the opportunity ahead of us is immense and we are moving faster than ever to stay at the forefront of this transition and capture maximum value for our stakeholders. We have the momentum, we have the foundation, and I am incredibly excited for what comes next.
Jonathan Marren
Chief Executive Officer
29 May 2026
CFO Report:
Cost Down Supporting Margin Growth
The financial performance of the Group during 2025 reflected a period of continued operational progress and financial transition as the Company advanced the commercialisation of its Endurium product platform while continuing to deliver against its project pipeline.
| 2025 | 2024 | 2023 | |
| Year to 31 December | £m | £m | £m |
| Revenue | 8.2 | 5.0 | 22.0 |
| Other Items of Income | 0.5 | 0.2 | - |
| Project Grants* | 9.1 | 0.3 | |
| Total Revenue & Project Grants* | 17.8 | 5.2 | 22.3 |
| Gross (Loss)/Profit | (2.9) | (3.5) | (3.3) |
| Adjusted EBITDA | (20.6) | (19.3) | (22.3) |
| Pre-tax Loss | (24.1) | (22.8) | (23.2) |
| Property, Plant and Equipment | 10.4 | 2.3 | 1.7 |
| Total Inventory and Pre-paid Inventory | 4.0 | 8.3 | 4.4 |
| Net Cash | 28.8 | 32.4 | 5.0 |
| Year to 31 December | 2025 £m |
2024 £m |
2023 £m |
| Loss from operations | (24.6) | (24.1) | (22.8) |
| Add back (deduct): | |||
| Depreciation and amortisation | 1.2 | 1.3 | 1.1 |
| Impairment of inventory and supplier deposits | 0.5 | 0.4 | 0.3 |
| Share based payment charges | 0.8 | 0.6 | 0.7 |
| Warranty and onerous contract provisions | 1.5 | 2.1 | (1.7) |
| Other Adjusting Items, net 1 | - | 0.4 | 0.2 |
| Adjusted EBITDA | (20.6) | (19.3) | (22.3) |
1. Other Adjusting Items, net, includes gain and loss on disposal of non-current assets and legal settlements, and redomiciliation costs.
Total Revenue and Project Grants* increased to £17.8 million in 2025 from £5.2 million in 2024. This movement reflected increased activity across customer projects, the contribution of royalty income recognised during the year, and £9.1 million of Project Grants* from the Copwood VFB Energy Hub project ("Copwood"). Gross profit margin improved from -70% to -35% and as a result, the Group recorded an improvement in gross loss of £2.9 million, from £3.5 million in 2024. The improvement in gross margin reflects early evidence of improving product economics through cost down initiatives.
Administrative expenses increased to £21.9 million in 2025 from £20.3 million in 2024. The increase reflected continued investment in commercialisation, product certification, supplier development and organisational capability to support the Endurium product platform, together with share-based payment charges reflecting equity incentives. Operating costs remained an area of active management focus throughout the year.
Loss from operations of £24.6 million is a 2% increase over the prior year loss of £24.1 million, and the bottom line loss for the year increased to £24.1 million from £22.8 million largely reflecting the decrease in net finance income of £0.5 million compared to £1.3 million in 2024.
The Group's key focus remains on further reducing the cost of its Endurium product in order to expand its addressable commercial market. During 2025, Endurium units shipped at a materially lower product cost than the previous generation VS3 product.
2025 Cash Performance
Net Cash Outflow from Operating Activities improved from £24.9 million to £17.2 million largely reflecting changes in working capital and the release of inventory for the Copwood project.
Investing cash outflows increased to £9.5 million compared with £1.3 million in 2024, primarily reflecting investment into Copwood and Invinity's manufacturing capacity, including the purchase and commissioning of a semi-automated stack production line. Capital and related prepaid expenditure of £17.0 million was partly offset by the £7.5 million of grant income received for Copwood in 2025.
During the year, the Group recorded £9.1 million of DESNZ Project Grants relating to Copwood in addition to the £0.3m in 2023. Of this, £7.7 million cash was received during the year and the remaining £2 million of the full £10 million award was received in 2026. In accordance with the Group's accounting policies, grant support has been recognised through a combination of offsets against qualifying capital expenditure and deferred income reflecting the timing and nature of the related project costs.
Financing cash inflows were £23.4 million in 2025 compared with £53.6 million in 2024, reflecting proceeds from the £25.0 million subscription offset by transaction costs and lease payments.
| Project Grants* | £m |
| Grant income recognised against capital assets | 6.7 |
| Grant income recognised against other items of operating income | 0.6 |
| Grant income deferred | 1.8 |
| Total Project Grants* | 9.1 |
* Project Grants means project grant funding received and claimed from DESNZ. This includes a deferred liability of £1.8 million, because at the year-end Invinity was still manufacturing the batteries and subsequent to the year end the batteries were delivered. Refer to note 31 for details
Liquidity, Funding and Net Working Capital
The Group ended the year with cash and cash equivalents of £28.8 million at 31 December 2025 compared with £32.4 million at 31 December 2024. Management continues to monitor downside risks closely and retains flexibility to reduce discretionary capital expenditure and tightly manage operating costs should project timing or revenue conversion be delayed.
| 2025 £m |
2024 £m |
2023 £m |
|
| Total inventory | 2.6 | 5.8 | 3.3 |
| Total pre-paid inventory | 1.4 | 2.5 | 1.1 |
| Total Inventory and Pre-paid Inventory | 4.0 | 8.3 | 4.4 |
| Amounts due from customer contracts | 3.3 | 0.8 | 2.5 |
| Receivable from supplier arrangement | 1.9 | - | - |
| Government grant receivable (Copwood) | 1.4 | - | - |
| Contract assets3 | 1.2 | 1.1 | 1.2 |
| Contract liabilities4 | (0.6) | (1.4) | (1.3) |
| Trade payables | (5.6) | (3.0) | (2.2) |
| Provision for contract losses | (2.2) | (1.9) | (0.3) |
| Warranty provision | (0.2) | (0.1) | (0.6) |
| Net Operating Position5 | 3.2 | 3.8 | 3.6 |
3 Contract assets includes accrued income for work done not yet received
4 Contract liabilities includes deferred revenue related to advances on customer contracts
5 Net Operating Position considers wider balance sheet items directly relating to product sales including the Copwood project delivery.
Net Operating Position decreased from £3.8 million in 2024 to £3.2 million in 2025 because of reduced inventory levels primarily reflecting Copwood and increased trade payables of £2.6 million which reflected the timing of supplier invoices received in the final weeks of the year. The decrease in net position was offset largely by a £5.8 million increase in trade, supplier and grant receivables.
Total provisions increased to £2.4 million in 2025 from £2.0 million in 2024 These warranty costs relate to provisions required to service legacy systems and elevated logistics and shipping costs associated with specific project delivery to two remote sites.
Going Concern
The Directors have made an assessment of going concern covering the period from the date of approval of the financial statements to June 2027 and in making this statement, have prepared a cash flow forecast covering this period. The Directors have also considered whether there are any significant events expected to arise beyond the going concern period.
The forecast indicates that the Group expects to remain cash positive during the going concern period, without the requirement for further fundraising. This forecast includes judgements and estimates regarding income from pipeline projects, expected costs of delivering the contracts, and cost mitigation measures including the deferral of discretionary expenditure.
In order to fund expansion of the business, the Directors anticipate that additional funding would be required. The Directors have considered the availability of potential funding sources and the Group's track record in accessing capital markets in forming this assessment.
Invinity has prepared a downside cash forecast for the purposes of the going concern evaluation, which excludes all pipeline contracts that are not yet signed. In this scenario, the forecast assumes a reduction or deferral of costs in order to preserve cash without additional funding. If required, the Directors consider that the Group has the ability to reduce or defer costs without adversely affecting the short-term delivery of contracted income in downside forecast. The outcome of this scenario is that the Company has sufficient cash through the going concern period.
On the basis of this assessment, the Directors are satisfied that the Group has sufficient resources to continue in operation for the going concern period. Accordingly, the financial statements have been prepared on a going concern basis.
Adam Howard
Chief Financial Officer
29 May 2026
President's Report:
Solving Our Customers' Energy Needs
It wasn't long ago that few of us questioned the reliable, low-cost supply of electricity to our homes and businesses. Demand was flat, transmission and distribution grids were reliable, and low-cost power from fuel-based generating assets backed by robust supply chains were the cornerstone of our generating fleet.
Contrast that with today, where energy costs are a major concern in everything from family budgets to corporate strategies. In Great Britain, typical household electricity bills remain on average 42% higher than the winter of 2022. Commercial electricity prices have similarly risen, and by late 2025 were current sitting around 75% above early-2021 averages, reinforcing the need for solutions that improve security of supply and cost predictability.
This dramatic shift has its origins on both the supply and demand sides of our electricity system. Input prices, particularly those tied to natural gas, are increasing supply costs, while electricity demand is increasing even in mature economies for the first time in a generation. But it isn't just average prices, or average demand: Volatility is also on the rise. Geopolitical tensions are triggering whipsaws within global fuels supply chains. The lowest-cost source of new generation is fundamentally intermittent renewable power. And the largest new loads of our modern economy, datacentres, are exhibiting load profiles that are far more stochastic than the dark satanic mills of old.
These trends seem unlikely to end soon. Electricity demand will continue to rise as transport, heating, industry and digital infrastructure electrify. The International Energy Agency expects global electricity demand to grow at least ~4% per year on average through 2030, with emerging markets driving the majority of growth and advanced economies returning to expansion after decades of stagnation.
Supply is an equal challenge. While low-cost solar and wind are scaling quickly, their intermittent nature is stressing the grid as never before, with flexibility and capacity now as critical as bulk electricity supply. Moreover, these assets are often located away from major demand centres, and installing new transmission and distribution build-out is costly and slow.
Together, these forces are leading participants both on the supply and demand side of the industry to look to new solutions to ensure they continue to enjoy reliable, safe, low-cost electricity. Increasingly, energy storage is viewed as one of the most deployable, flexible and low-cost of those solutions.
On the front lines: Generators, Industry and Datacentres
Generators
The falling costs of renewable generation means it is increasingly the dominant power source being built today. Whether projects are the result of utility procurements targeted at specific generation types, or of developers seeking to deliver electrons to wholesale markets at the lowest possible cost, solar and wind power are leading an unprecedented shift. In the UK, sustained wind and solar build-out means renewables now supply more than half of annual electricity generation. As penetration rises, the need to firm variable generation becomes a larger and more investable part of the value chain.
But limits are beginning to emerge; and at Invinity, we get to see first-hand globally how regulators, utilities and generators are adapting. Renewable generation now outstrips consumption in South Australia on a regular basis; for example, the fourth quarter of 2025 saw negative electricity prices in that state a staggering 47.4% of the time. This has significantly enhanced revenues for our customer Yadlamalka Energy from their Spencer Energy solar-plus-storage project.
In California, regulators have taken a different approach by requiring a certain amount of storage to be installed by regulated utilities, with the goal of absorbing excess solar generation then dispatching that energy into evening peaks and so reducing dependence on expensive gas-fired peaking generation. This requirement has led to a massive expansion of California's battery fleet, from 1.3 GW in 2021 to over 17 GW at present. The results speak for themselves: Peak electricity rates in 2022 exceeded $70/kWh over 14% of the time, but by 2025 almost never reached that level. This served not only to help cap electricity users' costs but put a floor under the price at which solar generation was valued in wholesale markets.
Commercial & Industrial Customers
Increasing energy prices affects commercial and industrial users significantly. With no real way to control grid electricity prices and having the continued profitable operation of their businesses as by far their primary focus, they've long been seen as important but passive players in the electricity system.
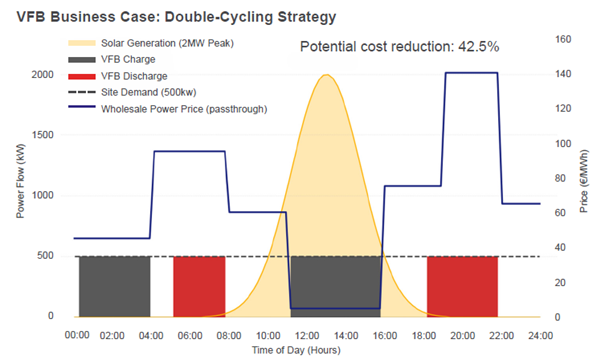
The shift from a centralised to a more distributed paradigm within the electricity system has changed that. Recent years have seen individual companies participate either by engaging in demand reduction programmes, or by building their own on-site generation capacity, often using solar PV generation.
From Scottish Water's site at Perth, to the recently commissioned Viejas Resort and Casino in Southern California, Invinity has long helped businesses reduce their electricity costs. Many of our early deployments were intended to enhance decarbonisation efforts; more recently, ever-cheaper solar panels have enhanced how our batteries and PV together can significantly lower energy costs and reduce exposure to volatile power markets. In parallel, resilience has become a more prominent driver as many sites seek greater control over critical power supply.
What we hear from all site operators is that no matter the economic impact, safety is paramount. No amount of electricity savings will compensate for the impact of a fire at site, or injury to personnel. Such concerns are leading many of the facility operators we speak with to reconsider deploying lithium-ion systems close to critical facilities or large workforces. These concerns are further enhancing their interest in our storage solutions because they enjoy significantly a lower operational risk profile.
Datacentres
Growth in AI, cloud computing and digital services is driving a step-change in electricity demand from datacentres. AI learning workloads are already creating larger and faster load swings than more traditional cloud computing applications, since the tasks are synchronized to achieve maximum effect. This means whole datacentre loads can fluctuate from zero to 100% of rated power draw on a second-by-second basis. Batteries can help with this, but the duty cycle is punishing. Frequent full charge-to-discharge swings will dramatically accelerate degradation of conventional lithium batteries.
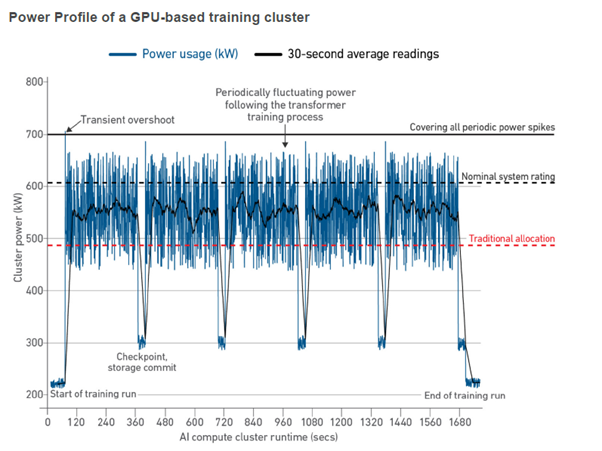
Source: https://journal.uptimeinstitute.com/electrical-considerations-with-large-ai-compute/
Datacentre operators have consistently viewed securing reliable access to low-cost power as a main driver for where these facilities can be located, and how much computing power they can include. Connection queues and lead times frequently shape deployment plans, with some projects unable to secure grid capacity to match intended commissioning dates. As a result, many datacentre developers and operators are evaluating on-site generation paired with storage to improve certainty of supply, maintain resilience and reduce exposure to peak pricing.
Different purposes, but common needs
There are common themes that emerge when talking with our existing and potential customers about how they are, or expect to, make ever more valuable use of our batteries. Broadly, those include the ability to cycle frequently, dispatch flexibly, be easy to permit and install, and to reliably deliver their intended use for years or even decades.
Cycling regularly enables energy storage assets to supply electricity when generation is unavailable or insufficient and absorbs excess generation when it is abundant. In many operating regimes, that means cycling more than once per day to firm renewables and support grid and site-level flexibility. AI datacentres are pushing this to the extreme, with cycle times in minutes and ramp rates consistently measured in milliseconds.
Flexibility is equally important, as simply being able to charge and discharge doesn't meet the needs of many users. From solar power generators looking to absorb swings in PV output, to datacentre operators looking to manage shifting loads, maximising operational flexibility without limiting performance or durability irrespective of a battery's state of charge is key to maximising the jobs a battery can do for its owners.
Permitting can be a gating factor for storage projects, influencing timelines, cost and the ability to install in certain regions. Some technologies require extensive safety mitigations to address fire risk and environmental concerns, adding time, cost and complexity. Noise considerations can also influence approvals, particularly near urban centres. And in some regions, local or regional governments have adopted statues banning certain batteries outright, citing fire safety concerns.
Longevity is critical as our electric grid depends on equipment designed to operate for decades. As demand rises and systems rely more heavily on storage, customers and investors place increasing value on solutions that can sustain performance over long operating lives. Moreover, durable assets mean predictable operating costs and avoided refurbishment or augmentation costs, improving return-on-investment while minimising lifecycle environmental impacts.
Storage capacity is the fundamental measure of any battery's performance, but many grid-connected storage technologies capacity degrades significantly over time. This can mean additional augmentation or replacement, especially when customers need their batteries to cycle frequently. For multi-decade assets, retaining usable capacity is a material decision factor. Technologies that sustain capacity and performance can reduce lifetime cost and operational uncertainty. Consistency supports underwriting and planning confidence for operators and investors across long operating horizons.
Invinity's VFBs - The tie that binds
Invinity's VFBs are already serving customers all over the world. Our Endurium and Endurium Enterprise products have proven their ability to cycle better with fewer operating restrictions, be easier to permit and last longer than the lithium-ion batteries being deployed into similar applications.
As long-duration storage moves from pilot activity to scaled procurement, we know that our products combine durability, a strong safety profile and predictable lifetime performance and can deliver a meaningful advantage to our customers. Why?
· Because they're built for durability and flexibility, performing in the most demanding applications while delivering limitless cycles over decades of service;
· because they have materially better environmental credentials and high recyclability while facilitating easier permitting;
· because they are scalable across a wide variety of project sizes, sites and climatic conditions; and
· because over and over again, our customers tell us how our vanadium flow batteries have outperformed expectations, delivering capabilities above and beyond what they were originally intended to do.
Manufactured in Britain and Canada, Invinity's Endurium VFBs are ideally positioned to support the grid by enhancing reliability, reduce reliance on expensive fossil generation and unlock higher renewable penetration. Behind the meter, they offer a uniquely capable solution for controlling loads from factories and datacentres, without the unknowns around fire safety, permitting and operating life that are lithium's hallmarks. As energy storage continues to prove its place as the cornerstone of the future of electricity supply and demand, Invinity's batteries are increasingly obvious as the right choice.
Matt Harper
President
29 May 2026
Financial Statements
Consolidated Statement of Profit and Loss
For the year ended 31 December 2025
| 2025 | 2024 (Unaudited)1 | ||
| Note | £000 | £000 | |
| Revenue | 4 | 8,182 | 5,015 |
| Cost of Sales | 5 | (11,047) | (8,528) |
| Gross Loss | (2,865) | (3,513) | |
| Operating Costs | |||
| Administrative expenses | 6 | (21,895) | (20,334) |
| Other items of operating income | 10 | 1,092 | 236 |
| Other items of operating expense | 10 | (950) | (446) |
| Loss from Operations | (24,618) | (24,057) | |
| Finance income | 11 | 843 | 1,358 |
| Finance costs | 11 | (147) | (106) |
| (Loss)/Gain on foreign currency transactions | 11 | (172) | 8 |
| Net Finance Income | 524 | 1,260 | |
| Loss Before Income Tax | (24,094) | (22,797) | |
| Income tax expense | 12 | - | - |
| Loss for the Year | (24,094) | (22,797) | |
| Loss per Ordinary Share in Pence | |||
| Basic | 13 | (5.1) | (6.7) |
| Diluted | 13 | (5.1) | (6.7) |
1Refer to note 1
The above consolidated statement of profit and loss should be read in conjunction with the accompanying notes.
Consolidated Statement of Comprehensive Income
For the year ended 31 December 2025
| 2025 | 2024 (Unaudited)1 | ||
| £000 | £000 | ||
| Loss for the Year Other Comprehensive Expense Items that may be Reclassified Subsequently to Profit or Loss: |
(24,094) | (22,797) | |
| Exchange differences on the translation of foreign operations | (96) | (355) | |
| Total Comprehensive Loss for the Year | (24,190) | (23,152) |
1Refer to note 1
The above consolidated statement of comprehensive income should be read in conjunction with the accompanying notes.
Consolidated Statement of Financial Position
As at 31 December 2025
| 2025 | 2024 (Unaudited)1 | ||
| Note | £000 | £000 | |
| Non-Current Assets | |||
| Goodwill and other intangible assets | 15 | 23,948 | 23,959 |
| Property, plant and equipment | 16 | 10,360 | 2,346 |
| Right-of-use assets | 17 | 1,640 | 1,526 |
| Contract assets | 21 | 225 | - |
| Other non-current assets | 19 | 191 | - |
| Total Non-Current Assets | 36,364 | 27,831 | |
| Current Assets | |||
| Inventory | 20 | 2,636 | 5,753 |
| Contract assets | 21 | 978 | 1,149 |
| Trade receivables | 22 | 3,260 | 827 |
| Other current assets | 23 | 9,019 | 7,648 |
| Cash and cash equivalents | 24 | 28,789 | 32,352 |
| Total Current Assets | 44,682 | 47,729 | |
| Total Assets | 81,046 | 75,560 | |
| Current Liabilities | |||
| Trade and other payables | 25 | (7,539) | (4,525) |
| Derivative financial instruments | 26 | (135) | (271) |
| Contract liabilities | 21 | (649) | (1,392) |
| Lease liabilities | 27 | (643) | (550) |
| Provisions | 21 | (946) | (381) |
| Other liabilities | 28 | (1,812) | - |
| Total Current Liabilities | (11,724) | (7,119) | |
| Net Current Assets | 32,958 | 40,610 | |
| Non-Current Liabilities | |||
| Lease liabilities | 27 | (1,352) | (1,145) |
| Provisions | 21 | (1,493) | (1,627) |
| Other liabilities | (43) | - | |
| Total Non-Current Liabilities | (2,888) | (2,772) | |
| Total Liabilities | (14,612) | (9,891) | |
| Net Assets | 66,434 | 65,669 | |
| Equity | |||
| Called up share capital | 29 | 5,688 | 53,473 |
| Share premium | 29 | 22,872 | 215,121 |
| Share-based payment reserve | 29 | 8,129 | 7,328 |
| Merger reserve | 29 | 264,188 | - |
| Accumulated losses | 29 | (232,164) | (208,070) |
| Currency translation reserve | 29 | (2,318) | (2,222) |
| Other reserves | 29 | 39 | 39 |
| Total Equity | 66,434 | 65,669 |
1Refer to note 1
The above consolidated statement of financial position should be read in conjunction with the accompanying notes.
The financial statements were authorised by the Board of Directors and authorised for issue on 29 May 2026 and were signed on its behalf by:
Adam Howard
Director
Consolidated Statement of Changes in Equity
As at 31 December 2025
| Called up Share Capital | Share Premium | Share-based Payment Reserve | Accumulated Losses | Currency Transla-tion Reserve | Merger Reserve | Other Reserves | Total | |
| £000 | £000 | £000 | £000 | £000 | £000 | £000 | £000 | |
| At 1 January 2025 | 53,473 | 215,121 | 7,328 | (208,070) | (2,222) | - | 39 | 65,669 |
| Loss for the year | - | - | - | (24,094) | - | - | - | (24,094) |
| Other Comprehensive Income | ||||||||
| Foreign currency translation differences | - | - | - | - | (96) | - | - | (96) |
| Total Comprehensive Loss for the Year | - | - | - | (24,094) | (96) | - | - | (24,190) |
| Transactions with Owners in their Capacity as Owners | ||||||||
| Group reorganisation adjustment | (53,473) | (215,121) | - | - | - | 268,594 | - | - |
| Shares issued on redomiciliation | 61,679 | (61,679) | - | |||||
| Reduction of share capital | (57,273) | - | 57,273 | - | ||||
| Investment funding arrangement, net of transaction costs | 1,282 | 22,872 | - | - | - | - | - | 24,154 |
| Share-based payments | - | - | 801 | - | - | - | - | 801 |
| Total Contributions by Owners | (47,785) | (192,249) | 801 | - | - | 264,188 | - | 24,955 |
| At 31 December 2025 | 5,688 | 22,872 | 8,129 | (232,164) | (2,318) | 264,188 | 39 | 66,434 |
The above consolidated statement of changes in equity should be read in conjunction with the accompanying notes.
As at 31 December 2024 (Unaudited)1
| Called up Share Capital | Share Premium | Share-based Payment Reserve | Accumul-ated Losses | Currency Transla-tion Reserve | Other Reserves | Total | |
| £000 | £000 | £000 | £000 | £000 | £000 | £000 | |
| At 1 January 2024 | 51,348 | 162,883 | 6,683 | (185,273) | (1,867) | 39 | 33,813 |
| Loss for the year | - | - | - | (22,797) | - | - | (22,797) |
| Other Comprehensive Income | |||||||
| Foreign currency translation differences | - | - | - | - | (355) | - | (355) |
| Total Comprehensive Loss for the Year | - | - | - | (22,797) | (355) | - | (23,152) |
| Transactions with Owners in their Capacity as Owners | |||||||
| Investment funding arrangement, net of transaction costs | 2,125 | 52,234 | - | - | - | - | 54,359 |
| Exercise of share options | 4 | - | - | - | - | 4 | |
| Share-based payments | - | - | 645 | - | - | - | 645 |
| Total Contributions by Owners | 2,125 | 52,238 | 645 | - | - | - | 55,008 |
| At 31 December 2024 | 53,473 | 215,121 | 7,328 | (208,070) | (2,222) | 39 | 65,669 |
1Refer to note 1
The above consolidated statement of changes in equity should be read in conjunction with the accompanying notes.
Consolidated Statement of Cash Flows
For the year ended 31 December 2025
| 2025 | 2024 (Unaudited)1 | ||
| Note | £000 | £000 | |
| Cash Flows from Operating Activities | |||
| Cash used in operations | 14 | (17,682) | (26,147) |
| Interest received | 475 | 1,222 | |
| Interest paid | (1) | (13) | |
| Net Cash Outflow from Operating Activities | (17,208) | (24,938) | |
| Cash Flows from Investing Activities | |||
| Acquisition of property, plant and equipment | 16 | (1,507) | (1,294) |
| Acquisition of property, plant and equipment for battery project under construction | 16 | (13,938) | - |
| Prepayments of property, plant and equipment for battery project under construction | (1,558) | ||
| Grant income received against capital projects | 31 | 7,499 | - |
| Deposit on right-of use assets | - | (7) | |
| Net Cash Outflows from Investing Activities | (9,504) | (1,301) | |
| Cash Flows from Financing Activities | |||
| Payment of lease liabilities | 27 | (870) | (768) |
| Sublease deposit received | 43 | - | |
| Sublease payments received | 19 | 94 | 44 |
| Proceeds from the issue of share capital | 25,000 | 57,383 | |
| Proceeds from the exercise of share options and warrants | - | 4 | |
| Payment of transaction costs for the issue of share capital | (846) | (3,001) | |
| Net Cash Inflow from Financing Activities | 23,421 | 53,662 | |
| Net increase/(decrease) in cash and cash equivalents | (3,291) | 27,423 | |
| Cash and cash equivalents at the beginning of the year | 32,352 | 5,014 | |
| Effects of exchange rate changes on cash and cash equivalents | (272) | (85) | |
| Cash and Cash Equivalents at the End of the Year | 28,789 | 32,352 |
1Refer to note 1
The above consolidated statement of cash flows should be read in conjunction with the accompanying notes.
Notes
1 General Information
Invinity Energy Systems plc (the 'Company') is a public company limited by shares incorporated and domiciled in the UK. The registered office address is Room 3.03, 24 Chiswell Street, London, EC1Y 4TY.
The Company is quoted on the AIM Market of the London Stock Exchange with the ticker symbol IES.L.
During the year, the Group undertook a corporate reorganisation to redomicile the parent company from Jersey to the UK. As part of this reorganisation, a new UK-incorporated parent entity, Invinity Energy Systems plc, was inserted at the top of the Group through a share-for-share exchange. The transaction resulted in the Company becoming the ultimate parent of the Group. The reorganisation did not result in a change in the underlying business, operations, or economic substance of the Group and has been accounted for as a group reconstruction.
The comparative information presented has been derived from the consolidated financial statements previously audited for the predecessor group. While those financial statements related to a different legal entity, the underlying business and operations are unchanged. Accordingly, the Directors consider the comparative information to be representative of the Group's financial performance. The auditor's report on the current period financial statements does not extend to the comparative information in respect of the prior period. Therefore, the comparative information, including the notes, is presented as unaudited.
The prior year comparatives are unchanged from the previously published audited consolidated financial statements of the Group.
The principal activities of the Company and its subsidiaries (together the 'Group') relate to the manufacture and sale of vanadium flow battery systems and associated installation, warranty and other services.
2 Accounting Policies
Basis of Preparation
These consolidated financial statements have been prepared in accordance with International UK-adopted International Accounting Standards, the associated interpretations issued by the IFRS Interpretations Committee (together 'IFRS').
The accounting policies applied in preparing these consolidated financial statements are set out below. These policies have been consistently applied throughout the period and to each subsidiary within the Group.
The financial statements have been prepared under the historical cost convention except where stated.
Basis of Consolidation
Subsidiaries are all entities over which the Company has control. The Company controls an entity when it is exposed to, or has rights over, variable returns from its involvement with the entity and can affect those returns through its ability to exercise control over the entity. Subsidiaries are consolidated in the Group financial statements from the date at which control is transferred to the Company.
Subsidiaries are deconsolidated from the date that control ceases. The ability to control an entity may cease because of the sale of a subsidiary or other change in the Company's shareholding in that subsidiary, voting rights or board representation.
Transactions and balances between companies forming part of the Group together with any unrealised income and expenses arising from intra-group transactions are eliminated in the preparation of the consolidated financial statements of the Group.
Refer to note 35 - Group entities
Going Concern
The Directors have made an assessment of going concern covering the period from the date of approval of the financial statements to June 2027 and in making this statement, have prepared a cash flow forecast covering this period. The Directors have also considered whether there are any significant events expected to arise beyond the going concern period.
The forecast indicates that the Group expects to remain cash positive during the going concern period, without the requirement for further fundraising. This forecast includes judgements and estimates regarding income from pipeline projects, expected costs of delivering the contracts, and cost mitigation measures including the deferral of discretionary expenditure.
In order to fund expansion of the business, the Directors anticipate that additional funding would be required. The Directors have considered the availability of potential funding sources and the Group's track record in accessing capital markets in forming this assessment.
Invinity has prepared a downside cash forecast for the purposes of the going concern evaluation, which excludes all pipeline contracts that are not yet signed. In this scenario, the forecast assumes a reduction or deferral of costs in order to preserve cash without additional funding. If required, the Directors consider that the Group has the ability to reduce or defer costs without adversely affecting the short-term delivery of contracted income in downside forecast. The outcome of this scenario is that the Company has sufficient cash through the going concern period.
On the basis of this assessment, the Directors are satisfied that the Group has sufficient resources to continue in operation for the going concern period. Accordingly, the financial statements have been prepared on a going concern basis.
New Standards, Amendments and Interpretations Effective and Adopted by the Group in 2025
Amendments to existing standards previously issued by the IASB with effective dates during the year ended 31 December 2025 are summarised below. There was no effect on the Group's consolidated financial statements for the year ended 31 December 2025 as a result of the adoption of these amendments.
Amendments to 'IAS 21 The Effects of Changes in Foreign Exchange Rates - Lack of Exchangeability'
The Group has adopted the amendments to IAS 21 for the first time in the current year. The amendment clarifies the assessment of exchangeability and the determination of an exchange rate when exchangeability is lacking. The adoption of the amendment did not have a material impact on the Group's financial statements.
New Standards and Interpretations Not Yet Adopted
Certain new accounting standards and interpretations have been published that are not mandatory for 31 December 2025 reporting periods and have not been early adopted by the Company.
| Applicable Standard | Key requirements or changes in accounting policy |
| IFRS 9 Financial Instruments and IFRS 7 Financial Instruments: Disclosures - Classification and measurement of financial instruments Effective for periods beginning on or after 1 January 2026 |
In May 2024, the International Accounting Standards Board (IASB) amended IFRS 7 and IFRS 9, which includes clarifications on recognition and derecognition dates of certain financial assets and liabilities, including exceptions for liabilities settled through electronic cash transfer systems. |
| Annual Improvements to IFRS Accounting Standards - Volume 11 Effective for periods beginning on or after 1 January 2026 |
- IFRS 1 First-time Adoption of International Financial Reporting Standards - Hedge accounting by a first-time adopter; - IFRS 7 Financial Instruments: Disclosures - Gain or loss on derecognition - IFRS 7 Financial Instruments: Disclosures - Deferred difference between fair value and transaction price; - IFRS 7 Financial Instruments: Disclosures - Credit risk disclosures - IFRS 9 Financial Instruments - Lessee derecognition of lease liabilities; - IFRS 9 Financial Instruments - Transaction price; - IFRS 10 Consolidated Financial Statements - Determination of a De Facto Agent; and - IAS 7 Statement of Cash flows - Cost method. |
| IFRS 18 Presentation and Disclosure in Financial Statements Effective for periods beginning on or after 1 January 2027 |
IFRS 18 will replace IAS 1 Presentation of Financial Statements. The amendment impacts presentation and disclosure of the consolidated income statement with new defined categories being operating, investing and financing to provide a consistent structure. Disclosures about Management-defined Performance Measures (i.e. certain non-GAAP measures) will have to be disclosed in the financial statement with reconciliations to GAAP measures. The new standard will also provide guidance on grouping of information (aggregation/disaggregation). The standard will be applied from its mandatory effective date of 1 January 2027. Final impact assessment and transition activities will take place during 2026 and with the main impacts expected on the presentation of the consolidated statement of profit and loss. |
| IFRS 19 Subsidiaries without Public Accountability: Disclosures Effective for periods beginning on or after 1 January 2027 |
In May 2024, the Board issued IFRS 19 Subsidiaries without Public Accountability: Disclosures, which allows eligible entities to elect to apply reduced disclosure requirements while still applying the recognition, measurement and presentation requirements in other IFRS accounting standards. Unless otherwise specified, eligible entities that elect to apply IFRS 19 will not need to apply the disclosure requirements in other IFRS accounting standards. |
The Directors are evaluating the impact that these standards will have on the financial information of the Group.
Foreign Currency
Presentation Currency
The consolidated financial statements are presented in Great British Pounds (GBP) rounded to the nearest thousand (£000), except where otherwise indicated.
Functional Currency
Items included in the financial information of the individual companies that comprise the Group are measured using the currency of the primary economic environment in which each subsidiary operates (its functional currency).
Foreign Currency Transactions
Transactions in currencies other than an entity's functional currency (foreign currencies) are translated using the exchange rate on the date of the transaction. Foreign exchange gains and losses resulting from the settlement of transactions denominated in a foreign currency are translated into functional currency using the relevant exchange rate at the date of the transaction.
Foreign exchange gains and losses resulting from the settlement of foreign currency transactions and from the translation at the balance sheet date of monetary assets and liabilities denominated in foreign currencies, are recognised in the consolidated statement of comprehensive loss within gains/(losses) on foreign currency transactions.
Foreign currency gains/(losses) realised on the retranslation of subsidiaries as part of the year-end consolidation are recorded in the translation reserve that forms a part of shareholders' funds in the consolidated financial statements of the Group.
Foreign Currency Operations
Subsidiaries of the Company may have functional currencies that are different from that of the Company. Since the Group financial statements are presented in GBP, the assets and liabilities of foreign currency subsidiaries consolidated into these financial statements are translated into the Group's presentational currency using exchange rates prevailing at the end of the reporting period. Income and expense items are similarly translated using the average rate for each month during the year. The exchange rates on the actual dates of transactions are used where exchange rates fluctuate significantly within a month. Exchange differences arising on consolidation are recognised in other comprehensive income and are accumulated as part of shareholder's equity.
Operating Segments
The Group is organised internally to report to the Executive Directors as a whole. The Executive Directors comprise the Chief Executive Officer, the President and the Chief Financial Officer. The Executive Directors, as a group, have been determined, collectively, to prosecute the role of chief operating decision maker of the Group. The chief operating decision maker is ultimately responsible for entity-wide resource allocation decisions, the evaluation of the financial, operating and ESG performance of the Group.
The Group's activities have been determined to represent a single operating segment being the provision of vanadium flow batteries and ancillary services, principally comprising installation and integration services, and the provision of extended warranties for battery units sold.
Revenue
The Group generates revenue from the sale of battery storage systems integration hardware, installation, extended warranty and other services. These multiple elements are separate performance obligations that are derived from contractual arrangements with customers. The sales contracts do not include a general right of return.
For contracts that contain multiple elements or promises, the Group accounts for individual goods and services separately if they are distinct. A product or service is distinct if it is separately identifiable from other items in the agreement and where a customer can benefit from the good or service on its own or together with other resources that are readily available.
The consideration paid for each performance obligation is typically fixed. A significant portion of the aggregate payment due under a contract for sale is normally due before delivery or completion of the service. The total consideration under the contract is allocated between the distinct performance obligations contained in the contract based on their stand-alone selling prices. The stand-alone selling price is estimated using an adjusted market assessment approach that looks to industry benchmarks for certain standalone products or services. For other performance obligations, stand-alone selling price is estimated based on established processes, including budgeting tools, market labour rates and third-party quotes.
The Group measures revenue based on the consideration specified in the contracts for sale with customers. Revenue is recognised when a performance obligation is satisfied by transferring control over a good or service to a customer. With respect to the battery system, associated control systems and integration hardware, control is transferred at a point in time and is usually based on the contractual shipping terms. In certain instances, the battery system and integration hardware may be ready for delivery although the customer is not ready to receive the product. The Group will recognise revenue in accordance with IFRS 15 as a bill-and-hold arrangement if all of the following conditions are satisfied:
§ the reason for the bill-and-hold arrangement is substantive;
§ the battery systems and hardware are identified separately as belonging to the customer;
§ the battery systems and hardware are currently ready for physical transfer to the customer; and
§ the Company does not have the ability to use the product or to direct it to another customer.
With respect to the services that includes installation and commissioning, the performance obligation is usually satisfied at a point in time when a commissioning certificate or site performance report has been issued to the customer. Revenue excludes any taxes such as sales taxes, value added tax or other levies that are invoiced and collected on behalf of third parties, such as government tax authorities.
In addition, under the terms of its contracts for sale, the Group may be responsible for other services such as storing and delivering battery systems to its customers. When this is the case, the Group will invoice the relevant customer for, and will recognise as revenue, any charges incurred together with any associated handling costs. Revenue is recognised for the storage services over time as the services are delivered and for shipping services at a point in time when the goods are delivered to the agreed upon location. The related costs incurred by the Group for storage, shipping and handling services are recognised as cost of sales concurrent with the recognition of the associated revenue.
The Group may also enter into arrangements to license its intellectual property and associated technical know-how. Royalty revenue from licences that provide a right to use intellectual property is recognised at the point in time when the customer obtains control of the licence. This occurs when the customer obtains the ability to direct the use of and derive substantially all of the remaining benefits from the licensed intellectual property without further substantive ongoing obligations from the Group.
Grant Income
Government and other grants received are recognised in the consolidated statement of profit and loss in the period that the related expenditure is incurred.
Grants relating to income are recognised in profit or loss on a systematic basis over the periods in which the Group recognises the related costs. Such grants are presented as a reduction of the related expense line or as other items of operating income.
Grants relating to the acquisition or construction of assets are recognised by deducting the grant from the carrying amount of the asset, resulting in a reduced depreciation charge over the asset's useful life.
Grant income received in advance of the associated expenditure is presented as deferred income within other liabilities. Amounts are recognised in profit and loss as the associated expenditure is incurred or, where applicable, deducted from the carrying amount of the related capital expenditures.
Grant income receivable is presented within other assets until such time as it can be claimed or is received.
Finance Income and Costs
Finance income comprises interest on cash deposits, foreign currency gains and the unwind of discount on any assets that are carried at amortised cost. Interest income is recognised as it accrues using the effective interest rate method.
Finance costs include foreign currency losses and the unwind of the discount on any liabilities held at amortised cost, such as lease liabilities arising from lease contracts.
Employee Benefits
Short-term Benefits
Benefits provided to employees that are short-term in nature are recognised as expenses in the statement of profit and loss as the related service is provided. The principal short-term benefits given to employees are salaries, associated holiday pay and other periodic benefits such as healthcare and pension contributions made by the Group for the benefit of the employee. A liability is recognised for the amount expected to be paid under short-term cash bonus plans if there is either a present legal or constructive obligation to pay the amount and the amount can be reliably estimated.
Share-based Payments
The Group operates equity-settled share-based compensation plans, under which it compensates employees for services rendered through the issue of equity instruments, deferred share awards or options to subscribe for ordinary shares of the Group. The fair value of the employee services received in exchange for the grant of the equity instruments, shares or options is recognised as an expense. The total amount to be expensed is determined by reference to the fair value of the options granted:
§ including any market conditions (for example, the Group's share price);
§ excluding the impact of any service and non-market performance vesting conditions (for example, profitability, sales, growth targets, and the requirement to remain as an employee of the Group over a specified period); and
§ including the impact of any non-vesting conditions.
Non-market performance and service conditions are included in the assumptions regarding the number of options that are expected to vest. The total expense is recognised over the vesting period, which is the period over which all the specified vesting conditions are to be satisfied.
In some circumstances, employees may provide services in advance of the grant date and therefore the grant date fair value is estimated for the purposes of recognising the expense during the period between service commencement and the grant date.
At the end of each reporting period, the Group revises its estimates of the number of options that are expected to vest based on the non-market vesting conditions. It recognises the impact of the revision to original estimates, if any, in the consolidated statement of profit and loss, with a corresponding adjustment to equity.
Any social security contributions payable in connection with the grant of the share options is considered an integral part of the grant itself, and the charge will be treated as a cash-settled transaction.
Taxes
The total tax charge or credit recognised in the statement of profit and loss comprises both current and deferred taxes. Taxation is recognised in the consolidated statement of profit and loss except to the extent that it relates to a business combination or items recognised directly in equity or other comprehensive income.
Current Tax
The current tax charge is based on the taxable profit for the year. Taxable profit or loss is different from the profit or loss reported in the statement of profit and loss as it excludes items of income and/or expense that are taxable or deductible in other years (temporary differences) and it further excludes items that are never taxable nor deductible (permanent differences).
Deferred Tax
Deferred tax is the tax that is expected to be payable or recoverable on differences between the carrying value of assets and liabilities in the financial statements and the corresponding value of those assets and liabilities used to calculate taxable profit or loss.
Deferred tax assets are recognised for all deductible temporary differences, the carry forward of unused tax credits and any unused tax losses. Deferred tax assets are recognised to the extent that it is probable that taxable profit will be available against which the deductible temporary differences, and the carry forward of unused tax credits and unused tax losses can be utilised.
Deferred tax assets and liabilities are recognised using the liability method for all taxable temporary differences, except in respect of taxable temporary differences associated with investments in subsidiaries and associates. Where the timing of the reversal of temporary difference arising from such investment related assets and liabilities can be controlled and it is probable that the temporary difference will not reverse in the foreseeable future then the Group does not recognise deferred tax liabilities on these items.
A deferred tax asset or liability is not recognised if a temporary difference arises on initial recognition of an asset or liability and, at the time of the transaction, affects neither the accounting profit nor taxable profit or loss.
Current and deferred tax is calculated using tax rates and laws that have been enacted or substantively enacted at the balance sheet date. Deferred tax balances are presented on a gross basis. Refer to note 18, deferred tax balances.
Earnings per Share
The Group presents basic and diluted earnings per share ("EPS") data for its ordinary shares. Basic EPS is calculated by dividing the profit or loss attributable to ordinary shareholders of the Company by the weighted average number of ordinary shares outstanding during the year.
Diluted EPS is determined by adjusting the weighted average number of ordinary shares outstanding used in the EPS calculation to include all potentially dilutive ordinary shares, which, in the case of the Company, represents additional shares that could be issued in relation to 'in-the-money' convertible notes, warrants or share options.
The effects of anti-dilutive potential ordinary shares are ignored in calculating diluted EPS. Anti-dilution is when an increase in earnings per share or a reduction in loss per share would result from the exercise of such options, warrants or convertible instruments.
Intangible Assets
Goodwill
The Group allocates the fair value of the purchase consideration on the acquisition of a subsidiary to the assets acquired and liabilities assumed based on an assessment of fair value at the acquisition date. Any excess of purchase consideration is recognised as goodwill. Where goodwill is recognised, it is allocated to the cash generating units (CGUs) in a systematic manner reflective of how the Group expects to recover the value of the goodwill. Because the Group has been determined to consist of a single business unit, the carrying value of goodwill is tested for impairment based on the recoverable value of the Group as a whole.
Goodwill is not amortised but is tested for impairment on an annual basis, and the Group will also test for impairment at other times if there is an indication that an impairment may exist. Determining whether goodwill is impaired requires an estimation of recoverable amount based on the higher of its value in use and fair value less costs of disposal. The key estimates are therefore the selection of the suitable discount rates and the estimation of future growth rates which may depend on specific risks and the anticipated economic and market conditions related to the CGU.
Goodwill is impaired where circumstances indicate that the recoverable amount of the underlying CGU may no longer support the carrying value of the CGU. An impairment charge is recognised in the statement of profit and loss for the period in which it is determined the goodwill is no longer recoverable. Impairment losses related to goodwill cannot be reversed in future periods.
Internally Generated Intangible Assets - Research and Development Costs
Research
Expenditure on research activities is recognised as an expense in the period in which it is incurred. Research activities are aimed at creating new knowledge or the use of existing knowledge in new or creative ways to generate new concepts. Research activity does not typically have a defined commercial objective at the outset.
Development
Where projects evolve toward commerciality or are related to a specific commercial objective they are assessed to determine whether the activity constitutes development that is associated with a commercial objective or practical application.
The associated costs represent development costs and can be capitalised if, and only if, the following conditions can be demonstrated:
§ the technical feasibility of completing the intangible asset so that it can be made available for use or sale;
§ the intention to complete the intangible asset for use or sale;
§ the availability of adequate technical, financial and other resources to complete the development and to use or sell it;
§ an asset is created that can be separately identified for use or sale;
§ it is probable that the asset created will generate future economic benefits; and
§ the development cost of the asset can be measured reliably.
Development work undertaken by the Group typically relates to the refinement of design, materials selection, construction techniques, firmware and control systems to enhance battery system performance over successive generations. Where development costs are capitalised, they are amortised over the expected period to the introduction of the next generation of battery system.
Amortisation is recorded over that period on a straight-line basis with the corresponding amortisation charge recognised in the statement of profit and loss as a component of administrative expenses.
Other Intangible Assets
Intangible assets other than goodwill that are acquired by the Group are stated at their historical cost of acquisition less accumulated amortisation and any impairment losses.
Software and Purchased Domain Names
Acquired domain names are initially capitalised at cost of purchase. Amortisation is charged to administrative expenses over the expected useful life of the domain name which has been assessed as ten years from the date of acquisition.
Patents and Certifications
Patent rights and certifications are initially capitalised at the cost of applying for relevant patent rights and other protections, and certifications. Amortisation is charged to administrative expenses over the expected useful life of the patents and certifications which has been assessed as five years from the date of acquisition.
Property, Plant and Equipment
Items of property, plant and equipment are stated at historical cost less accumulated depreciation and any impairment losses. Historical cost includes expenditure that is directly attributable to the acquisition of the items. Subsequent expenditure is only included in the asset's carrying amount or recognised as a separate asset, as appropriate, when it is probable that future economic benefits associated with that item will flow to the Group.
Costs that do not enhance the value of an asset such as repair and maintenance costs are charged to the statement of profit and loss in the period in which they are incurred.
Depreciation is charged to write off the cost of assets over their estimated useful lives on a straight-line basis. Depreciation commences on the date the assets are available for use. Work-in-progress assets are not depreciated until they are available for use and transferred to the appropriate category of property, plant and equipment.
Estimated useful lives for property, plant and equipment and other intangible assets are:
| Category | Period (Years) | Recognition in Statement of Profit and Loss |
| Computer and office equipment | 3 - 5 | Administrative expenses |
| Leasehold improvements | Shorter of lease term or useful life | Administrative expenses / Cost of sales |
| Vehicles | 3 | Administrative expenses |
| Manufacturing equipment and tooling | 3 - 20 | Cost of sales |
| R&D Equipment | 5 - 10 | Administrative expenses |
| Assets under construction | To be determined once operational | Administrative expenses / Cost of sales |
| Software and purchased domain names | 3 - 10 | Administrative expenses |
| Patents and certifications | 5 | Administrative expenses |
Depreciation methods, useful lives and residual values of assets are reviewed, and adjusted prospectively as appropriate, at each reporting date.
Where an asset is disposed of, the corresponding gain or loss on disposal is determined by comparing the sales proceeds received with the carrying amount of that asset at the date of disposal. Gains or losses on disposal of fixed assets are included within other items of operating income and expense in the statement of profit and loss.
Impairment of Tangible and Intangible Assets
The Group reviews the carrying values of its tangible and intangible assets, other than goodwill, at each balance sheet date to determine if any indicators exist that could mean those assets are impaired. Where an indicator of impairment exists the recoverable amount of the relevant asset (or CGU) is estimated to determine the amount of any potential impairment loss.
Recoverable amounts are determined using a discounted cash flow model related to each asset or CGU being assessed. The discount rate applied to the cash flows in the model is a pre-tax discount rate that reflects market assessment of the time value of money and risks specific to the groups of assets being considered.
If the recoverable value estimated in the cash flow model for a specific asset (or CGU) is lower than the carrying value, then the carrying value of the asset is reduced to its estimated recoverable value with a corresponding charge immediately recognised in the statement of profit and loss.
Where the condition that gave rise to an impairment loss reverses in a subsequent period, the impairment loss is similarly reversed and the carrying value of the asset increased to the revised estimate of its recoverable value. The carrying value of an asset immediately following the reversal of an impairment cannot exceed the carrying value that the asset would have had if the original impairment had not been made and the asset was depreciated as normal. A reversal of an impairment loss is recognised immediately in profit or loss.
The value of any impairment (or reversal of impairment) of an asset is recorded in the same financial statement line item where depreciation or amortisation of the asset would normally be shown.
Where it is impractical to meaningfully assess recoverable amount using a discounted cash flow model, for instance where near term cash flows are low or negative, an assessment of the fair value adjusted for the costs that would be incurred in the disposal of an asset or operation is used. This is typically the case for development stage assets, operations or associated intangible assets (including goodwill) where the underlying products or technologies have not yet been commercialised.
Provisions
Provisions are established when the Group has a present legal or constructive obligation because of past events. It is probable that an outflow of resources will be required to settle the obligation and the amount of that outflow can be reliably estimated.
Provisions are measured at the Group's best estimate of the expenditure required to settle the obligation at the financial position date, considering the risks and uncertainties of the obligation, and are discounted to present value of the expenditures that are expected to be incurred in settling the obligation using a pre-tax discount rate that reflects current market assessment of the time value of money and the risks related to the obligation. The initial recognition of a provision results in a corresponding charge to profit or loss. Where discounting is used, the carrying amount of a provision increases in each period to reflect the passage of time. This increase is recognised as borrowing cost.
Leases
Group entities participate in lease contracts as the lessee and where sublease arrangements are entered into, the Group entities act as an intermediate lessor. Lease contracts typically relate to facilities.
On inception of a contract, the Group assesses whether it contains a lease. A contract is a lease or contains a lease if it conveys the right to control the use of an identified asset for a period of time in exchange for consideration. The right to control the use of an identified asset is determined based on whether the Group has the right to obtain substantially all the economic benefits from the use of the asset throughout the period of use, and if the Group has the right to direct the use of the asset.
Obligations under a lease are recognised as a liability with a corresponding right-of-use asset, these are recognised at the commencement date of the lease.
The lease liability is initially measured at the present value of the lease payments that have not yet been paid at the inception of the lease, discounted using the interest rate implicit in the lease contract. Where the interest rate implicit in the lease contract cannot be readily determined, the Group's incremental borrowing rate is used.
Variable lease payments that do not depend on an index or rate are not included in the measurement of the lease liability. The lease liability is measured at amortised cost using the effective interest rate method.
The lease liability is subsequently measured at amortised cost using the effective interest method. It is remeasured when:
§ there is a change in future lease payments arising from a change in an index or rate;
§ there is a change in the Group's estimate of the amount expected to be payable under a residual value guarantee; or
§ the Group changes its assessment of whether it will exercise a purchase, extension or termination option.
When a lease liability is remeasured under one of these scenarios, a corresponding adjustment is made to the carrying value of the right-of-use asset or in profit and loss when the carrying amount of the asset has already been reduced to zero.
The corresponding right-of-use asset is initially measured at cost, which comprises the initial amount of the lease liability plus any lease payments made at or before the commencement date, any initial direct costs incurred and an estimate of the costs required to remove or restore the underlying asset, less any lease incentives received. The right-of-use asset is amortised over the shorter of the asset's useful life and the lease term on a straight-line basis.
The Group has elected not to recognise right-of-use assets and corresponding lease liabilities for short-term leases, those existing leases with a lease term of less than 12 months and leases related to low value assets with a value of £5,000 or less when new. The payments for the exempt leases are recognised as an expense on a straight-line basis over the lease term.
The Group has elected not to separate non-lease components from lease components, by class of underlying asset. Each lease component and any associated non-lease components are accounted for as a single lease component.
As an intermediate lessor the Group has accounted for its interest in the head lease and the sub-lease separately. The lease classification as a finance or operating sublease is assessed with reference to the right-of-use asset arising from the head lease, rather than the underlying asset. For subleases classified as finance leases, the Group derecognises the related portion of the right-of-use asset and recognises a net investment in the sub-lease. The net investment is measured as the present value of future lease payments receivable and is subsequently accounted for using the interest rate implicit in the lease or the incremental borrowing rate if it is not readily determinable. Finance income is recognised over the lease term.
The Group applies the derecognition and impairment requirements in IFRS 9 to the net investment in the lease.
Inventory
Inventory is stated at the lower of cost and net realisable value. Cost comprises direct materials and, where applicable, direct labour costs and those overheads that have been incurred in bringing the inventories to their current location and condition. Cost is calculated using the first-in, first-out method.
Net realisable value is calculated as the estimated selling price for an item of inventory less estimated costs of completion.
Prepaid Inventory
Prepaid inventory is recognised on inventory payments where physical delivery of that inventory has not yet been taken by the Group and is stated at the lower of cost and net realisable value.
Financial Instruments
Financial assets and liabilities are recognised by the Group and recorded in the statement of financial position when the Group is contractually bound to the terms of the financial instrument. Financial assets and liabilities are derecognised when the Group is no longer bound by the terms of the financial instrument through settlement or expiry.
Financial Assets
Financial assets are classified, at initial recognition, as subsequently measured at amortised cost, fair value through other comprehensive income (OCI), and fair value through profit or loss.
The classification of financial assets to which the Group is a party is determined by the nature of the underlying financial instrument and the characteristics of the contractual cash flows expected to be received under the terms of instrument.
Financial assets are not reclassified after their initial recognition unless there is a contractual change in the nature of the cash flows under the instrument or the business purpose of the instrument has changed.
For a financial asset to be classified and measured at amortised cost or fair value through OCI, it needs to give rise to cash flows that are 'solely payments of principal and interest (SPPI)' on the principal amount outstanding. This assessment is referred to as the SPPI test and is performed at an instrument level. Financial assets with cash flows that are not SPPI are classified and measured at fair value through profit or loss, irrespective of the business model.
Financial assets that the Group is party to are classified and measured as follows:
| Financial Asset | Measurement Basis |
| Trade receivables | Amortised cost |
| Other assets | Amortised cost |
| Cash and cash equivalents | Amortised cost |
Amortised Cost
On initial recognition, the Group measures amortised cost for financial assets based on the fair value of each financial asset together with any transaction costs that are directly attributable to the financial asset.
After initial recognition, amortised cost is measured for each financial asset held using the effective interest rate method less any impairment loss identified. Interest income is recognised for all financial assets, other than those that are classified as short-term, by applying the effective interest rate for the instrument. Interest income on short-term financial assets is not considered to be material. Short-term financial instruments are determined as those that have contractual terms of 12-months or less at inception.
Interest income, foreign exchange gains and losses, impairment, and any gain or loss on derecognition are recognised in profit or loss.
Impairment of Financial Assets
A loss allowance for financial assets is determined based on the lifetime expected credit losses for financial assets. Lifetime expected credit losses are estimated based on factors including the Group's experience of collection, the number and value of delayed payments past the average credit periods across the Group's financial assets. The Group will also consider factors such as changes in national or local economic conditions that correlate with default on receivables and financial difficulties being experienced by the counterparty.
Financial assets are impaired in full and a corresponding charge is recognised in profit or loss where there is no reasonable expectation of recovery.
Financial Liabilities
The classification of financial liabilities is determined at initial recognition. Financial liabilities are classified and measured as follows:
| Financial Liability | Measurement Basis |
| Trade and other payables | Amortised cost |
| Derivative financial instrument | Fair value through profit and loss |
| Lease liabilities | Amortised cost |
Amortised Cost
At initial recognition, the Group measures financial liabilities at amortised cost using the fair value of the underlying instrument less transaction costs directly attributable to the acquisition of the financial liability.
Derecognition of Financial Liabilities
The Group derecognises financial liabilities when the Group's obligations under the relevant instrument are discharged, expired or cancelled.
Derivative Financial Instruments
Derivatives are initially recognised at fair value on the date a derivative contract is entered into, and they are subsequently remeasured to their fair value at the end of each reporting period. Changes in the fair value of any derivative instrument are recognised immediately in profit or loss and are included in other gains/(losses).
Cash and Cash Equivalents
Cash and cash equivalents comprise cash in hand and on demand deposits, and other short-term highly liquid investments that are readily convertible to a known amount of cash and are subject to an insignificant risk of change in value.
Equity Instruments
Instruments are classified as equity instruments if the substance of the relative contract arrangements evidences a residual interest in the assets of the Group after deducting all of its liabilities. Equity instruments issued by the Company are recorded as proceeds received, net of direct issue costs not charged to income.
Offsetting
Financial assets and financial liabilities are offset and the net amount is reported in the consolidated statement of financial position if there is a currently enforceable legal right to offset the recognised amounts and there is an intention to settle on a net basis, to realise the assets and settle the liabilities simultaneously.
3 Critical Accounting Judgments and Key sources of Estimation Uncertainty
The preparation of the financial statements in conformity with generally accepted accounting practice (GAAP) requires management to make estimates and judgments. Those estimates and judgments can affect the reported values for assets and liabilities as well as the disclosure of contingent assets and liabilities at the balance sheet date.
Management is also required to make estimates and judgments related to the reported amounts of revenues and expenses and related to the timing of the recognition of those revenues and expenses.
Judgments made and estimates applied are based on historical experience and other factors including management's expectations of future events that are considered relevant. Actual results may differ from these estimates. The estimates, judgments and underlying assumptions made are reviewed on an ongoing basis and specifically in the preparation of the interim and annual published financial information.
Revisions to accounting estimates are recognised in the period in which the estimate is revised and applied consistently in future periods subject to the ongoing reassessment of estimates.
Critical Judgments for the Year Under Review
Going Concern
The Directors are required to assess whether it is appropriate to prepare the financial statements on a going concern basis. In making this assessment the Directors need to be satisfied that the Group can meet its obligations as they fall due and will remain cash-positive for a period of at least 12 months from the date of approval of the financial statements. Potential additional funding that is not yet committed at the date of approval of the financial statements cannot be anticipated in making the assessment of going concern.
The Directors make their assessment based on a cash flow model prepared by management and based on its expectation of cash flows for the 18-month period from the date of approval of the financial statements. The extended period in the model provides additional comfort that the 12-month solvency requirement can be met when making the assessment of going concern.
In preparing the cash flow model, assumptions have been made regarding the timing of cash collection from customers based on the expected cash receipt under contracts that require milestone payments to be made by customers. The timing of the receipt of milestone payments may not always align with or precede the costs incurred by the Company in performing its obligations under a contract.
Downside sensitivities have been applied to the cash flows primarily related to limited sales being made and costs being reduced where necessary. Refer to 'Basis of preparation' for details of the going concern analysis performed and the Directors' conclusions regarding going concern.
The Directors expect that the business will continue to be viable throughout the model period and, accordingly, the financial statements have been prepared on a going concern basis.
Revenue Recognition
Sales contracts are assessed in accordance with the Group accounting policy for revenue recognition. The policy requires the identification of the performance obligations, or promises, under the contract and a determination of the conditions and implications of each performance obligation. Revenue is recognised only when a distinct and appropriate performance obligation under a contract is satisfied.
Some performance obligations are satisfied separately such as the delivery of the battery systems and integration hardware. Other obligations may be satisfied in conjunction with other contract promises or where a contract calls for equipment sold under the contract to be integrated into a larger project before formal acceptance is notified by the customer.
Where the ability of a customer to benefit from a product or service is dependent on the satisfaction of other performance obligations, more than one promise may need to be bundled together as a combined performance obligation that must be satisfied before the revenue related to each element can be recognised.
Identifying where hardware or services are readily available from other providers is a key determinant as to whether a contract promise represents a separate performance obligation or if it should be bundled with other promises that, together, represent a single performance obligation.
Goodwill Impairment
Determining whether goodwill is impaired requires an estimation of recoverable amount based on the higher of its value in use and fair value less costs of disposal. The key estimates are therefore the selection of the suitable fair value basis, discount rates and the estimation of future growth rates which may depend on specific risks and the anticipated economic and market conditions related to the CGU.
Sources of Estimation Uncertainty for the Year Under Review
Warranty Provision
The Company provides time-limited standard warranties in its contracts for sale of battery systems. In addition, customers may elect to purchase separate, standalone extended warranties. Extended warranties are for periods greater than the standard warranties that are provided with the purchase of all battery systems.
Estimating the costs that may be incurred by the Company in servicing warranty agreements requires management to estimate the number of expected claims in relation to the total number of battery systems sold. In addition, an estimate of costs that the Company could expect to incur to remedy each warranty claim should also be made to determine the amount of the total provision that should be recorded for warranties.
Provisions made in respect of expected warranty obligations are reassessed and remeasured where actual experience indicates the claim rate may be higher or lower than initially expected or where costs to remedy warranty claims differ from the assumptions used in calculating the provision. The release of an over-provision of warranty costs results in other operating income being recognised in the period whereas an additional provision for warranties results in a charge being recognised.
A 20% increase in the number of warranty claims or a 20% increase in the cost to remedy warranty issues would increase the provision by £49,852 (2024: £22,895). A 40% increase in the number of warranty claims or a 40% increase in the cost to remedy warranty issues would increase the provision by £99,705 (2024: £45,791).
Refer to note 21, contract related balances.
Provision for Onerous Contracts
A contract is onerous when the unavoidable costs of meeting the Company's obligations under the contract are expected to be greater than the revenue earned under that contract.
The assessment of unavoidable costs includes direct costs such as parts and labour and indirect costs, such as production overhead or indirect labour, that are expected to be incurred in servicing a warranty claim. Consideration is made with respect to expected costs to complete the contracts looking at historical information actualised for revenue contracts.
For extended warranty contracts, management consider the pool of historical data using fail rates and actualised costs to forecast future expected warranty costs expected to fulfil a contract. Management do not consider reimbursements from third parties in making this assessment.
The assessment of future costs is inherently subjective and requires the use of estimates in determining the appropriate amount of provision that may be required.
A 20% increase in unavoidable costs would increase the provision by £864,555 (2024: £693,122). A 40% increase in unavoidable costs would increase the provision by £1,803,026 (2024: £1,386,244).
Refer to note 21, contract related balances.
4 Revenue from Contracts with Customers and Income from Government Grants
Segment Information
The Group derives revenue from a single business segment, being the manufacture and sale of vanadium flow battery systems and related hardware together with the provision of services directly related to battery systems sold to customers.
The Group is organised internally to report on its financial and operational performance to its chief operating decision maker, which has been identified as the three Executive Directors as a group.
All revenues in 2025 were derived from continuing operations.
| 2025 | 2024 | |
| Revenue from Contracts with Customers | £000 | £000 |
| Battery systems and associated control systems | 6,369 | 4,008 |
| Integration hardware | 350 | 443 |
| Installation and commissioning | 174 | 23 |
| Royalty revenue | 963 | - |
| Other services | 326 | 541 |
| Total Revenue in the Consolidated Statement of Profit and Loss | 8,182 | 5,015 |
| Analysed as: | ||
| Revenue recognised at a point in time | 8,113 | 5,000 |
| Revenue recognised over time | 69 | 15 |
| Total Revenue in the Consolidated Statement of Profit and Loss | 8,182 | 5,015 |
Geographic Analysis of Revenue
The Group's revenue from contracts with customers was derived from the following geographic regions:
| 2025 | 2024 | |
| Geographic Analysis of Revenue | £000 | £000 |
| Asia | 963 | 62 |
| Australia | 44 | 19 |
| Europe | 6,179 | 503 |
| North America | 996 | 4,431 |
| Total Revenue in the Consolidated Statement of Profit and Loss | 8,182 | 5,015 |
The Group maintains its principal production and assembly facilities in Bathgate and Motherwell, Scotland and Vancouver, Canada. These facilities include office space for design, sales and administrative teams. The Group also has offices, operations and management based in London, England and San Francisco, California.
The Group does not consider that the locations of its operations constitute geographic segments as they are managed centrally by the executive management team. The location of the manufacturing plants and business development activity is a function of time-zone when servicing customers both pre-sale and during product delivery. The geographic location of offices, facilities and management is not related to distinct markets or customer characteristics at the present time.
Significant Customers and Concentration of Revenue
Revenue from contracts with customers was derived from four (2024: two) customers who each accounted for more than 10% of total revenue as follows:
| 2025 | 2024 | |
| Significant Customers and Concentration of Revenue | £000 | £000 |
| Customer A | 4,225 | - |
| Customer B | 963 | - |
| Customer C | 917 | - |
| Customer D | 917 | - |
| Customer E | - | 2,661 |
| Customer F | - | 1,387 |
Grant Income
The Group receives grant income to help fund certain projects that are eligible for support, typically in the form of innovation grants. The total grant income that was received in the year was as follows:
| 2025 | 2024 | |
| Grant Income Recognized | £000 | £000 |
| Grants for research and development | 984 | 106 |
| Grants for product deployment | 6,724 | 67 |
| Economic and social development | - | 2 |
| Total Government Grants | 7,708 | 175 |
| Disclosed as: Grant income against capital assets |
6,724 | - |
| Grant income against other items of operating income and expense | 623 | - |
| Grant income against administrative expenses | 361 | 175 |
The Company was awarded a £10.0 million government grant from the Department for Energy Security and Net Zero ("DESNZ") to support product deployment activities in relation to the LoDES program. Of this, £7.3 million was recognised in the year, comprising amounts deducted from the cost of the related property, plant and equipment and amounts recognised within other items of operating income.
The remaining amount of the DESNZ grant expected to be recognized in 2026 is £1.8 million.
Refer to note 6, Administrative expenses and note 10, Other Items of Operating Income.
Amounts deducted from capitalised asset costs will be recognised in profit or loss through reduced depreciation charges once the assets are available for use.
Refer to note 16, Property, Plant and Equipment.
5 Cost of Sales
| 2025 | 2024 | |
| £000 | £000 | |
| Cost of inventories of finished battery systems recognised as expense | 9,505 | 6,434 |
| Movement in provisions for warranty and warranty costs | 1,214 | 524 |
| Movement in provisions for sales contracts | 328 | 1,570 |
| Total Cost of Sales | 11,047 | 8,528 |
6 Administrative Expenses
| 2025 | 2024 | |
| £000 | £000 | |
| Staff costs | 14,424 | 12,866 |
| Research and development costs | 1,783 | 2,421 |
| Research and development recoveries, tax credits and grants | (1,415) | (1,150) |
| Professional fees | 795 | 755 |
| Sales and marketing costs | 716 | 847 |
| Facilities and office costs | 417 | 345 |
| Depreciation and amortisation | 1,220 | 1,314 |
| IT and other administrative costs | 3,955 | 2,936 |
| Total Administrative Expenses | 21,895 | 20,334 |
No development costs were capitalised in the period (2024: £nil).
7 Auditors' Remuneration
| 2025 | 2024 | |
| £000 | £000 | |
| Fees payable to the Company's auditors for the audit of the consolidated financial statements | 332 | 328 |
| Audit of financial statements of subsidiaries pursuant to legislation | 5 | 18 |
| Fees payable to the Company's auditor for other services: | ||
| · Tax compliance services | 14 | 19 |
| 351 | 365 |
The Group has a policy in place related to the commissioning of non-audit service from its auditors where all such work requires pre-approval by the Audit & Risk Committee before the commencement of any non-audit work.
Audit fees are discussed with and approved by the Audit & Risk Committee.
8 Staff Costs and Headcount
| 2025 | 2024 | |
| Staff Costs | £000 | £000 |
| Wages and salaries | 12,052 | 11,010 |
| Employer payroll taxes | 1,057 | 905 |
| Contributions to defined contribution plans | 161 | 143 |
| Other benefits | 1,261 | 969 |
| Equity settled share-based payments | 801 | 622 |
| Total Staff Costs | 15,332 | 13,649 |
Administrative staff costs in the year were £14,423,792 (2024: £12,865,615) and staff costs included in cost of sales were £907,959 (2024: £783,333).
| 2025 | 2024 | |
| Average Headcount | Number | Number |
| Canada | 87 | 82 |
| United Kingdom | 66 | 54 |
| United States of America | 9 | 9 |
| Total | 162 | 145 |
Key Management Compensation
The key management of the Group comprises the members of the senior leadership team.
| 2025 | 2024 | |
| Key Management Compensation | £000 | £000 |
| Short-term employee benefits | 2,409 | 2,110 |
| Post-employment benefits | 29 | 22 |
| Termination benefits | 88 | 82 |
| Equity settled share-based payment | 481 | 386 |
| Total Key Management Compensation | 3,007 | 2,600 |
9 Share-based Payments
Since its incorporation, the Company has operated various share-based incentive plans. The purpose of each of the schemes has been to incentivise Directors and employees related to improving Company performance and building shareholder value.
Set out below is a summary of the option awards in issue at 31 December 2025.
| Standard | Grant date | Final Expiry date | Exercise price | 2025 | 2024 | |
| redT 2018 plan | 18 May 2018 | 18 May 2026 | 352.50 | p | - | 3,888 |
| Invinity Energy 2025 ESOP | 01 Apr 2020 | 12 Mar 2030 | 82.50 | p | 407,714 | 424,571 |
| Invinity Energy 2025 Consultant SOP | 01 Apr 2020 | 12 Mar 2030 | 82.50 | p | 378,000 | 378,000 |
| Invinity Energy 2025 ESOP | 01 Apr 2020 | 21 Nov 2029 | 4.34 | p | 1,052,134 | 1,052,134 |
| Invinity Energy 2025 ESOP | 01 Apr 2020 | 08 May 2029 | 6.84 | p | 628,358 | 628,358 |
| Invinity Energy 2025 ESOP | 26 Aug 2020 | 26 Aug 2030 | 113.00 | p | 1,318,000 | 1,360,000 |
| Invinity Energy 2025 ESOP | 28 Jan 2021 | 28 Jan 2031 | 204.00 | p | 258,000 | 258,000 |
| Invinity Energy 2025 ESOP | 04 Mar 2021 | 04 Mar 2031 | 152.00 | p | 150,000 | 150,000 |
| Invinity Energy 2025 ESOP | 15 Apr 2021 | 15 Apr 2031 | 151.00 | p | 39,000 | 84,000 |
| Invinity Energy 2025 ESOP | 03 Aug 2021 | 03 Aug 2031 | 134.50 | p | 275,000 | 275,000 |
| Invinity Energy 2025 ESOP | 29 Oct 2021 | 29 Oct 2031 | 111.50 | p | 236,000 | 251,000 |
| Invinity Energy 2025 ESOP | 20 Dec 2021 | 20 Dec 2031 | 91.00 | p | 135,000 | 135,000 |
| Invinity Energy 2025 ESOP | 03 Feb 2022 | 03 Feb 2032 | 64.50 | p | 72,000 | 112,000 |
| Invinity Energy 2025 ESOP | 02 Mar 2022 | 02 Mar 2032 | 93.50 | p | 45,000 | 45,000 |
| Invinity Energy 2025 ESOP | 11 Apr 2022 | 11 Apr 2032 | 90.00 | p | 60,000 | 60,000 |
| Invinity Energy 2025 ESOP | 11 Jul 2022 | 11 Jul 2032 | 45.50 | p | 500,000 | 500,000 |
| Invinity Energy 2025 ESOP | 08 Dec 2022 | 08 Dec 2032 | 38.00 | p | 311,000 | 311,000 |
| Invinity Energy 2025 ESOP | 27 Jan 2023 | 27 Jan 2033 | 42.00 | p | 2,186,466 | 2,334,400 |
| Invinity Energy 2025 ESOP | 20 Apr 2023 | 20 Apr 2033 | 43.50 | p | 43,000 | 62,000 |
| Invinity Energy 2025 ESOP | 19 Jul 2023 | 19 Jul 2033 | 51.20 | p | 2,643,000 | 3,278,000 |
| Invinity Energy 2025 ESOP | 26 Oct 2023 | 26 Oct 2033 | 38.00 | p | 214,000 | 339,000 |
| Invinity Energy 2025 ESOP | 07 Dec 2023 | 07 Dec 2033 | 29.50 | p | 30,000 | 30,000 |
| Invinity Energy 2025 ESOP | 22 Jan 2024 | 22 Jan 2034 | 24.00 | p | 102,000 | 102,000 |
| Invinity Energy 2025 ESOP | 13 Mar 2024 | 14 Mar 2034 | 30.50 | p | 3,000 | 33,000 |
| Invinity Energy 2025 ESOP | 9 Jan 2025 | 9 Jan 2035 | 17.25 | p | 723,000 | - |
| Invinity Energy 2025 ESOP | 30 Jan 2025 | 30 Jan 2035 | 23.00 | p | 18,720,001 | - |
| Invinity Energy 2025 ESOP | 8 May 2025 | 8 May 2035 | 12.13 | p | 204,000 | - |
| Invinity Energy 2025 ESOP | 3 Jun 2025 | 3 Jun 2030 | 16.00 | p | 5,350,083 | - |
| Total | 36,083,756 | 12,206,351 | ||||
| Weighted average remaining contractual life of options outstanding at the end of the year | 7.45 | 7.12 |
No employee options were exercised during the year (2024: nil).
The grant-date fair value of share options issued with non-market vesting conditions is calculated using a Black-Scholes methodology at the date of grant. Key inputs to the model include the share price at the date of grant, the option exercise price, the expected life of the option, the share price volatility (by reference to historical volatility), the risk-free interest rate (by reference to government bond yields) and the expected dividend yield rate, which has historically been and continues to be nil, reflective of the development-stage nature of the Group.
The expected life of the options reflects management's estimate of the period the awards are expected to remain outstanding and incorporates the contractual term, vesting conditions and limited historical exercise behaviour.
During the year, the Group also granted share options with market‑based vesting conditions. The fair value of these awards was determined at the grant date using a Monte Carlo simulation model, which incorporates the probability of achieving the market-based vesting conditions. The assumptions used in the model are consistent with those applied to non-market awards and include the share price at the date of grant, the option exercise price, the expected life, the share price volatility, the risk-free interest rate and the expected dividend yield rate.
The aggregate number of options granted, vested, exercised and forfeited during the year under the plans are summarised and analysed between unvested and vested awards as follows:
| Unvested | Vested | |||
| At 1 January 2025 | 5,393,250 | 47.12p | 6,813,101 | 70.24p |
| Granted | 25,234,303 | 21.20p | - | - |
| Forfeited | (461,487) | 27.73p | (895,411) | 61.15p |
| Vested | (1,746,693) | 45.57p | 1,746,693 | 45.57p |
| Exercised | - | - | - | - |
| At 31 December 2025 | 28,419,373 | 24.51p | 7,664,383 | 65.68p |
| Unvested | Vested | |||
| At 1 January 2024 | 8,599,174 | 51.64p | 5,358,734 | 74.42p |
| Granted | 150,000 | 25.43p | - | - |
| Forfeited | (871,176) | 46.34p | (1,030,381) | 71.46p |
| Vested | (2,484,748) | 61.73p | 2,484,748 | 61.73p |
| Exercised | - | - | - | - |
| At 31 December 2024 | 5,393,250 | 47.12p | 6,813,101 | 70.24p |
The grants issued in the period used the following valuation assumptions:
| 2025 | 2024 | |
| Volatility | 74.9% - 89.1% | 61.4% - 84.2% |
| Risk-free rate | 3.7%-4.4% | 3.3% - 4.2% |
| Dividend yield | 0% | 0% |
| Weighted average expected life | 2.2 years | 2.4 years |
The weighted average grant-date fair value of options granted during the year was £4.1 p per option (2024: £14.8 p).
Plans with Standard Performance Conditions
The primary share plan outstanding at 31 December 2025 is the 2025 Employee Share Option Plan. Following the redomiciliation of the parent company to the UK, all outstanding options held in the 2018 plan were exchanged for equivalent options granted under the 2025 plan, such that the underlying awards now relate to shares in the UK parent company. Other than the change in issuing entity, no other changes were made to the terms of the awards.
The 2025 plan was adopted by the Board on 8 January 2025 and introduced HMRC scheme rules related to certain non-taxable option grants. The plan contains a provision to issue options as CSOP, EMI, ISO or unapproved awards.
Parallel Options Issued
In addition, certain legacy redT options were reissued in 2020 as they were considered by the Board to be sufficiently 'out-of-the-money' such that they no longer provided a performance incentive to the holders of the options. As a mechanism to adjust the terms of the unfavourable options, new parallel options were issued on a one-for-one basis with the same terms as the original awards excepting that they were issued with a lower exercise price.
Both the original and parallel option schemes remain in existence. However, the exercise by an employee of a single option from either pool (original or parallel) allocated to them will cause the equivalent value in the other pool to be forfeited. Accordingly, the number of options disclosed above has been adjusted to remove the number of options that is equivalent to the number of parallel options issued.
Other Options
On 10 May 2021, the Company granted an option for 8,672,273 shares to Gamesa Electric S.A. Unipersonal ("GaE"), a subsidiary previously owned by Siemens Gamesa Renewable Energy S.A. and acquired by ABB Ltd (Renewable Energy) in 2025. The options were granted to GaE in consideration of its entering into a joint development and commercialisation agreement with Invinity Energy Nexus Limited, a wholly-owned subsidiary of the Company.
The exercise price of the options is 175 pence and upon exercise of those options then for as long as GaE holds at least 5% of the issued share capital of the Company it shall be entitled, subject to certain conditions, to nominate one non-executive director to the Board of the Company. On 14 October 2024, the Company extended the expiry date by one year to 10 May 2026.
Subsequent to the reporting period, on 30 April 2026, the Directors approved a further extension of the option term by up to three years. The formal amendment to give effect to this extension has not yet been executed as at the date of authorisation of these financial statements.
Warrants Issued in the Period or Outstanding
In December 2022, the Company issued 1,800,000 warrants as part of the convertible loan facility with Riverfort Global Opportunities and YA II PN Ltd ("Noteholders"). Each warrant gives the holder the right to subscribe for one new ordinary share at a price of 32 pence per ordinary share until 14 December 2026.
10 Other Items of Operating Income and Expense
The following items are included in comprehensive loss:
| 2025 | 2024 | |
| £000 | £000 | |
| Income | ||
| Project grant income | (623) | - |
| Reversal of impairment of inventory to net realisable value | (361) | (47) |
| Gain on remeasurement and curtailment of right-of-use asset | (26) | (2) |
| Partial reversal of impairment of loan receivable | (55) | - |
| Sublease income | (27) | (18) |
| Gain on legal settlement | - | (169) |
| Total Other Operating Income | (1,092) | (236) |
| Expense | ||
| Impairment of supplier deposits | 489 | - |
| Impairment of inventory to net realisable value | 222 | 376 |
| Obsolete inventory | 191 | 70 |
| Loss on disposal of property, plant and equipment | 48 | - |
| Total Other Operating Expenses | 950 | 446 |
11 Net Finance Income and Costs
| 2025 | 2024 | |
| £000 | £000 | |
| Finance Income | ||
| Interest on bank deposits and money market funds | (692) | (1,221) |
| Interest on sublease income | (16) | (2) |
| Amortisation of financial instrument | (135) | (135) |
| Total Finance income | (843) | (1,358) |
| Finance Costs | ||
| Finance charges for lease liabilities | 146 | 92 |
| Finance charges for liabilities held at amortised cost | 1 | 14 |
| Total Finance costs | 147 | (106) |
Foreign currency
| Gain on realised foreign currency transactions | (70) | (100) |
| Loss on unrealised foreign currency transactions | 242 | 92 |
| Net Loss (Gain) on Foreign Currency Transactions | 172 | (8) |
| Net Finance Income | (524) | (1,260) |
12 Income Tax Expense
| 2025 | 2024 | |
| £000 | £000 | |
| Current Tax | ||
| Current tax on profits for the year | - | - |
| Total Current Tax Expense | - | - |
Reconciliation of Income Tax Expense Calculated Using Statutory Tax Rate
| 2025 | 2024 | |
| £000 | £000 | |
| Loss before tax | (24,094) | (22,797) |
| Tax at the applicable statutory rate of 19% (2024 - nil) | (4,578) | - |
| Tax effect of amounts which are not deductible (taxable) in calculating taxable income: | ||
| Non-taxable gains and expenses not deductible for tax | (57) | 2 |
| Differences in overseas tax rates | (781) | (5,266) |
| Unrelieved tax losses carried forward | 5,178 | 4,852 |
| Origination and reversal of timing differences not recognised | 238 | 412 |
| Total Income Tax Expense | - | - |
Following the redomiciliation to a UK parent, the 2025 effective tax rate reconciliation is based on the UK statutory tax rate of 19% applied to the loss before tax, compared to the Jersey statutory tax rate of 0% in prior periods. Notwithstanding this change in parent jurisdiction, no current tax charge arises due to current year losses and the Company's full valuation recorded on deferred tax assets.
13 Loss per Share
| 2025 | 2024 | |
| Basic Loss per Share | In pence | In pence |
| From operations | (5.1) | (6.7) |
| 2025 | 2024 | |
| Diluted Loss per Share | In pence | In pence |
| From operations | (5.1) | (6.7) |
| 2025 | 2024 | |
| Loss Used in Calculation of Basic and Diluted Loss per Share | £000 | £000 |
| From operations | (24,094) | (22,797) |
| 2025 | 2024 | |
| Weighted Average Number of Shares Used in Calculation | Number | Number |
| Basic | 472,876,613 | 342,812,364 |
| Diluted | 482,722,665 | 344,057,635 |
Additional potential shares used in the calculation of diluted earnings per share primarily relate to potential shares outstanding at 31 December 2025 that may be issued in satisfaction of 'in-the-money' employee share options. Potentially dilutive shares related to 'in-the-money' outstanding warrants to subscribe for ordinary shares in the Company are also included in calculating diluted earnings per share.
Additional potential shares are anti-dilutive where their inclusion in the calculation of loss per share results in a lower loss per share. The weighted average number of shares not included in the diluted loss per share calculation because they had an anti-dilutive effect on the calculation was 4,028,921 (2024: nil).
| 2025 | 2024 | |
| Weighted Average Number of Shares Used in Loss per Share Calculation - Basic and Diluted | Number | Number |
| In issue at 1 January | 440,561,896 | 191,067,464 |
| Shares issued in the year - weighted average | 32,314,717 | 151,744,900 |
| Weighted average shares in issue 31 December | 472,876,613 | 342,812,364 |
| Effect of employee share options and other warrants not exercised | 9,846,052 | 1,245,271 |
| Weighted average number of diluted shares in issue 31 December | 482,722,665 | 344,057,635 |
14 Cash Flows from Operating Activities
| 2025 | 2024 | |
| £000 | £000 | |
| Loss After Income Tax | (24,094) | (22,797) |
| Adjustments for: | ||
| Depreciation and amortisation | 1,362 | 1,383 |
| Loss on disposal of property, plant and equipment | 48 | - |
| Net gain on right-of-use asset remeasurement and curtailment | (26) | (2) |
| Reversal of impairment of inventory | (361) | - |
| Impairment of inventory | 222 | 329 |
| Obsolete inventory | 191 | 70 |
| Impairment of trade receivables | 492 | - |
| Impairment of contract assets | 63 | - |
| Other impairment charges | 489 | - |
| Share-based payments charge | 801 | 622 |
| Net finance income | (696) | (43) |
| Loss on unrealised foreign currency transactions | 242 | 19 |
| (21,267) | (20,419) | |
| Change in Operating Assets & Liabilities | ||
| Increase in other non-cash operating working capital | (25) | - |
| Decrease/(increase) in inventory | 2,992 | (2,971) |
| (Increase)/decrease in contract assets | (159) | 28 |
| (Increase)/decrease in trade receivables and other receivables | (2,998) | 1,610 |
| Decrease/(increase) in other current assets and prepaid inventory | 899 | (6,169) |
| Increase in trade and other payables | 3,078 | 624 |
| Increase in other liabilities | 13 | - |
| Increase/(decrease) in warranty provision | 135 | (481) |
| Increase in onerous contract provision | 296 | 1,567 |
| (Decrease)/increase in contract liabilities | (646) | 64 |
| 3,585 | (5,728) | |
| Cash Used in Operations | (17,682) | (26,147) |
15 Goodwill and Other Intangible Assets
| Goodwill | Patents and Certifications | Software and Domain Names | Total | |
| £000 | £000 | £000 | £000 | |
| Cost | ||||
| At 1 January 2025 | 23,944 | 203 | 32 | 24,179 |
| Disposals | - | - | (2) | (2) |
| Foreign currency exchange differences | - | - | (1) | (1) |
| At 31 December 2025 | 23,944 | 203 | 29 | 24,176 |
| Accumulated amortisation | ||||
| At 1 January 2025 | - | (193) | (27) | (220) |
| Amortisation charge | - | (10) | (1) | (11) |
| Disposals | - | - | 2 | 2 |
| Foreign currency exchange differences | - | - | 1 | 1 |
| At 31 December 2025 | - | (203) | (25) | (228) |
| Net book value | ||||
| At 1 January 2025 | 23,944 | 10 | 5 | 23,959 |
| At 31 December 2025 | 23,944 | - | 4 | 23,948 |
| Goodwill | Patents and Certifications | Software and Domain Names | Total | |
| £000 | £000 | £000 | £000 | |
| Cost | ||||
| At 1 January 2024 | 23,944 | 203 | 34 | 24,181 |
| Disposals | - | - | - | - |
| Foreign currency exchange differences | - | - | (2) | (2) |
| At 31 December 2024 | 23,944 | 203 | 32 | 24,179 |
| Accumulated amortisation | ||||
| At 1 January 2024 | - | (153) | (26) | (179) |
| Amortisation charge | - | (40) | (2) | (42) |
| Disposals | - | - | - | - |
| Foreign currency exchange differences | - | - | 1 | 1 |
| At 31 December 2024 | - | (193) | (27) | (220) |
| Net book value | ||||
| At 1 January 2024 | 23,944 | 50 | 8 | 24,002 |
| At 31 December 2024 | 23,944 | 10 | 5 | 23,959 |
For impairment testing, goodwill acquired through business combinations and patents and certifications with indefinite useful lives are allocated to the single CGU.
Goodwill
Goodwill is tested annually for impairment. At 31 December 2025, goodwill was tested for impairment using the fair value less cost of disposal method.
On 29 September 2025, the Company announced the results of a subscription raising total proceeds of £25 million through the issuance of 128,205,128 new ordinary shares at 19.5 pence per share with a recoverable amount in excess of the Company's net asset value at that date. No impairment loss was identified in relation to goodwill.
Management assessed factors affecting the recoverable amount from the valuation date (29 September 2025) to 31 December 2026 and concluded that no significant adverse factors were identified during this period. Management notes that the closing share price on 31 December 2025 was 18.75 pence giving a market capitalisation of £106.6 million which is more than £40.2 million higher than the Net Assets value less cost of disposal of the Company on this date.
Post Balance Sheet events: Since 31 December 2025 the share price has traded across a high-low range of 33.0 pence to 16.0 pence per share.
Patents and Certifications
There have been no events or circumstances that would indicate that the carrying value of patents and certifications may be impaired at 31 December 2025.
16 Property, Plant and Equipment
| Battery Project Under Construction | Computer and Office Equipment | Leasehold Improvements | Vehicles and Equipment | Total | |
| £000 | £000 | £000 | £000 | £000 | |
| Cost | |||||
| At 1 January 2025 | - | 655 | 1,257 | 2,866 | 4,778 |
| Additions1 | 14,072 | 102 | 46 | 1,316 | 15,536 |
| Grant income applied to additions2 | (6,282) | - | - | (442) | (6,724) |
| Disposals | - | (49) | (181) | (364) | (594) |
| Transfers | - | - | 8 | (8) | - |
| Foreign currency exchange differences | (10) | (23) | (56) | (89) | |
| At 31 December 2025 | 7,790 | 698 | 1,107 | 3,312 | 12,907 |
| Accumulated Depreciation | |||||
| At 1 January 2025 | - | (504) | (623) | (1,305) | (2,432) |
| Depreciation charge | - | (81) | (217) | (407) | (705) |
| Disposals | - | 47 | 181 | 309 | 537 |
| Transfers | - | - | (1) | 1 | - |
| Foreign currency exchange differences | - | 7 | 17 | 29 | 53 |
| At 31 December 2025 | - | (531) | (643) | (1,373) | (2,547) |
| Net book value | |||||
| At 1 January 2025 | - | 151 | 634 | 1,561 | 2,346 |
| At 31 December 2025 | 7,790 | 167 | 464 | 1,939 | 10,360 |
| Computer and Office Equipment | Leasehold Improvements | Vehicles and Equipment | Total | |
| £000 | £000 | £000 | £000 | |
| Cost | ||||
| At 1 January 2024 | 554 | 823 | 2,235 | 3,612 |
| Additions | 118 | 386 | 807 | 1,311 |
| Transfers | 99 | (68) | 31 | |
| Foreign currency exchange differences | (17) | (51) | (108) | (176) |
| At 31 December 2024 | 655 | 1,257 | 2,866 | 4,778 |
| Accumulated Depreciation | ||||
| At 1 January 2024 | (465) | (424) | (1,024) | (1,913) |
| Depreciation charge | (52) | (232) | (328) | (612) |
| Foreign currency exchange differences | 13 | 33 | 47 | 93 |
| At 31 December 2024 | (504) | (623) | (1,305) | (2,432) |
| Net book value | ||||
| At 1 January 2024 | 89 | 399 | 1,211 | 1,699 |
| At 31 December 2024 | 151 | 634 | 1,561 | 2,346 |
1. In 2025, the acquisition of Uckfield resulted in the allocation of the purchase consideration totalling £0.3 million to battery project under construction. Refer to note 30, Asset acquisition
2. During the year, government grants recognized in respect of capital expenditures totalling £6.7 million were deducted from the cost of assets under construction. These assets will be depreciated from the date they are available for use, at which point the effect of the grants will be reflected through reduced depreciation charges over the useful economic lives of the assets. Refer to note 31, LoDES Project Grants
17 Right-of-use Assets
| Land | Offices and Facilities | Total | |
| £000 | £000 | £000 | |
| Cost | |||
| At 1 January 2025 | - | 2,804 | 2,804 |
| Additions | 741 | 474 | 1,215 |
| Curtailments and disposals1 | - | (459) | (459) |
| Foreign currency exchange differences | - | (69) | (69) |
| At 31 December 2025 | 741 | 2,750 | 3,491 |
| Accumulated Depreciation | |||
| At 1 January 2025 | - | (1,278) | (1,278) |
| Depreciation charge | (20) | (626) | (646) |
| Curtailments and disposals1 | - | 42 | 42 |
| Foreign currency exchange differences | - | 31 | 31 |
| At 31 December 2025 | (20) | (1,831) | (1,851) |
| Net book value | |||
| At 1 January 2025 | - | 1,526 | 1,526 |
| At 31 December 2025 | 721 | 919 | 1,640 |
1. During the year, the Group entered into a sublease arrangement in respect of a leased property in the US, resulting in the derecognition of the related right‑of‑use asset with net book value of £270,729 and recognition of a net investment in the sublease.
| Offices and Facilities | Total | |
| £000 | £000 | |
| Cost | ||
| At 1 January 2024 | 3,046 | 3,046 |
| Additions | 893 | 893 |
| Adjustments2 | (126) | (126) |
| Transfers3 | (58) | (58) |
| Curtailments and disposals | (815) | (815) |
| Foreign currency exchange differences | (136) | (136) |
| At 31 December 2024 | 2,804 | 2,804 |
| Accumulated Depreciation | ||
| At 1 January 2024 | (1,489) | (1,489) |
| Depreciation charge | (728) | (728) |
| Adjustments2 | 126 | 126 |
| Transfers3 | 27 | 27 |
| Curtailments and disposals | 710 | 710 |
| Foreign currency exchange differences | 76 | 76 |
| At 31 December 2024 | (1,278) | (1,278) |
| Net book value | ||
| At 1 January 2024 | 1,558 | 1,558 |
| At 31 December 2024 | 1,526 | 1,526 |
2. Non-material adjustment to reflect opening balance difference for both cost and accumulated depreciation with no impact to profit & loss in 2024.
3. In 2024, right-of-use assets were transferred to property, plant and equipment upon completion of lease terms.
Right-of-use assets relate to buildings and land held under leases with third-party lessors. A right-of-use asset represents the Company's right to use a leased asset over the term of the lease. The Company's rights to use specific buildings and land under lease arrangements represent assets to the Group.
The lease payments are discounted using the interest rate implicit in the lease. If that rate cannot be readily determined, which is generally the case for leases in the Group, the lessee's incremental borrowing rate is used, being the rate that the individual lessee would have to pay to borrow the funds necessary to obtain an asset of similar value to the right-of-use asset in a similar economic environment with similar terms, security and conditions.
To determine the incremental borrowing rate, the Group:
§ where possible, uses recent third-party financing received by the individual lessee as a starting point, adjusted to reflect changes in financing conditions since third party financing was received;
§ uses a build-up approach that starts with a risk-free interest rate adjusted for credit risk for leases held by the Group, which does not have recent third-party financing; and
§ makes adjustments specific to the lease, e.g. term, country, currency and security.
18 Deferred Tax Balances
Net Deferred Tax Assets Not Recognised:
| 2025 | 2024 | |
| £000 | £000 | |
| Deferred tax relates to the following: | ||
| Accelerated capital allowances | 1,185 | 1,707 |
| Share options | 102 | 46 |
| Accrued liabilities | 15 | 53 |
| Reserves and other | 315 | 277 |
| Tax losses | 32,861 | 29,224 |
| Total Net Deferred Tax Assets | 34,478 | 31,307 |
Gross Deferred Tax Assets Not Recognised:
| 2025 | 2024 | |
| £000 | £000 | |
| Deferred tax relates to the following: | ||
| Accelerated capital allowances | 4,055 | 6,493 |
| Share options | 398 | 169 |
| Accrued liabilities | 70 | 199 |
| Reserves and other | 1,540 | 1,207 |
| Tax losses | 147,435 | 130,759 |
| Total Gross Deferred Tax Assets | 153,498 | 138,827 |
Tax Losses Available for Use in Future Periods
At 31 December 2025, the Group had the following tax losses carried forward available for use in future periods:
| 2025 | 2024 | |
| £000 | £000 | |
| United Kingdom | 67,456 | 58,376 |
| Canada | 53,574 | 49,290 |
| United States | 20,149 | 18,628 |
| Ireland | 6,256 | 4,465 |
| Total Potential Tax Benefit | 147,435 | 130,759 |
Under current tax legislation tax losses in the United Kingdom and Ireland can be carried forward indefinitely and be offset against future profits arising from the same activities at the tax rate prevailing at that time. There is a portion of the tax losses in the United States that will begin to expire in 2036, whereas the majority can be carried forward indefinitely. The tax losses in Canada can be carried forward 20 years and will begin to expire in 2035.
Due to the uncertainty regarding the timing and extent of future profits within these subsidiaries, no deferred tax assets have been recognised in respect of these tax losses. Deferred tax is not recognised on the timing differences between accounting and tax treatment in these subsidiaries given the offsetting tax losses on which no deferred tax has been recognised.
The UK Government announced that the Corporation Tax rate increased from 19% to 25% on profits of over £250,000, effective 1 April 2023. Profits below £50,000 continue to be chargeable to Corporation Tax at 19%. In computing the UK deferred tax asset, management has assumed that as neither the deferred tax assets nor the deferred tax liabilities will crystallise in the immediate future, calculations based on 19% are appropriate.
19 Other Non-current Assets
During the year, the Group has entered into a sublease agreement in respect of a property in the US for which it acts as an intermediate lessor under an existing head lease. Subleasing is incidental to the Group's operations and is not part of the Group's ordinary trading activities.
The sublease has been classified as a finance sublease and accordingly the Group has recognized a net investment in the sublease.
The current portion of the net investment, representing amounts receivable within 12 months is presented within note 23, Other Current Assets.
| 2025 | 2024 | |
| £000 | £000 | |
| Net investment in sublease | 191 | - |
| Total Other Non-current Assets | 191 | - |
The Group's net investment in subleases is presented as follows:
| 2025 | 2024 | |
| At 31 December | £000 | £000 |
| Current - receivable within 12 months | 60 | 65 |
| Non-current - receivable after 12 months | 191 | - |
| Total net investment in sublease | 251 | 65 |
Cash receipts from subleases in the period were:
| 2025 | 2024 | |
| At 31 December | £000 | £000 |
| Receipt of principal | 78 | 42 |
| Receipt of interest | 16 | 2 |
| Total cash inflows from subleases | 94 | 44 |
The contractual undiscounted payments receivable under sublease agreements at each period end were:
| 2025 | 2024 | |
| At 31 December | £000 | £000 |
| Less than one year | 77 | 66 |
| One to five years | 211 | - |
| Total undiscounted sublease receivable | 288 | 66 |
20 Inventory
| 2025 | 2024 | |
| £000 | £000 | |
| Raw materials and consumables | 1,474 | 3,377 |
| Work in progress | 866 | 2,285 |
| Finished goods | 296 | 91 |
| Total Inventory | 2,636 | 5,753 |
Inventory recognised as an expense within cost of sales during the current year amounted to £9,504,343 (2024: £6,433,679).
At 31 December 2025, inventory impairment to net realisable value totalled £222,443 (2024: £376,000). Net reversal of inventory write-downs during the current year amounted to £361,906 (2024: £46,626).
21 Contract Related Balances
The Group has recognised the following assets and liabilities related to revenue from contracts with customers that are in progress at the respective year-ends:
| 2025 | 2024 | |
| £000 | £000 | |
| Amounts due from customer contracts included in trade receivables | 3,260 | 827 |
| Contract assets (accrued income for work done not yet invoiced) | 978 | 1,149 |
| Non-current contract assets | 225 | - |
| Contract liabilities (deferred revenue related to advances on customer contracts) | (649) | (1,392) |
| Net Position of Sales Contracts | 3,814 | 584 |
The amount of revenue recognised in the year that was included in contract liabilities at the end of the prior year was £1,029,577 (2024: £876,586).
The amount of expected credit losses recognised on contract assets during the year was £63,313 (2024: £nil), with contract assets presented net of expected credit losses.
The aggregate position on customer contracts included in the statement of financial position will change according to the number and size of contracts in progress at a given year-end as well as the status of payment milestones made by customers toward servicing those contracts. The Group structures payment milestones in its customer contracts to cover upfront expenditure for parts and materials and other working capital requirements associated with the delivery of promises under customer contracts to better manage Group cash flow.
The timing of revenue recognition is based on the satisfaction of individual performance obligations within a contract and is not based on the timing of advances received. Customer advances are recognised as contract liabilities in the statement of financial position and are released to income progressively as individual performance obligations are met. The difference in timing between the receipt of contract advances and the timing of the satisfaction of performance obligations for revenue recognition can cause values to remain in deferred income. The amount of such deferrals is related to both the overall size of the underlying contract and the planned pace of delivery in the related work schedule. This is expected to occur where satisfaction of performance obligations is evidenced by customer acceptance of the good or service that is the subject of the performance obligation.
Provisions Related to Contracts with Customers
| Warranty Provision | Provision for Contract Losses |
Total | |
| £000 | £000 | £000 | |
| At 1 January 2025 | 114 | 1,894 | 2,008 |
| Charges to profit or loss: | |||
| · Provided in the year | 259 | 1,692 | 1,951 |
| · Unused amounts reversed | (53) | (88) | (141) |
| Amounts used in the year | (70) | (1,274) | (1,344) |
| Foreign exchange | (1) | (34) | (35) |
| At 31 December 2025 | 249 | 2,190 | 2,439 |
| Current | 145 | 801 | 946 |
| Non-current | 104 | 1,389 | 1,493 |
| Warranty Provision | Provision for Contract Losses |
Total | |
| £000 | £000 | £000 | |
| At 1 January 2024 | 602 | 333 | 935 |
| Charges to profit or loss: | |||
| · Provided in the year | 81 | 2,198 | 2,279 |
| · Unused amounts reversed | (103) | - | (103) |
| Amounts used in the year | (460) | (631) | (1,091) |
| Foreign exchange | (6) | (6) | (12) |
| At 31 December 2024 | 114 | 1,894 | 2,008 |
| Current | 85 | 296 | 381 |
| Non-current | 29 | 1,598 | 1,627 |
Warranty Provision
The warranty provision represents management's best estimate of the costs anticipated to be incurred related to warranty claims, both current and future, from customers in respect of goods and services sold that remain within their warranty period. The estimate of future warranty costs is updated periodically based on the Company's actual experience of warranty claims from customers.
The element of the provision related to potential future claims is based on management's experience and is judgmental in nature. As for any product warranty, there is an inherent uncertainty around the likelihood and timing of a fault occurring that would cause further work to be undertaken or the replacement of equipment parts.
A standard warranty of up to two years from the date of commissioning is provided to all customers on goods and services sold and is included in the original cost of the product. Customers are also able to purchase extended warranties that extend the warranty period for up to a total of ten years.
Provision for Contract Losses
A provision is established for contract losses when it becomes known that a customer contract has become onerous. A contract is onerous when the unavoidable costs of fulfilling the Group's obligations under a contract are greater than the revenue that will be earned from it.
The unavoidable costs of fulfilling contract obligations will include both direct and indirect costs.
The creation of an additional provision is recognised immediately in profit and loss. The provision is used to offset subsequent costs incurred as the contract moves to completion.
Provisions in respect of contract losses relate to contracts which are expected to be delivered in 2026 and will therefore unwind during that year. Provisions in respect of contract losses relating to extended warranties for up to a total of ten years will unwind over that period.
22 Trade Receivables
| 2025 | 2024 | |
| £000 | £000 | |
| Total Trade Receivables | 3,260 | 827 |
All trade receivables relate to receivables arising from contracts with customers.
Trade receivables are amounts due from customers for sales of vanadium flow battery systems in the ordinary course of business. Trade receivables do not bear interest and generally have 30-day payment terms and therefore are all classified as current.
Expected credit losses on trade receivables are assessed with reference to historical loss experience, current conditions and forward-looking information. An allowance for potential credit losses of £492,130 (2024: £nil) has been recognised and balance has been presented net of this allowance.
23 Other Current Assets
| 2025 | 2024 | |
| £000 | £000 | |
| Prepayments and deposits | 2,239 | 736 |
| Receivable from supplier arrangement | 1,884 | - |
| Tax credits - recoverable | 1,770 | 856 |
| Government grant receivable | 1,448 | - |
| Prepaid inventory | 1,361 | 2,469 |
| Sublease net investment | 60 | 65 |
| Other receivables | 257 | 522 |
| Short-term investments | - | 3,000 |
| Total Other Current Assets | 9,019 | 7,648 |
Prepaid inventory is recognised on inventory payments where physical delivery of that inventory has not yet been taken by the Group.
Included within government grant receivables is £1.4 million relating to DESNZ funding, which was received subsequent to the reporting period in 2026.
24 Cash and Cash Equivalents
| 2025 | 2024 | |
| £000 | £000 | |
| Cash | 3,789 | 3,352 |
| Term deposits | 25,000 | 29,000 |
| Total Cash and Cash Equivalents | 28,789 | 32,352 |
Term deposits up to 6 months are presented as cash equivalents if they are highly liquid, readily convertible to a known amount of cash and are subject to an insignificant amount of risk of change in value.
Subsequent to the year-end, a 6-month term deposit in the amount of £15 million matured in April 2026 and was reclassified to cash.
25 Trade and Other Payables
| 2025 | 2024 | |
| £000 | £000 | |
| Trade payables | 5,568 | 2,967 |
| Accrued liabilities | 811 | 891 |
| Accrued employee compensation | 1,128 | 571 |
| Government remittances payable | 32 | 38 |
| Other payables | - | 58 |
| Total Trade and Other Payables | 7,539 | 4,525 |
Trade payables are unsecured and are usually paid within 30 days.
The carrying amounts of trade and other payables are the same as their fair values due to the short-term nature of the underlying obligation representing the liability to pay.
26 Derivative Financial Instruments
| 2025 | 2024 | |
| £000 | £000 | |
| Derivative value of warrants issued | 135 | 271 |
| Total Derivative Financial Instruments | 135 | 271 |
Investment Funding Arrangement
On 14 December 2022, the Company entered into an investment agreement with Riverfort Global Opportunities PCC Limited and YA II PN Ltd. ("Noteholders").
Pursuant to the facility, the Noteholders were granted warrants exercisable at 32.0 p to subscribe for 1,800,000 ordinary shares for a period of up to four years. These warrants remain outstanding.
Information about the Group's exposure to interest rate, foreign currency and liquidity risks is included in note 33.
27 Lease Liabilities
The Group's obligations under lease contracts are presented as follows:
| 2025 | 2024 | |
| At 31 December | £000 | £000 |
| Current - due within 12 months | 643 | 550 |
| Non-current - due after 12 months | 1,352 | 1,145 |
| Total Lease Liabilities | 1,995 | 1,695 |
Payments of lease principal and interest in the period to 31 December were:
| 2025 | 2024 | |
| At 31 December | £000 | £000 |
| Payments of lease principal | 723 | 676 |
| Payments of interest | 147 | 92 |
| Total Payments under Leases | 870 | 768 |
The contractual undiscounted cash flows for lease obligations at each period end were:
| 2025 | 2024 | |
| At 31 December | £000 | £000 |
| Less than one year | 761 | 638 |
| One to five years | 912 | 1,266 |
| More than five years | 1,371 | - |
| Total Lease Liabilities | 3,044 | 1,904 |
Lease liabilities represent the present value of the minimum lease payments the Group is obliged to make to lessors under contracts for the lease of assets that are presented as right-of-use assets.
Amounts recognised in the consolidated statement of profit and loss were:
| 2025 | 2024 | |
| £000 | £000 | |
| Variable lease payments | 316 | 298 |
| Expenses relating to short-term leases | 180 | 73 |
| Expenses relating to leases of low-value assets | 15 | 15 |
28 Other Non-current Liabilities
| 2025 | 2024 | |
| £000 | £000 | |
| Deferred grant income | 1,799 | - |
| Other liabilities | 13 | - |
| Total Other Non-current Liabilities | 1,812 | - |
Approximately £1.8 million of approved funding receipts had been received in respect of project inventory and manufacturing activity associated with materials in production at the reporting date. These amounts were recognized as deferred income liabilities pending completion of the related manufacturing and delivery milestones subsequent to year-end.
29 Issued Share Capital and Reserves
| 2025 | 2024 | |||
| No: 000 | £000 | No: 000 | £000 | |
| Authorised at 31 December | 1,000,000 | - | 1,000,000 | - |
| Issued and fully paid | ||||
| At 1 January | 440,561 | 53,473 | 191,067 | 51,348 |
| Group reorganisation adjustment | (440,561) | (53,473) | - | - |
| Shares issued on redomiciliation | 440,561 | 61,679 | - | - |
| Reduction of share capital | - | (57,273) | - | - |
| Issued in the year | 128,205 | 1,282 | 249,494 | 2,125 |
| At 31 December | 568,766 | 5,688 | 440,561 | 53,473 |
On 9 January 2025, the Group completed a redomiciliation of its parent company to the UK, as a result of which a new UK parent company became the holding company of the Group. The redomiciliation was effected through a one-for-one exchange of shares in the former parent company for shares in the UK parent company and represented a reorganisation of the Group's legal and corporate structure, resulting in the transfer of the share capital and share premium of the former parent company to a merger reserve.
The Company also completed a court-approved reduction of capital pursuant to the Companies Act 2006, resulting in the creation of distributable reserves.
On 30 September 2025, the Company issued 128,205,128 new ordinary shares with a nominal value of £1,282,051. The total gross proceeds were £25,000,000 with the balance of £23,717,948 credited to the share premium account. Total costs of issuance were £846,403 and these costs were charged directly to the share premium account.
Share Capital and Share Premium
Share capital comprises issued capital in respect of issued and paid-up shares, at their par value. Share premium comprises the difference between the proceeds received and the par value of the issued and paid-up shares.
Share-based Payment Reserve
The share-based payment reserve comprises the equity component of the Company's share-based payments charges.
Currency Translation Reserve
The translation reserve comprises foreign currency differences arising from the translation of the financial statements of foreign operations.
Other Reserve
Other reserve comprises the portion of the consideration paid for redT energy Holdings (Ireland) Limited's minority interests over the fair value of the shares purchased.
30 Asset Acquisition
On 28 March 2026, the Group completed the acquisition of Uckfield Energy Centre Ltd. and Uckfield Solar Electric Forecourt Ltd. In determining whether Uckfield's set of activities was a business, the Group assessed whether it had inputs and substantive processes which together contribute to the ability to create outputs. Based on this assessment, the Group concluded that Uckfield did not meet the definition of a business as defined by IFRS 3 Business Combinations and therefore the purchase was treated as an asset acquisition and no goodwill was recorded.
The total consideration transferred was £300,000. This amount was allocated to the identifiable assets acquired and liabilities assumed based on their relative fair values at the acquisition date. The total consideration was allocated to property, plant, and equipment, and is disclosed as "Battery Project Under Construction". Refer to note 16, property, plant and equipment. Transaction costs of £40,102 were expensed in the period.
31 LoDES Project Grants
The Company was awarded a £10.0 million government grant from the DESNZ to support product deployment activities in relation to the LoDES funding program.
The project grants from DESNZ were recognized as follows:
| 2025 | 2024 | ||
| Note | £000 | £000 | |
| Grant income against capital assets | 16 | 5,700 | - |
| Grant income accrued against capital assets | 16 | 1,024 | - |
| Grant income against other items of operating income | 10 | 623 | - |
| Grant income deferred | 28 | 1,799 | - |
| Total Project Grants | 9,146 | - |
Total approved grant funding relating to 2025 project execution amounted to £9.1 million, comprised of funding recognised within the current year, deferred funding associated with manufacturing and delivery milestones completed subsequent to year end and approved receivables contractually committed by DESNZ at the reporting date.
In addition to the £9.1 million recognised or deferred in the year, £0.3 million was recognised in 2023, with a further £0.6 million recognised in 2026 following the reporting date.
The related funding has been recognized in line with qualifying project expenditures and the achievement of applicable project milestones under the relevant grant arrangement.
32 Financial Assets and Liabilities
All financial assets are held at amortised cost. There were no financial assets measured at fair value through other comprehensive income nor through profit and loss in either period presented.
The maximum exposure to credit risk at the end of the reporting period is the carrying amount of each class of financial asset presented above. The carrying value of the financial assets approximate their fair values due to the short-term maturities of these instruments.
The Group does not currently use derivative instruments for managing financial risk. All financial liabilities are held at amortised cost.
Recognised Fair Value Measurements
The Group uses the following hierarchy for determining and disclosing the fair value of financial instruments by valuation technique:
Level 1: The fair value of financial instruments traded in active markets (such as publicly traded derivatives, and trading securities) is based on quoted market prices at the end of the reporting period.
The battery systems manufactured by the Company use vanadium metal as a key component in the electrolyte. Vanadium is an actively traded commodity for which quoted market prices are available.
The Company does not currently hold inventories of vanadium. Vanadium purchased from third parties is solely for the use in electrolyte and open purchase contracts are not accounted for as derivatives.
Level 2: The fair value of financial instruments that are not traded in an active market (for example, over-the-counter derivatives) is determined using valuation techniques that maximise the use of observable market data and rely as little as possible on entity-specific estimates. If all significant inputs required to fair value instrument are observable, the instrument is included in Level 2.
At 31 December 2025, the Company held warrants issued to Riverfort Global Opportunities and YA II PN Ltd as part of the December 2022 financing event. The warrants are valued using Level 2 inputs as they do not represent a fixed-for-fixed equity instrument and are valued using observable market factors such as the share price at the date of the grant, the term of the award, the share price volatility and the risk-free interest rate.
Level 3: If one or more of the significant inputs is not based on observable market data the instrument is included in Level 3.
The Group did not hold any financial assets or liabilities that were required to be valued using Level 3 inputs at 31 December 2025 (2024: none).
No other financial instruments were outstanding at the period end that required to be valued using a methodology that uses Level 1, 2 or 3 inputs.
33 Financial Risk Management
This note explains the Group's exposure to financial risks and how these risks could affect the Group's future financial performance. Current year profit and loss information has been included where relevant to add further context.
| Risk | Exposure arising from | Measurement | Management |
| Market risk - foreign exchange | Future commercial transactions Recognised financial assets and liabilities not denominated in GBP |
Cash flow forecasting Sensitivity analysis |
Cash is held in GBP until non-GBP requirements for up to the next six-months are established, at which point the GBP is sold in favour of the required currency, which is then remitted to the relevant Group entity |
| Market risk - commodity price risk | Price of vanadium to be used in the battery electrolyte | Quoted market prices for vanadium | Strategic supply arrangements with multiple pre-qualified suppliers |
| Credit risk | Cash and cash equivalents, short-term investments, trade receivables and contract assets | Ageing analysis Credit ratings |
Monitoring accumulation of bank balances. Credit risk assessment for customers and pre-agreed deposits and interim payments within customer contracts |
| Liquidity risk | Borrowings and other liabilities | Rolling cash flow forecasts | Access to capital markets for equity or debt funding |
Market risk - Foreign Exchange Risk
The Group operates internationally and is therefore exposed to foreign currency transaction risk arising from sales and purchases denominated in currencies other than the entities' functional currencies. The Group's presentational currency is the pound Sterling, therefore the Group is also exposed to foreign currency translation risks due to movements in foreign exchange rates on the translation of non-sterling assets and liabilities.
The Group does not speculate on foreign exchange and aims to mitigate its overall foreign exchange risk by holding currency in line with forecast regional operating expenses, providing an element of natural hedge against adverse foreign exchange movement.
The Group's exposure to foreign exchange risk on monetary items at the end of the reporting period, expressed in GBP, was as follows:
| Sterling | Euro | Canadian Dollar | US Dollar |
Australian Dollar | Total | |
| 31 December 2025 | £000 | £000 | £000 | £000 | £000 | £000 |
| Cash and cash equivalents | 26,298 | 1,006 | 779 | 703 | 3 | 28,789 |
| Trade receivables | 3,157 | - | - | 103 | - | 3,260 |
| Contract assets | 1,028 | - | 27 | 148 | - | 1,203 |
| Other assets | 3,677 | 21 | 1,778 | 280 | - | 5,756 |
| Derivative financial instruments | (135) | - | - | - | - | (135) |
| Trade and other payables | (4,298) | (81) | (2,704) | (456) | - | (7,539) |
| Lease liabilities | (1,236) | - | (467) | (292) | - | (1,995) |
| Net Exposure | 28,491 | 946 | (587) | 486 | 3 | 29,339 |
| Sterling | Euro | Canadian Dollar | US Dollar |
Australian Dollar | Total | |
| 31 December 2024 | £000 | £000 | £000 | £000 | £000 | £000 |
| Cash and cash equivalents | 30,710 | 54 | 934 | 650 | 4 | 32,352 |
| Trade receivables | 14 | - | 27 | 786 | - | 827 |
| Contract assets | 472 | 283 | 235 | 159 | - | 1,149 |
| Derivative financial instruments | (271) | - | - | - | - | (271) |
| Trade and other payables | (2,022) | (77) | (1,890) | (536) | - | (4,525) |
| Lease liabilities | (682) | - | (603) | (410) | - | (1,695) |
| Net Exposure | 28,221 | 260 | (1,297) | 649 | 4 | 27,837 |
Sensitivity - Exchange Rates
The sensitivity of profit or loss to changes in quoted exchange rates for currencies to which the Group is exposed is as follows, based on each relevant exchange rate strengthening (or weakening) by 5%.
There is no impact on other components of equity as the Group is not party to any derivative financial instruments, such as hedging instruments, where currency gains and losses would be recognised in other comprehensive loss.
| 2025 | 2024 | |
| At 31 December +/- 5% | £000 | £000 |
| Euro | 47 | 13 |
| Canadian dollar | (29) | (65) |
| US dollar | 24 | 32 |
| 42 | (20) |
Market Risk - Commodity Price Risk
The Group's batteries use an electrolyte incorporating vanadium. Vanadium is an elemental metal and is used primarily to strengthen steel, particularly for the construction industry.
Whilst it is not a mature market traded commodity, such that one can buy forward or derivative contracts, market prices for vanadium pentoxide (V2O5) at 98% purity are quoted in US dollars per pound.
Vanadium forms about two-thirds of the value of the electrolyte, which in turn forms between a quarter to a third of the landed cost of a battery, and so a fluctuation in the price of vanadium will impact the profitability of battery sales. An increase or decrease in the market price of vanadium of 5% could cause the value of the electrolyte component of a battery to increase or decrease by approximately 3%.
Credit Risk - Cash Held on Deposit with Banks
Credit risk arises from cash and cash equivalents and deposits with banks and other financial institutions.
Credit risk related to holdings with financial institutions is managed by only maintaining bank accounts with reputable financial institutions. The Group aims only to place funds on deposit with institutions with a minimum credit rating of B2 Moody's.
At the reporting date, the Group's cash and cash equivalents and deposits were held at financial institutions that met the Groups credit-rating requirements.
The Group considers a financial institution to be in default where there is evidence of insolvency, regulatory intervention, or a significant deterioration in credit quality below the Group's minimum rating thresholds.
The Group does not consider there to be any significant concentration of credit risks in respect of its cash and deposit balances and does not expect any material losses arising from non-performance by its banking counterparties. Accordingly, no impairment has been recognized in respect of these balances.
Credit Risk - Trade Receivables and Contract Assets
The Group's credit risk from receivables encompasses the default risk of its customers and other counterparties. Its exposure to credit risk is influenced mainly by the individual characteristics of each customer or counterparty. The creditworthiness of potential and existing customers is assessed prior to entering each new transaction. A credit analysis is performed, and appropriate payment terms implemented that may include increased level of upfront deposits for the purchase of battery units. The Group's standard terms of trade provide that up to 90% of the sales price of a battery unit is paid prior to or at delivery.
The Group assesses impairment of trade receivables and contract assets in accordance with the expected credit loss model and applies the simplified approach to recognize lifetime expected credit losses. Credit risk is managed through ongoing monitoring of customer balances and ageing profiles or where there is objective evidence that the customer or counter party may be a default risk. Expected credit losses are recognised using a forward-looking assessment that reflects historical experience, current conditions and relevant economic factors.
On an ongoing basis, receivable balances attributable to each customer or other counterparty are monitored and appropriate action is taken when the relevant balance becomes or is considered likely to become overdue. The maximum exposure to loss arising from receivables is equal to invoiced value.
The ageing of trade receivable balances was:
| 2025 | 2024 | |
| At 31 December | £000 | £000 |
| Current | 3,130 | 670 |
| Past due - less than 30 days | 60 | 20 |
| Past due - more than 30 days | 70 | 137 |
| Total Trade Receivables | 3,260 | 827 |
Past due amounts at 31 December 2025, related to 6 customers (2024: four customers) and £492,130 (2024: £nil) was considered to be impaired.
The expected credit loss recognised on contract assets was £63,313 (2024: £nil). Contract assets are presented net of the impairment.
Liquidity Risk
Liquidity risk relates to the Group's ability to meet its obligations as they fall due.
The Group generates cash from its operations that are principally related to the manufacture and installation of vanadium flow batteries. The market for reliable and flexible grid-scale storage solutions for energy generated from renewable sources is growing and the technology continues to develop.
The development of new and enhanced storage technologies can be capital intensive and the Group has historically funded development and early-stage commercial activity primarily from equity investment but also using cash from operations and loan funding.
The Group forecasts cash generation using a comprehensive company financial model and monitors the timing and amount of its payment obligations.
The following table shows the Group's financial liabilities by relevant maturity grouping based on contractual maturities. The amounts included in the analysis are contractual, undiscounted cashflows.
| Less than One Year | One to Two Years |
Two to Five Years |
Over Five Years | Total Contracted Cash Flows | Carrying Amount | |
| 31 December 2025 | £000 | £000 | £000 | £000 | £000 | £000 |
| Trade and other payables | 7,539 | - | - | - | 7,539 | 7,539 |
| Derivative financial instrument | 135 | - | - | - | 135 | 135 |
| Lease liabilities | 761 | 385 | 527 | 1,371 | 3,044 | 1,995 |
| Total Financial Liabilities | 8,435 | 385 | 527 | 1,371 | 10,718 | 9,669 |
| Less than One Year | One to Two Years |
Two to Five Years |
Over Five Years | Total Contracted Cash Flows | Carrying Amount | |
| 31 December 2024 | £000 | £000 | £000 | £000 | £000 | £000 |
| Trade and other payables | 4,525 | - | - | - | 4,525 | 4,525 |
| Derivative financial instrument | 271 | - | - | - | 271 | 271 |
| Lease liabilities | 638 | 465 | 801 | - | 1,904 | 1,695 |
| Total Financial Liabilities | 5,434 | 465 | 801 | - | 6,700 | 6,491 |
Capital Management
The Group currently has no external debt outstanding and is funded by proceeds raised through equity placings.
The Board regularly reviews the Group's cash requirements and future projections to monitor cash usage and assess the need for additional funding. At 26 May 2026, the Group had £15.0 million of cash on hand.
34 Related Parties
The only related parties of the Group are the key management and close members of their family. Key management has been determined as the CEO and his direct reports.
During the period, no related party transactions were entered other than through key management personnel compensation and benefits.
Key management compensation is disclosed in note 8, Staff costs and headcount.
35 Group Entities
| Ownership % | |||||
| Direct Subsidiary Undertakings | Country of Incorporation | Registered Office | Principal Activity | 2025 | 2024 |
| Invinity Energy Systems Limited | Jersey | IFC5 Castle Street, St Helier, JE2 3BY Jersey | Holding company | 100% | 100% |
| Indirect Subsidiary Undertakings | |||||
| Camco Holdings UK Limited | England | 128 City Road, London, EC1V 2NX, United Kingdom | Holding company | 100% | 100% |
| Invinity Asia Limited (formerly Invinity Energy Group Services Limited) | England | 128 City Road, London, EC1V 2NX, United Kingdom | Support services | 100% | 100% |
| Camco (Mauritius) Limited | Mauritius | 24 Dr Joseph Rivière Street 1st Floor, Felix House Port Lewis, Mauritius |
Holding company | 100% | 100% |
| Invinity Energy Nexus Limited | England | 128 City Road, London, EC1V 2NX, United Kingdom | Energy storage | 100% | 100% |
| Invinity Energy Systems (U.S.) Corporation | United States of America | 1201 Orange St. #600 Wilmington, DE USA 19899 |
Energy storage | 100% | 100% |
| Invinity Energy Systems (Canada) Corporation | Canada | 2900-550 Burrard Street Vancouver, BC Canada V6C 0A3 |
Energy storage | 100% | 100% |
| redT Energy Holdings (UK) Limited | England | 128 City Road, London, EC1V 2NX, United Kingdom | Holding Company | 100% | 100% |
| Re-Fuel Technology Limited | England | 128 City Road, London, EC1V 2NX, United Kingdom | Energy storage | 99% | 99% |
| Invinity Energy (UK) Limited | England | Office 3.03, 24 Chiswell Street, London, England, EC1Y 4TY | Energy storage | 99% | 99% |
| redT Energy Holdings (Ireland) Limited | Ireland | 22 Northumberland Road Ballsbridge, Dublin 4 |
Energy storage | 99% | 99% |
| Invinity Energy Systems (Ireland) Limited | Ireland | 22 Northumberland Road Ballsbridge, Dublin 4 |
Energy storage | 99% | 99% |
| redT energy (Australia) (Pty) Ltd | Australia | RSK Advisory, Level 2, Suite 7 66 Victoria Crescent Narre Warren, Victoria 3805 Australia |
Energy storage | 99% | 99% |
| Invinity Energy BESS Holdings Ltd | England | 128 City Road, London, EC1V 2NX, United Kingdom | Energy storage | 99% | - |
| Uckfield BESS Ltd | England | 128 City Road, London, EC1V 2NX, United Kingdom | Energy storage | 99% | - |
| Uckfield Energy Centre Limited | England | 128 City Road, London, EC1V 2NX, United Kingdom | Energy storage | 99% | - |
| Uckfield Solar Electric Forecourt Ltd | England | 128 City Road, London, EC1V 2NX, United Kingdom | Energy storage | 99% | - |
| Associates | |||||
| Vanadium Electrolyte Rental Limited | England | 128 City Road, London, EC1V 2NX, United Kingdom | Vanadium procurement | 50% | 50% |
| Invinity (HK) Limited | Hong Kong | 7/F Strand 71, 69-71 Bonham Strand West Sheung Wan, Hong Kong |
Energy storage and product development | 20% | - |
36 Contingent Liabilities and Capital Commitments
The Group is involved in legal proceeding with a landlord with a received claim which has a possible range from £nil to £763k. While the outcome and timing of this matter is uncertain and difficult to predict, management believes that, based on the information currently available, the ultimate resolution of these matters will not have a material adverse effect on the Group's financial position.
Authorised and contracted future capital expenditure by the Group for which contracts had been placed but not provided in the financial statements at 31 December 2025 is estimated at £1.2m in relation to the LoDES funding program.
37 Events Occurring After the Report Period
In March 2026, DESNZ approved the final milestone payment for the LoDES funding program following acceptance of the project's final report. All Invinity VS3 battery units have been delivered to the project site and the Company has now fulfilled its battery equipment supply obligations under the DESNZ grant funding arrangement. The outstanding funding balance under the program of £1,950,000 was received in 2026.
On 26 May 2026, the Group entered into a capital commitment for the purchase of a conveyor system in the US with a total value of £576k.
Company Financial Statements
Invinity Energy Systems plc
Company Statement of Financial Position
As at 31 December 2025
| Period to 31 December 2025 | ||
| Note | £000 | |
| Non-Current Assets | ||
| Investment in subsidiaries | 2 | 66,527 |
| Total Non-Current Assets | 66,527 | |
| Current Assets | ||
| Other current assets | 13 | |
| Trade and other receivables | 3 | 11,364 |
| Cash and cash equivalents | 4 | 25,903 |
| Total Current Assets | 37,280 | |
| Total Assets | 103,807 | |
| Current Liabilities | ||
| Trade and other payables | 5 | (13,821) |
| Other current liabilities | (13) | |
| Total Current Liabilities | (13,834) | |
| Net Current Assets | 23,446 | |
| Net Assets | 89,973 | |
| Equity | ||
| Called up share capital | 6 | 5,688 |
| Share premium | 6 | 22,872 |
| Distributable reserve | 6 | 57,273 |
| Share-based payment reserve | 6 | 4,848 |
| Accumulated losses | (644) | |
| Currency translation reserve | 6 | (64) |
| Total Equity | 89,973 |
As permitted by section 408 of the Companies Act 2006, a separate income statement for the Company has not been included in these Financial Statements. The loss for the financial period is disclosed within the statement of changes in equity.
The above company statement of financial position should be read in conjunction with the accompanying notes.
The results of the year show a loss after taxation of £644k.
The Company financial statements were authorised by the Board of Directors and authorised for issue on 29 May 2026 and were signed on its behalf by:
Adam Howard
Director
Invinity Energy Systems plc Registered Company number: 15892542
Invinity Energy Systems plc
Company Statement of Changes in Equity
For the 17 months ended 31 December 2025
| Called up Share Capital | Share Premium | Distributable Reserve | Share-based Payment Reserve | Accumul-ated Losses | Currency Transla-tion Reserve | Total | |
| £000 | £000 | £000 | £000 | £000 | £000 | £000 | |
| At incorporation (12 August 2024) | - | - | - | - | - | - | - |
| Loss for the year | - | - | - | - | (644) | - | (644) |
| Other Comprehensive Income | |||||||
| Foreign currency translation differences | - | - | - | - | - | (64) | (64) |
| Total Comprehensive Loss for the Year | - | - | - | - | (644) | (64) | (708) |
| Transactions with Owners in their Capacity as Owners | |||||||
| Shares issued on redomiciliation | 61,679 | - | - | - | - | 61,679 | |
| Reduction of capital | (57,273) | - | 57,273 | - | |||
| Investment funding arrangement, net of transaction costs | 1,282 | 22,872 | - | - | - | - | 24,154 |
| Transfer of share-based payment reserve on redomiciliation | - | - | - | 4,047 | - | - | 4,047 |
| Share-based payments | - | - | 801 | - | - | 801 | |
| Total Contributions by Owners | 5,688 | 22,872 | 57,273 | 4,848 | - | - | 90,681 |
| At 31 December 2025 | 5,688 | 22,872 | 57,273 | 4,848 | (644) | (64) | 89,973 |
The above company statement of changes in equity should be read in conjunction with the accompanying notes.
1 Accounting policies
Statement of compliance
Invinity Energy Systems plc meets the definition of a qualifying entity under Financial Reporting Standard 100 (FRS 100) issued by the Financial Reporting Council. The Company's financial statements have been prepared in accordance with FRS 102, the Financial Reporting Standard applicable in the United Kingdom and the Republic of Ireland
Basis of preparation
In preparing the Company's financial statements, advantage has been taken of the following disclosure exemptions available in FRS 102:
- only one reconciliation of the number of shares outstanding at the beginning and end of the period has been presented as the reconciliations for the group and the parent company would be identical. Refer to note 29 to the Group financial statements.
- no cash flow statement has been presented for the parent company
- disclosures in respect of the parent company's income, expense, net gains and net losses on financial instruments measured at amortised cost have not been presented as equivalent disclosures have been provided in respect of the group as a whole
- no disclosure has been given for the aggregate remuneration of the key management personnel of the parent company as their remuneration is included in the totals for the group as a whole. Refer to note 8 to the Group financials statements.
Where required equivalent disclosures are given in the consolidated financial statements.
The financial statements cover the 17-month period from 12 August 2024 (date of incorporation) to 31 December 2025. Accordingly, the amounts presented are not directly comparable to those that would be presented for a standard 12-month period. As this is the Company's first reporting period, no comparative information has been presented.
Subsidiary companies exempt from audit
For the year ended 31 December 2025, the following subsidiary undertakings have taken advantage of the exemption from audit under section 479C of the Companies Act 2006:
| Camco Holdings UK Limited | (03952061) |
| Invinity Energy Nexus Limited | (13366462) |
| redT Energy Holdings (UK) Limited | (05649251) |
| Re‑Fuel Technology Limited | (03955925) |
| Invinity Energy (UK) Limited | (07640710) |
| Invinity Energy BESS Holdings Ltd | (16357834) |
| Uckfield BESS Ltd | (16357809) |
| Uckfield Energy Centre Limited | (16331420) |
| Uckfield Solar Electric Forecourt Ltd | (10268743) |
The Company has, at the date of approval of these financial statements, provided guarantees under section 479C of the Companies Act 2006 in respect of the above UK-incorporated subsidiary undertakings.
The guarantees cover all outstanding liabilities to which each subsidiary was subject at the end of the financial year and which remain outstanding at the date of approval of the Company's consolidated financial statements.
The parental guarantee statements will be filed with the Registrar of Companies in accordance with the requirements of the Companies Act 2006.
Significant accounting judgements, estimates and assumptions
In preparing the Company's financial statements, the Directors have applied judgement in assessing the carrying value of investments in subsidiary undertakings.
The key judgement relates to the assessment of whether there are any indicators of impairment in respect of these investments. In making this assessment, the Directors consider a range of factors, including the financial position, performance and prospects of the relevant subsidiary.
Where indicators of impairment are identified, the carrying amount of the investment is compared with its recoverable amount and an impairment charge is recognised where the carrying value exceeds the recoverable amount. In determining the recoverable amount, the Directors consider the net asset value of the underlying subsidiary entities to be an appropriate proxy for fair value less costs to sell.
Going concern
The Company's financial statements have been prepared on a going concern basis. The Directors have assessed the Company's ability to continue as a going concern and consider that it remains appropriate to adopt this basis of preparation. Further details are included in the Group financial statements.
Investments in subsidiary undertakings
Investments included in assets are investments in subsidiary companies and these are stated at cost less accumulated impairments losses. The carrying value is reviewed for impairment where indicators exist.
Financial instruments
Financial assets and financial liabilities are recognised when the Company becomes party to the contractual provisions of the instrument and are initially measured at transaction price.
Financial assets, including trade and other receivables, are subsequently measured at amortised cost using the effective interest method, less any impairment.
Financial liabilities, including trade and other payables, are subsequently measured at amortised cost using the effective interest method.
Cash and cash equivalents
Cash and cash equivalents comprise cash in hand and on demand deposits, and other short-term highly liquid investments that are readily convertible to a known amount of cash and are subject to an insignificant risk of change in value.
Equity
Ordinary shares are classified as equity. Equity instruments are measured at the fair value of the cash or other resources received or receivable, net of the direct costs of issuing the equity instruments. The cost of issuing ordinary shares is charged to the share premium account.
Share-based payments
In the Company financial statements, the cost of equity-settled share-based payments relating to employees of subsidiary undertakings is recognised as an increase in the investment in subsidiaries.
2 Investment in subsidiary undertakings
The movement in the year was as follows:
| 2025 | |
| £000 | |
| Opening balance | - |
| Additions | |
| - Shares issued on redomiciliation | 61,679 |
| - Share-based payment capital contributions | 801 |
| - Share-based payment reserve transfer | 4,047 |
| Closing balance as at 31 December 2025 | 66,527 |
The additions in the year represent the investment in Invinity Energy Systems Jersey after the redomiciliation of the parent company to the UK. Refer to note 29, Issued Share Capital and Reserves.
On 9 January 2025, the Company became the ultimate parent undertaking of the Group following a redomiciliation to the UK. This was effected through a one-for-one exchange of shares with the former parent company and has been recorded at the carrying value of the net assets acquired.
Note 35 in the Group financial statements provides a comprehensive list of all subsidiaries of the Company.
3 Trade and Other Receivables
| 2025 | |
| £000 | |
| Intercompany receivables | 11,052 |
| Prepayments and deposits | 83 |
| Tax credits - recoverable | 42 |
| Other receivables | 187 |
| Total Trade and Other Receivables | 11,364 |
4 Cash and Cash Equivalents
| 2025 | |
| £000 | |
| Cash | 903 |
| Term deposits | 25,000 |
| Total Cash and Cash Equivalents | 25,903 |
Term deposits up to 6 months are presented as cash equivalents if they are highly liquid, readily convertible to a known amount of cash and are subject to an insignificant amount of risk of change in value.
Subsequent to the year-end, a 6-month term deposit in the amount of £15 million matured in April 2026 and was reclassified to cash.
5 Trade and Other Payables
| 2025 | |
| £000 | |
| Intercompany payable | 13,256 |
| Trade payables | 251 |
| Accrued liabilities | 314 |
| Total Trade and Other Payables | 13,821 |
Trade payables are unsecured and are usually paid within 30 days.
6 Issued Share Capital and Reserves
| 2025 | ||
| No: 000 | £000 | |
| Authorised at 31 December | 1,000,000 | - |
| At incorporation (12 August 2024) | - | - |
| Shares issued on redomiciliation | 440,561 | 61,679 |
| Reduction of share capital | - | (57,273) |
| Issued in the year | 128,205 | 1,282 |
| At 31 December | 568,766 | 5,688 |
Share Capital and Share Premium
The share capital represents the issued capital in respect of issued and paid-up shares, at their par value. The Company has one class of ordinary shares with a nominal value of £0.01 per share. The share premium represents the surplus of the gross proceeds of share issues over the nominal value of the shares, net of the direct costs of equity issues.
Distributable reserves
During the year, the Company completed a court approved reduction of capital which resulted in the creation of distributable reserves. No dividends were declared or paid by the Company during the year ended 31 December 2025.
Share-based payments
The share-based payment reserve represents the recognition of the value of services from employees in exchange for its own equity instruments.
Note 9 of the Group financial statements provides details of share-based payments of the Group. The amounts disclosed are the same as those of the Company. The only difference to that policy is that the costs relating to share-based payments are capitalized in the parent as part of the investment in the Group's subsidiaries, as they relate to employees of those subsidiaries.
Accumulated Losses
The accumulated losses represent cumulative net gains and losses recognised in the statement of comprehensive income.
Currency Translation Reserve
The currency translation reserve represents foreign currency differences arising from the revaluation of intercompany loans with foreign operations.
7 Auditors' Remuneration
Note 7 of the Group financial statements provides details of the remuneration of the Company's auditors on a Group basis.
8 Related Parties
The Company's immediate and ultimate parent undertaking is Invinity Energy Systems Limited, incorporated in Jersey.
The Company has taken advantage of the exemption under Chapter 33 - Related party disclosures of FRS 102 not to disclose transactions with wholly owned subsidiaries.
The remuneration of the key management personnel and close members of their family is disclosed in the Group financial statements.
9 Events Occurring After the Report Period
Note 37 of the Group financial statements provides details of events occurring after the reporting period for the Group and Company.
This information is provided by RNS, the news service of the London Stock Exchange. RNS is approved by the Financial Conduct Authority to act as a Primary Information Provider in the United Kingdom. Terms and conditions relating to the use and distribution of this information may apply. For further information, please contact [email protected] or visit www.rns.com.
RNS may use your IP address to confirm compliance with the terms and conditions, to analyse how you engage with the information contained in this communication, and to share such analysis on an anonymised basis with others as part of our commercial services. For further information about how RNS and the London Stock Exchange use the personal data you provide us, please see our Privacy Policy.
END
FR UAOARNSUVOUR