AI assistant
FLOWTECH FLUIDPOWER PLC Earnings Release 2025
7647_er_2026-03-24_d61f78bf-f512-4a7e-a673-b4bb2ec03570.html
Earnings Release
Open in viewerOpens in your device viewer
National Storage Mechanism | Additional information 
RNS Number : 7874X
Flowtech Fluidpower PLC
24 March 2026
| Tuesday, 24 March 2026 Immediate Release |
 |
Flowtech Fluidpower plc
(Flowtech, Group or Company"
"Our aim is to provide our customers with power, motion & control solutions, from a single component to integrated engineering systems and in the most cost-effective way, harnessing the best global brands and products, services and engineers in the market"
AIM listed Flowtech Fluidpower plc (LSE symbol: FLO) today releases audited preliminary results for the year ended 31 December 2025.
Mike England, CEO and CFO, Russell Cash will be presenting the Annual results presentation, an update on strategic progress and outlook via the Investor Meet Company (IMC) platform today at 11:00 GMT.
https://www.investormeetcompany.com/flowtech-fluidpower-plc/register-investor
PRELIMINARY RESULTS FOR THE YEAR ENDED 31 DECEMBER 2025
The following statement provides a summary of the 2025 results. The 2025 Annual Report and Financial Statements will be published and available on the Company's website shortly Investor Hub | Flowtech.
Key Financial Information
| Financial Highlights | 2025 | 2024 | Change |
| Revenue | £116.9m | £107.3m | +£9.6m |
| Gross profit % | 39.2% | 38.2% | +100bps |
| Operating loss | -£1.0m | -£25.2m | +£24.2m |
| Underlying EBITDA* | £7.7m | £5.9m | +£1.8m |
| Underlying operating profit* | £3.6m | £2.7m | +£0.9m |
| Net cash from operating activities | £7.8m | £8.7m | -£0.9m |
| Net debt | £15.2m | £15.1m | +£0.1m |
· Further details contained o pages 10 and 24
In Year Financial Highlights
| Ø Revenue increased by 9.0% for the period. Excluding the impact of the Thorite, Allswage and Thomas Group acquisitions like-for-like revenues were down by £3.0m (3.0%), reflecting continued challenging markets |
| Ø H2 saw like-for-like revenue growth of 7.6%, significantly offsetting the 11.9% reduction in H1, driven mainly by self-help measures, focusing on our four stated sales growth levers of: (1) new digital platform, (2) product & service expansion, (3) engineering projects ,and (4) inorganic opportunities |
| Ø Gross profit margin remained strong over the period, with further gross margin gains of 100bps in the year, reflecting disciplines introduced over recent years |
| Ø Underlying EBITDA of £7.7m represents a 30.5% increase from the prior year, with increased momentum in H2 showing through (H1 25 £3.5m, H2 25 £4.2m). The comparatives in FY24 were H1 £4.7m and H2 £1.2m. |
| Ø Net debt increased by £0.1m to £15.2m at the year-end; this represents a £3.3m reduction from the position at the end of H1 25 -Debt levels have remained stable in the year reflecting our restructuring activity and necessary capital investment in the business. Looking forward, we expect the combination of further progress in our stated growth initiatives, lower capital investments, and ongoing discipline over working capital to result in stronger cash conversion and a significant improvement in our leverage position. |
In Year Non-Financial Highlights
| Ø As we exited 2025, we transitioned from a "business transformation phase" into the "grow and build phase" of our value creation plan, as set out on the arrival of Mike England as CEO in 2023 -The Board believes that work performed over recent years including the integration of many separate businesses into One Flowtech, embedding the core foundations and necessary commercial, operational and technology improvements has enabled the scalable and efficient platform for growth that exists today. |
| Ø We entered 2026 with a stronger sales pipeline and orderbook, stable gross margins and positive momentum in several areas including: -The launch of our new website in August and which is showing improved trends in traffic and new customer gains -The introduction of new supplier agreements and associated product range expansion -Strong contribution from our three recently acquired businesses in terms of both revenue growth and positive EBITDA. (Thorite (August 2024), Allswage (March 2025), Thomas (May 2025). |
Post Period End Highlights
Ø We were delighted to announce the acquisition of Q Plus which completed on 12 February. The Q Plus performance and the integration process since completion has been in line with our expectations. As part of this the Company raised c.£9 million after costs, via a Placing. Proceeds have been used to fund the cash consideration of the acquisition, Q Plus B.V, to reduce debt to allow us increased financial flexibility, and for Group working capital purposes. We were delighted that the Placing was strongly supported by both existing and several new institutional investors and retail investors.
Current Trading and Outlook
| Ø Current trading is in line with our full year expectations |
| Ø Our order book and sales pipeline are demonstrating solid momentum and builds confidence beyond Q1 26 - focus on higher growth sectors such as defence, waterways & flood defence, data centres, and transportation continues |
| Ø The new digital platform is performing well, with month-on-month improvements showing positive signs |
| Ø Management focus on managing the quantum of capital investment and all aspects of working capital - confident that our cash conversion in FY26 will be much stronger than recent years |
| Ø Q Plus performance and the ongoing integration process is in line with expectations. |
Roger McDowell, Non-Executive Chair said:
"Whilst 2025 did not live up to our initial expectations and we were disappointed with the final outturn this was largely due to continued volatile external markets. I am, however, pleased to say that we exited the year with positive momentum. Our investment in a new digital platform is a cornerstone of Flowtech's growth strategy providing the scalable foundation required to support future expansion. The Board views this investment as essential to building a more resilient, data-led, and sustainably growing international business.
"In addition, over the last two years, we have completed a wide-ranging programme of operational transformation that will help underpin our performance. During the period, our more recent acquisitions performed well and, post year end, we were also delighted to announce that Q Plus (a Benelux based business) has joined the Group.
"Whilst trading conditions continue to remain difficult to predict, particularly with the impact of recent events in the Middle East, we are now confident that Flowtech is well positioned to maximise the opportunities available.''
Annual General Meeting (AGM)
The AGM will be held on 19 June 2026 at 10am. The Company is facilitating an online AGM experience via the Investor Meet Company platform, details of which are contained in the Notice of Meeting. Those joining the meeting remotely will have the opportunity to join the meeting from any remote location and to listen to the proceedings of the meeting. The webcast will also be available on the website after the event.
To read some examples of our projects within our key sectors, see below:
| Case Study: Data Centre South Wales: https://flowtech.co.uk/case-studies/data-centre-south-wales |
| Case Study: Merchant Square Bridge Design: https://flowtech.co.uk/case-studies/merchant-square-bridge-design |
| Case Study: Fruit Harvesting Machine: https://flowtech.co.uk/case-studies/fruit-harvesting-machine |
| Case Study: Food-Grade Packaging Machine: https://www.thorite.co.uk/article/2023-june-resolving-packaging-nightmares-with-electric-automation |
Flowtech Fluidpower plc
Preliminary results for the year ended 31 December 2025
Statement by the Chair, Roger McDowell
"Digital investment and future growth"
A Year of Progress
Whilst not being satisfied with the overall financial performance in 2025, we have a renewed determination to deliver a marked improvement in 2026 and believe we have now built the infrastructure to enable growth. Over the past year, building on 2024, the Board has overseen a comprehensive programme of change, including the implementation of a refreshed strategy, the integration of multiple businesses into One Flowtech, and the strengthening of the Group's commercial, operational, and technological foundations.
These actions have materially improved the resilience, efficiency, and scalability of the business, whilst providing more protection against challenging market conditions in the future.
2025 was a year of meaningful progress and transition for Flowtech. The Group has largely completed its Business Transformation phase and enters 2026 positioned to move into the next stage of its strategic development and growth.
While trading conditions remained challenging throughout 2025, particularly in the UK, the Group delivered a steady improvement in performance, with momentum building in the second half of the year. This improvement reflected disciplined execution of management's self-help initiatives, tighter cost control, and a sustained focus on working capital. The Board was satisfied by the strengthening of the sales pipeline and orderbook by the end of 2025 alongside stable gross margins, continued reductions in overheads and improved customer service metrics.
The Group's financial performance improved during the year. EBITDA increased by more than 30% compared with 2024, with a stronger second-half performance reversing the Group's typical seasonal weighting. Net debt at year end was broadly stable, reflecting the necessary investment made to complete the transformation programme. The Board expects that improved cash conversion, lower capital expenditure and continued operational discipline will support a reduction in leverage over time.
The Board continues to view disciplined M&A as a core component of the Group's growth strategy. The acquisitions of Thorite, Allswage and Thomas Group have integrated well and contributed to the Group's financial performance during the year. Additionally, in January 2026, the Group announced the acquisition of Q Plus in the Netherlands, an earnings-enhancing transaction that is expected to approximately double the size of the Benelux business and thereby strengthen Flowtech's European footprint.
Governance and Digital Enablement
The Board recognises that long-term value creation is underpinned by strong governance, a positive culture and disciplined investment in strategic capabilities. These areas received increased focus during 2025 as the Group progressed through a period of significant change.
A key area of Board oversight has been the Group's investment in a new digital platform. This investment represents a foundation for Flowtech's future growth, rather than just a standalone technology initiative. The platform provides a single, scalable digital architecture to replace multiple legacy systems, improve data quality and enhance operational control. It also underpins the Group's omni-channel strategy, enabling improved customer access, product visibility and service consistency across regions.
Importantly, the Board views the digital platform as critical to supporting scalable growth without a commensurate increase in cost, strengthening working capital management, and enabling more informed decision-making through improved insight and reporting. While further rollout and optimisation remain ongoing, the successful launch in the UK during 2025 represents a significant milestone in modernising the Group's operating model.
People, Culture and ESG
Alongside digital investment, people and culture remained a core Board priority. Progress was made in building a more cohesive One Flowtech culture through improved internal communication, greater consistency in policies and employment practices, and the introduction of Group-wide wellbeing and employee benefits programmes. Health & Safety continued to receive focused Board attention, supported by leadership engagement, training and consistent standards across the Group.
The Board also recognises the increasing importance of environmental and social responsibility. During the year, the Group focused on establishing stronger ESG foundations, including improved data capture, responsible sourcing practices and network optimisation to reduce operational inefficiencies and environmental impact. While progress has been made, the Board acknowledges that ESG capability will continue to develop as the Group enters its growth phase.
Looking ahead
I would like to thank my fellow Board members for their hard work during this important period, and, also to highlight the commitment and resilience of Flowtech's colleagues across the Group. I would equally thank our customers, suppliers and shareholders for their continued support.
While the external environment remains uncertain and challenging the Board continues to take a prudent view of the near-term outlook, Flowtech enters 2026 with improving momentum, a stronger operating platform and a clear strategy for sustainable, responsible and digitally enabled growth.
Flowtech Fluidpower plc
Preliminary results for the year ended 31 December 2025
Review by the CEO, Mike England
"At the end of 2025, we were pleased to report that we have transitioned from the 'business transformation phase' into the 'grow and build phase' of our value creation plan."
Reflections
Since Q2 2023, we have been going through a transformative period as a Group, with a refreshed strategy, integrating multiple businesses into One Flowtech, and embedding the commercial, operational and technological foundations required to support scalable growth.
The progress over the past two years has established a more efficient and resilient platform, with the majority of transformation activity now been completed in 2025. Work remains in scaling the new web platform across all regions, further simplifying the technology landscape and continuing to embed the refreshed operating model and One Flowtech culture.
I would like to thank colleagues from across the Group for their commitment during this period of change, and our customers and suppliers for their continued support.
Self-help initiatives drove second-half momentum
Despite continued market headwinds, the Group delivered a steady improvement in performance during the year, with momentum strengthening in the second half. This reflected disciplined execution of self-help growth initiatives and a continued focus on cost and cash control.
Flowtech finished 2025 with a stronger sales pipeline and orderbook, stable gross margins, lower overheads and improved working capital. Progress was evident across all four self-help initiatives:
| · Digital Platform Ecosystem - new UK website launched in August, along with a broader stack of improvements including web eCommerce, Product Information Management (PIM) and Customer Data Platform (CDP), delivering improved traffic and customer acquisition |
| · Product range - new supplier agreements enabled targeted range expansion |
| · Engineering - group engineering orderbook increased by over 20% year-on-year |
| · Acquisitions - Thorite, Allswage and Thomas Group delivered revenue growth and positive EBITDA contributions |
Excluding acquisitions, operating overheads reduced by 6% and working capital by 11% in 2025. Gross margins improved by 100bps, cementing and building on the progress made over recent years.
Improving profitability and balance sheet trajectory
Revenue for the year was £116.9m, up £9.6m (+8.9%). Excluding acquisitions, like-for-like revenue declined by £3.0m (3.0%), reflecting the previously reported reduction in H1 2025, partly offset by a return to growth in H2 2025 (+7.6% like-for-like).
Underlying EBITDA increased to £7.7m, up 30.5% year-on-year. Performance was impacted by the deferral of several large projects from Q4 2025 into Q1 2026, temporary sales softness following the UK Budget, and short-term gross margin pressure in Q4.
Underlying EBITDA strengthened through the year, with £3.5m generated in H1 2025 and £4.2m in H2 2025, reversing the Group's typical seasonal weighting and demonstrating improving momentum by the end of 2025.
Net debt at year end was£15.2m (2024: £15.1m), representing a £3.3m reduction from H1 2025. Restructuring activity and capital investment of approximately £11m across 2024 and 2025 constrained near-term deleveraging. Looking ahead, lower capital expenditure, continued working capital discipline and improving trading from the Group's growth initiatives are expected to support stronger cash conversion and reduced leverage.
Regional performance
Great Britain
Strong second-half momentum was delivered across all channels, including Product Distribution, Thorite, Engineering Solutions and Major Projects. Sales growth improved and the engineering orderbook continued to build.
The new website continues to perform well. New supplier agreements supported range expansion, with an SMC exit run-rate of approximately £2m incremental sales. Recently acquired businesses exited the year at a combined run-rate of approximately £20m revenue and £2m EBITDA.
Island of Ireland
Performance improved in the second half as volumes returned within the crushing and screening OEM customer base, reflecting early signs of market stabilisation. Capacity at the Dungannon Hydraulic Hose Assembly facility was increased in Q4 2025 in response to a strengthening orderbook.
Benelux
Benelux underwent a significant transformation under a refreshed leadership team during 2025. Multiple businesses were successfully integrated into One Flowtech, including the consolidation of two operations into a new facility in Rotterdam and the expansion of distribution capabilities in Deventer.
While the transformation resulted in some temporary service disruption, performance stabilised into Q4 2025. The region ended 2025 in a materially stronger position, with organic growth momentum improving and inorganic growth plans advancing with the acquisition of Q Plus in January 2026, doubling the revenue for this region and creating a market leading £18m specialist pneumatics capability.
Delivering the transformation
Key transformation milestones achieved in 2025 included:
| Digital · Launch of a new web platform (which is just one component of a wider ecosystem) to replace fragmented legacy systems with a scalable and unified architecture |
| M&A and integration · Allswage UK (March 2025) - hose assembly equipment and testing · Thomas Group (May 2025) - engine parts, filtration and fuel technology · Thorite - turnaround completed, returned to profitability |
| Engineering and major projects · Waterford Rice Bridge £3.9m - MICA delivery and support · Narrow Water Bridge £3.9m - hydraulic and control systems |
| Supplier relationships · Appointed SMC's first UK wholesale distribution partner · Restoration of HPC / Kaiser relationship · Introduction of new brands including Piab, Gast and Graco |
| Network optimisation · New and relocated sites across the UK and Benelux, including Rotterdam consolidation · Exit of Peel Road site and consolidation into main Skelmersdale fulfilment centre |
| People and service · Progress on One Flowtech culture, employee benefits, wellbeing and Health & Safety · Service levels maintained at 99.8% on-time-to-promise and 97% stock availability on core ranges |
Environmental responsibility
Flowtech's environmental focus in 2025 was on establishing the foundations required to reduce the Group's environmental impact in a structured and measurable way. This includes:
| Net Zero Road Map & Emissions · after establishing a baseline in 2024, we are now well on our way to our 2030 target, with a year-on-year reduction in 2025 of 35.4% |
| Network Optimisation · prioritised network optimisation and site consolidation, including the exit of the Peel Road site and consolidation into Skelmersdale, reducing duplication of space, transport movements and energy usage |
| Smart Waste Plan · continued to invest in inventory optimisation and improved forecasting to reduce waste and obsolescence |
| Eco-Smart Sourcing · collaborated with key suppliers to increase the availability of more energy-efficient and lower-impact products for customers Further work is underway to enhance environmental data quality and define clear reduction targets, which will be reported as these frameworks mature. |
| People, health and safety The safety, wellbeing and engagement of colleagues remains a core priority. In 2025, the Group made strong progress in: · Health & Safety - embedding consistent Health & Safety standards across the business, supported by leadership focus, training and improved reporting from all sites, including new acquisitions · Wellbeing - launching an integrated Wellbeing Strategy, created a Wellbeing Committee and launched new and enhanced benefits programme across the Group · Gender & Equality - continued progress towards alignment of employee terms and conditions, supporting fairness and consistency across One Flowtech · Community & Engagement - strengthening internal communications and engagement as part of the One Flowtech cultural programme These initiatives supported improved engagement and resilience during a year of significant operational change. Health & Safety performance and employee engagement will remain key focus areas in 2026. |
| Governance and risk management The Board recognises the importance of strong governance, particularly during periods of transformation and growth. In 2025: · Accountability - Management discipline around cost control, capital allocation and working capital management was strengthened · Risk Management - integration governance and acquisition discipline were applied consistently across M&A activity, ensuring value creation and risk management · Operational Integrity - the operating model and decision-making framework were further embedded across One Flowtech centred around the need of our customers The Board continues to review governance structures to ensure they remain appropriate as the Group enters its next phase of growth. |
Acquisition of Q Plus
In January 2026, Flowtech announced the acquisition of Q Plus, a leading Dutch specialist in pneumatics, automation, compressed air and vacuum solutions. The acquisition is expected to approximately double the size of the Group's Benelux business and is earnings enhancing.
Q Plus strengthens Flowtech's European footprint and aligns fully with the Group's growth strategy. The Board welcomes Q Plus colleagues to the Group.
Looking Ahead
A question asked to many businesses is the use of AI. Currently, at Flowtech AI represents a relatively small, targeted part of our IT investment. Having said this AI is assisting with improving product data quality, search and discovery, customer insight analysis, and reducing manual effort in data and engineering work. We are exploring more advanced AI capabilities, but only once the data, systems and governance are ready and we can demonstrate that AI can remove cost, improve productivity, and support growth. Our immediate priority is getting real value from AI in the core of the business, not racing ahead of our foundations.
Despite improving momentum and a strong orderbook, UK and EU market conditions remain challenging and are not expected to improve materially in the near term with continued uncertainty given ongoing global conflicts, political and macro-economic disruption. In addition, increases in the National Minimum Wage in the UK are expected to place further pressure on costs in 2026. The Group therefore maintains a prudent outlook until clearer signs of market recovery emerge.
External markets aside, I look forward with optimism in seeing the transformative phase of the last two years, now enabling Flowtech to accelerate its performance, and with the One Flowtech approach being further embedded in 2026, unlocking the full potential of the Group.
Flowtech Fluidpower plc
Preliminary results for the year ended 31 December 2025
Financial Review by CFO, Russell Cash
"We have sought to exercise tight control over all aspects of our cost base and working capital which has been key in enabling us to deliver a blend of restructuring and investment activity without any material increase in Debt. As the pace of change eases, we look forward to a much bigger proportion of what we expect to be increased profits translating to positive cashflow."
Group Trading Performance at a Glance
| Operational Review | 2025 £m |
2024 £m |
Change £m% |
| Group revenue* | 116.9 | 107.3 | 9.0% |
| Gross profit* | 45.9 | 41.0 | 11.9% |
| Gross profit % | 39.2% | 38.2% | 100bps |
| Distribution expenses | (4.4) | (4.2) | (0.2) |
| Administrative expenses before separately disclosed items | (37.9) | (34.2) | (3.7) |
| Underlying operating overheads | (42.2) | (38.3) | (3.9) |
| Add back Central costs | 5.9 | 6.0 | (0.1) |
| Underlying segment operating overheads | (36.4) | (32.3) | (4.0) |
| Underlying Depreciation and Amortisation | 4.1 | 3.3 | |
| Underlying segment operating profit | 9.5 | 8.7 | 0.8 |
| Less Central costs | (5.9) | (6.0) | 0.1 |
| Underlying operating profit | 3.6 | 2.7 | 1.0 |
| Less separately disclosed items | (4.6) | (27.9) | 23.3 |
| Operating (loss) | (1.0) | (25.2) | 24.2 |
| Financing costs | (2.0) | (1.9) | (0.1) |
| Loss before tax | (3.0) | (27.1) | 24.1 |
| Tax | (0.4) | 0.7 | (1.1) |
| Loss after tax | (3.3) | (26.4) | 23.1 |
| Underlying EBITDA | 7.7 | 5.9 | 1.8 |
(*) Underlying operating profit is used as an alternative performance measure to assess the trading performance of the business and is operating profit before separately disclosed items which are amortisation and impairment of acquired intangibles, impairment of goodwill, negative goodwill, impairment of right of use assets, share-based payments, and restructuring costs. The £4.1m differential between underlying operating profit and underlying EBITDA relates to £4.1m in respect of depreciation and amortisation charges
Underlying profit performance
In FY25 underlying EBITDA totalled £7.7m, significantly in excess of the prior year comparative of £5.9m and a stepping stone towards our ambition of achieving mid-teen EBITDA margins. It was encouraging that we delivered a stronger performance in the second half of the year resulting in underlying EBITDA of £4.2m, £3.0m more than the second half of FY24. This has been achieved against a background of continued challenging market conditions with performance supported by the impact made by recently acquired businesses, notably Thorite.
Revenue
Revenue in FY25 increased by 9.0% to £116.9m (FY24: £107.3m). Excluding the contributions from the 2024/25 acquisitions FY25 revenue was £99.5m, 3% below the prior year like-for-like comparative. If we look at the split between the two halves of the year it is pleasing to see H2 outperforming the prior year comparative by 7.6%; this served to offset much of the first half adverse variance of 11.9%.
Gross profit
FY25 saw a further 100bps increase in our GP% and builds on progress made in previous years. Management of gross margin remains an area of focus, and we expect to maintain the position we have reached over coming years; mix factors in particular if a higher proportion of turnover transitions to Major Projects could mean that, over time, we may see further relatively modest improvements.
Operating overheads
Excluding the impact of acquisitions underlying operating overheads have reduced by £0.6m (1.6%); this has been achieved against the background of sustained inflationary pressures including the increases in minimum wage and employer national insurance contributions, factors which are clearly outside of our control. The principal reason for this is the management of our headcount where we have seen headcount fall to 538 from 560 excluding acquisitions.
Central costs
| A summary of central costs is provided below: | 2025 £000 |
2024 £000 |
| Management costs | 2,369 | 2,376 |
| Accounting & finance | 850 | 939 |
| Project & IT costs | 1,106 | 1,132 |
| PLC costs | 588 | 572 |
| Other central operating costs | 956 | 1,021 |
| 5,868 | 6,040 |
Management costs include the employment costs of the Executive Officers, Group Leadership Team members excluding those that have specific segment responsibilities. Cost increases in this area have been offset by headcount reductions.
Accounting and finance cover the salary costs of central finance and internal audit function. PLC costs capture the salaries of Non- Executive Directors and professional fees associated with our PLC status. Other areas of cost relate to our project management and central health and safety teams.
The overall reduction in costs is the result of ongoing cost saving initiatives within the business, many of which began in FY24, and we are feeling the full benefit in FY25.
Separately disclosed items
| Separately disclosed items within administrative expenses: | 2025 £000 |
2024 £000 |
| Amortisation of acquired intangibles | 655 | 820 |
| Impairment of goodwill | - | 25,070 |
| Depreciation of old website YTD | 197 | 241 |
| Impairment of right of use assets | 1,318 | 81 |
| Impairment of intangible assets | - | 284 |
| Impairment of fixed assets | 429 | 246 |
| Negative goodwill | (170) | (2,205) |
| Share option costs | 531 | 729 |
| Write off lease liability | (29) | - |
| Acquisition cost | 226 | 41 |
| Restructuring cost | 1,477 | 2,581 |
| 4,634 | 27,888 |
Impairment of right of use assets and fixed assets
The calculations which underpin the annual impairment review of the assets of the business are based on a number of key assumptions, notably revenue growth rates and the discount rate applied. An impairment charge of £1,747k has been posted in respect of the Benelux region, of which £1,318k has been taken against right of use assets and £429k has been taken against fixed assets.
Restructuring costs
The key components of restructuring are £0.6m in respect of salary costs of personnel who have left the business as part of our ongoing organisational design. In addition, £0.4m was incurred in relation to the closure of sites within the UK and Benelux.
Our geographical segments at a glance
| Great Britain (GB) | Benelux | Island of Ireland | ||||
| 2025 Audited £000 |
2024 Audited £000 |
2025 Audited £000 |
2024 Audited £000 |
2025 Audited £000 |
2024 Audited £000 |
|
| Revenue (£000) | 86,625 | 75,914 | 9,473 | 9,999 | 20,817 | 21,370 |
| Gross profit (£000) | 33,506 | 30,872 | 4,142 | 4,211 | 9,093 | 5,933 |
| Gross profit margin | 38.7% | 38.8% | 43.7% | 42.1% | 39.5% | 34.5% |
| Underlying operating costs (£000) | 27,230 | 23,626 | 3,829 | 3,848 | 5,301 | 4,850 |
| Underlying operating profit (£000) | 6,275 | 5,808 | 313 | 363 | 2,923 | 2,521 |
| Underlying operating margin | 7.2% | 7.6% | 3.3% | 3.6% | 14.0% | 11.8% |
| Underlying profit before tax | 5,767 | 5,481 | 255 | 357 | 2,900 | 2,496 |
Great Britain
Revenue includes £17.4m in respect of recently acquired businesses in FY25 and £4.7m in FY24. After taking account of this on a like-for-like basis revenue reduced by £1.8m. The acquired businesses have a lower Gross Margin which contributed to the fall overall. The recently acquired businesses provided a significant positive contribution to the FY25 result with an aggregate exit run rate of £2m EBITDA. Overall, it is pleasing to see a £467k improvement in the segment profitability.
Benelux
The impact of a 5.3% reduction in turnover has been largely offset by a 160bps improvement in Gross Margins. Operating expenses have been well controlled ensuring a similar operating profit was achieved. Market conditions were challenging throughout the year and this, combined with some disruption related to a move of premises, did have an impact on performance.
Island of Ireland
A 3.4% reduction in turnover was offset by a 500bps increase in Gross Margin leading to gross profit increasing by £852k. Inflation had an impact on operating expenses, but this cost was offset overall and the underlying operating margin increased to 14% from 11.8% in FY24.
Net Debt
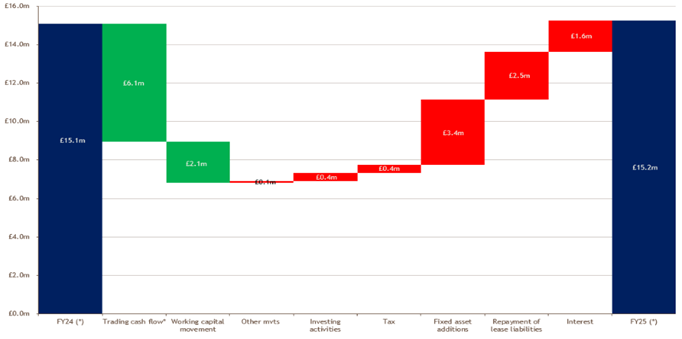
Trading cash flow is Operating profit excluding non-cash items such as Depreciation, Amortisation and share based payments.
Our Net Debt position (excluding lease liabilities) has had a small increase from £15.1m to £15.2m. Trading cash flow has improved to £6.1m (FY24: £3.1m) reflecting higher underlying levels of EBITDA and a reduction in restructuring activity. Working capital continues to be actively managed; in FY25 the overall reduction of £2.1m results from a £2.9m like-for-like reduction offset by a £0.8m increase in balances associated with the acquired businesses. These two things combined have funded the aggregate cost of all other cash outflows and limited the increase in Bank debt to £0.1m.
FY24 and FY25 combined have resulted in £6.6m of capital expenditure and £3.9m of restructuring costs. We expect both categories of spend to reduce materially in FY26 and beyond which should lead to a healthy proportion of EBITDA translating to debt reduction.
Acquisitions
The acquisition of Thorite in August 2024 has been followed by two smaller acquisitions in FY25, Allswage in March and Thomas Group in May. If the three businesses are taken in aggregate, we acquired in the region of £16m of revenue for very modest consideration as demonstrated by the negative goodwill associated with the Thorite and Allswage transactions. It is extremely pleasing to see that as we exited 2025 the run rate of these businesses was approximately £20m revenue with a significant profit contribution.
Summary
The positive increase in profitability in FY25 is pleasing against the background of continued challenging market conditions. We have sought to exercise tight control over all aspects of our cost base and working capital which has been key in enabling us to deliver a blend of restructuring and investment activity without any material increase in Debt. As the pace of change eases, we look forward to a much bigger proportion of what we expect to be increased profits translating to positive cashflow.
One of the highlights in FY25 has been the progress achieved and momentum built with the acquisitions made in FY24 and FY25. These businesses were acquired for minimal consideration, and we end FY25 with the businesses combined delivering a run rate of approximately £20m of revenue and significant profit.
I am also delighted that we have secured the acquisition of Q Plus in February 2026 and as part of this secured new equity investment into the balance sheet.
Consolidated Income Statement
For the year ended 31 December
| 2025 £000 |
2024 £000 |
||
| Continuing operations | |||
| Revenue | 116,915 | 107,282 | |
| Cost of sales | (71,045) | (66,267) | |
| Gross profit | 45,870 | 41,015 | |
| Distribution expenses | (4,360) | (4,169) | |
| Administrative expenses before separately disclosed items: | (37,867) | (34,196) | |
| - Separately disclosed items | (4,634) | (27,888) | |
| Total administrative expenses | (42,501) | (62,084) | |
| Operating loss | (991) | (25,238) | |
| Financial expenses | (1,961) | (1,839) | |
| Loss from continuing operations before tax | (2,952) | (27,077) | |
| Taxation | (366) | 671 | |
| Loss from continuing operations | (3,318) | (26,406) | |
| Loss for the year attributable to: | |||
| Owners of the parent | (3,318) | (26,406) | |
| (3,318) | (26,406) | ||
| Earnings per share | |||
| Basic earnings per share - continuing operations | (5.24p) | (42.23p) |
Consolidated Statement of Comprehensive Income
| 2025 £000 |
2024 £000 |
|
| Loss for the year | (3,318) | (26,406) |
| Other comprehensive income / (expense) | ||
| Items that will be reclassified subsequently to profit or loss | ||
| - Exchange differences on translating foreign operations | 410 | (359) |
| Total comprehensive loss for the year | (2,908) | (26,765) |
| Total comprehensive loss for the year attributable to: Owners of the parent |
(2,908) | (26,765) |
| (2,908) | (26,765) |
Consolidated Statement of Financial Position
| 2025 £000 |
2024 £000 |
||
| Assets | |||
| Non-current assets | |||
| Goodwill | 14,996 | 14,996 | |
| Other intangible assets | 5,271 | 3,776 | |
| Right-of-use assets | 6,769 | 4,806 | |
| Property, plant and equipment | 6,637 | 7,546 | |
| Total non-current assets | 33,673 | 31,124 | |
| Current assets | |||
| Inventories | 29,156 | 29,263 | |
| Trade and other receivables | 25,809 | 22,740 | |
| Prepayments | 1,587 | 1,052 | |
| Cash and cash equivalents | 4,734 | 1,839 | |
| Total current assets | 61,286 | 54,894 | |
| Liabilities | |||
| Current liabilities | |||
| Lease liabilities | 2,378 | 1,694 | |
| Trade and other payables | 26,583 | 20,866 | |
| Tax payable | 98 | 228 | |
| Total current liabilities | 29,059 | 22,788 | |
| Net current assets | 32,227 | 32,106 | |
| Non-current liabilities | |||
| Interest-bearing borrowings | 19,972 | 16,913 | |
| Lease liabilities | 6,203 | 3,743 | |
| Provisions | 50 | 179 | |
| Deferred tax liabilities | 448 | 791 | |
| Total non-current liabilities | 26,673 | 21,626 | |
| Net assets | 39,227 | 41,604 | |
| Equity directly attributable to owners of the Parent | |||
| Share capital | 31,637 | 31,637 | |
| Share premium | - | 61,662 | |
| Other distributable reserves | 61,662 | - | |
| Other reserves | 187 | 187 | |
| Shares owned by the Employee Benefit Trust | (54) | (54) | |
| Merger reserve | 293 | 293 | |
| Merger relief reserve | 3,646 | 3,646 | |
| Currency translation reserve | 74 | (336) | |
| Retained losses | (58,218) | (55,431) | |
| Total equity attributable to the owners of the Parent | 39,227 | 41,604 |
Consolidated Statement of Changes in Equity
| Share capital £000 | Share premium £000 |
Other distributable reserves | Other reserve £000 |
Shares owned by the EBT £000 |
Merger reserve £000 |
Merger relief reserve £000 |
Currency translation reserve £000 |
Retained losses £000 |
Total equity £000 |
|
| Balance at 1 January 2024 | 30,746 | 60,959 | - | 187 | (124) | 293 | 3,646 | 23 | (28,331) | 67,399 |
| Loss for the year | - | - | - | - | - | - | - | - | (26,406) | (26,406) |
| Other comprehensive income | - | - | - | - | - | - | - | (359) | - | (359) |
| Total comprehensive income for the year | - | - | - | - | - | - | - | (359) | (26,406) | (26,755) |
| Transactions with owners | - | |||||||||
| Share-based payment charge | - | - | - | - | - | - | - | - | 730 | 730 |
| Issue of share capital | 891 | 703 | - | - | (200) | - | - | - | - | 1,394 |
| Share options settled | - | - | - | 270 | - | - | - | (41) | 229 | |
| Dividends paid | - | - | - | - | - | - | - | - | (1,383) | (1,383) |
| Total transactions with owners | 891 | 703 | - | - | 70 | - | - | - | (694) | 970 |
| Balance at 31 December 2024 | 31,637 | 61,662 | - | 187 | (54) | 293 | 3,646 | (336) | (55,431) | 41,604 |
| Balance at 1 January 2025 | 31,637 | 61,662 | - | 187 | (54) | 293 | 3,646 | (336) | (55,431) | 41,604 |
| Loss for the year | - | - | - | - | - | - | - | - | (3,318) | (3,318) |
| Other comprehensive income | - | - | - | - | - | - | - | 410 | - | 410 |
| Total comprehensive income for the year | - | - | - | - | - | - | - | 410 | (3,318) | (2,908) |
| Transactions with owners | ||||||||||
| Transfer between reserves | (61,662) | 61,662 | ||||||||
| Share-based payment charge | - | - | - | - | - | - | 531 | 531 | ||
| Total transactions with owners | - | (61,662) | 61,662 | - | - | - | - | - | 531 | 531 |
| Balance at 31 December 2025 | 31,637 | - | 61,662 | 187 | (54) | 293 | 3,646 | 74 | (58,218) | 39,227 |
Consolidated Statement of Cash Flows
| 2025 £000 |
2024 £000 |
||
| Cash flow from operating activities | |||
| Net cash from operating activities | 7,780 | 8,706 | |
| Cash flow from investing activities | |||
| Payment for acquisition | (100) | (832) | |
| Repayment of Credit facility from acquisition | (280) | (1,694) | |
| Acquisition of property, plant and equipment | (1,214) | (1,547) | |
| Acquisition of intangible assets | (2,192) | (1,764) | |
| Proceeds from sale of property, plant and equipment | - | 31 | |
| Net cash used in investing activities | (3,786) | (5,806) | |
| Cash flows from financing activities | |||
| Net proceeds from issue of share capital | - | 1,393 | |
| Repayment of lease liabilities | (2,137) | (1,663) | |
| Drawdown / (Repayment) of bank loan | 3,000 | (3,000) | |
| Interest on lease liabilities | (336) | (117) | |
| Other interest | (1,625) | (1,725) | |
| Additional credit facility recognised on acquisition | (30) | - | |
| Proceeds from sale of shares held by the EBT | - | 270 | |
| Dividends paid | - | (1,383) | |
| Net cash used in financing activities | (1,128) | (6,225) | |
| Net change in cash and cash equivalents | 2,866 | (3,325) | |
| Cash and cash equivalents at start of year | 1,839 | 5,184 | |
| Exchange differences on cash and cash equivalents | 29 | (20) | |
| Cash and cash equivalents at end of year | 4,734 | 1,839 | |
| Net Debt | 15,238 | 15,074 |
Flowtech Fluidpower plc
Preliminary results for the year ended 31 December 2025
Notes to the Consolidated Financial Information
1. General information
The principal activity of Flowtech Fluidpower plc (the 'Company') and its subsidiaries (together, the 'Group') is the distribution of engineering components and assemblies, concentrating on the fluid power industry. The Company is a public limited company, incorporated and domiciled in the United Kingdom. The address of its registered office is Bollin House, Bollin Walk, Wilmslow, SK9 1DP. The registered number is 09010518.
News updates, regulatory news, and financial statements can be viewed and downloaded from the Group's website, flowtech.co.uk. Copies can also be requested from: The Company Secretary, Flowtech Fluidpower plc, Bollin House, Bollin Walk, Wilmslow, SK9 1DP. Email: [email protected].
2. Accounting policies
Basis of preparation
The consolidated financial statements of the Group have been prepared in accordance with UK adopted international accounting standards and the Companies Act 2006. The Company financial statements have been prepared in accordance with Financial Reporting Standard 101 'Reduced disclosure framework' (FRS 101). The consolidated financial statements have been prepared on a going concern basis and prepared on the historical cost basis. The consolidated financial statements are presented in sterling and have been rounded to the nearest thousand (£'000). The functional currency of the Company is sterling.
The preparation of financial information in conformity with UK-adopted international accounting standards requires management to make estimates and assumptions that affect the reported amounts of assets and liabilities at the date of the financial statements and the reported amounts of revenues and expenses during the reporting period. Although these estimates are based on management's best knowledge of the amount, event or actions, actual events ultimately may differ from those estimates.
The accounting policies, unless otherwise stated, been applied consistently to all periods presented in the consolidated financial statements.
Annual Report 2025
The Annual Report and Financial Statements for the year ended 31 December 2025 will be published shortly and will become available on the Company's investor hub and also sent to shareholders. Reports And Key Documents | Investor Hub | Flowtech
The financial information set out in this announcement does not constitute the Company's statutory accounts for the years ended 31 December 2025 and 2024. The financial information for the year ended 31 December 2024 is derived from the statutory accounts for that year which have been delivered to the Registrar of Companies. The financial information for the year ended 31 December 2025 is derived from the audited statutory accounts for the year ended 31 December 2025 which were approved by the Board on 23 March 2026 and will be delivered to the Registrar of Companies following the Company's Annual General Meeting.
The auditor's reported on each of those accounts: their report was unqualified, did not draw attention to any matters by way of emphasis and did not contain a statement under s498(2) or (3) of the Companies Act 2006.
Going concern
The financial statements are prepared on a going concern basis which the Directors believe to be appropriate for the following reasons:
| · The Group made a £1.0m operating loss in 2025 (2024: £25.2m), and after adding back separately disclosed items, this represents an underlying operating profit of £3.6m (2024: £2.7m) |
| · The Group is expecting to see increased profitability in 2026 |
| · The Group maintains a strong relationship with its bankers. Given that the business was loss making in 2024, and in 2025 it was necessary to agree a relaxation of certain of the banking covenants which covers the period up to December 2025. The Group expects to remain compliant with all covenants throughout 2026 and beyond under base case and severe downside scenarios. |
| · Post year end the Group underwent the process of raising equity through issuing new shares, around £3m of the funds raised will be allocated to reducing the Net Debt of the business. |
| · At the end of 2025, the Group's Net Debt was £15.2 million (£9.8 million within the aggregate banking facilities which include a £5.0 million overdraft facility). Whilst the overdraft facility has been in place for many years it is technically repayable on demand, The forecasts and the sensitivities subsequently applied show no reliance on the facility during the going concern assessment period. |
3. Operating Divisions
The Group monitors and reports business performance based on these three segments:
| Great Britain: Supply of both hydraulic and pneumatic consumables, along with the delivery of specialist engineering solutions, services and systems. We operate through a network of distributors and resellers as well as working directly with a broad range of original equipment manufacturers across all industry sectors |
| Ireland: Supply of specialist technical hydraulic components and systems predominantly into original equipment manufacturers and end-user channels to all industry sectors and supported by supply agreements direct to a broad range of manufacturer brands. |
| Benelux: Supply of bespoke hydraulic and pneumatic component and systems to manufacturers of specialised industrial and mobile hydraulic original equipment manufacturers and a wide range of industrial end users. |
Segment information for the reporting periods are as follows:
| For the year ended 31 December 2025 | Great Britain £000 |
Benelux £000 |
Ireland £000 |
Central costs £000 |
Total continuing operations £000 |
| Income statement - continuing operations: | |||||
| Total revenue | 86,625 | 9,473 | 20,817 | - | 116,915 |
| Underlying operating result (*) | 6,275 | 313 | 2,923 | (5,868) | 3,643 |
| Financial expenses | (507) | (58) | (23) | (1,373) | (1,961) |
| Underlying segment result | 5,768 | 255 | 2,900 | (7,241) | 1,682 |
| Separately disclosed items | (1,434) | (2,030) | (202) | (967) | (4,633) |
| Profit/(loss) before tax | 4,334 | (1,775) | 2,698 | (8,208) | (2,951) |
| Specific disclosure items | |||||
| Depreciation and impairment on owned plant, property and equipment | 1,341 | 80 | 99 | 1 | 1,521 |
| Depreciation on right of use assets | 1,450 | 327 | 156 | 133 | 2,066 |
| Accelerated depreciation of old website | 197 | - | - | - | 197 |
| Write off lease liability | 29 | - | - | - | 29 |
| Negative goodwill | (170) | - | - | - | (170) |
| Impairment of right of use assets | - | 1,318 | - | - | 1,318 |
| Impairment of fixed assets | - | 429 | - | - | 429 |
| Amortisation | 1,132 | - | - | - | 1,132 |
| Reconciliation of underlying operating result | |||||
| Underlying operating result (*) | 6,275 | 313 | 2,923 | (5,868) | 3,643 |
| Separately disclosed items | (1,434) | (2,030) | (202) | (968) | (4,634) |
| Operating (loss)/profit | 4,841 | (1,717) | 2,721 | (6,836) | (991) |
(*) Underlying operating result is continuing operations' operating profit before separately disclosed items
| For the year ended 31 December 2024 | Great Britain £000 |
Benelux £000 |
Ireland £000 |
Central costs £000 |
Total continuing operations £000 |
| Income statement - continuing operations: | |||||
| Total revenue | 75,913 | 9,999 | 21,370 | - | 107,282 |
| Underlying operating result (*) | 5,806 | 363 | 2,521 | (6,040) | 2,650 |
| Financial expenses | (325) | (6) | (23) | (1,482) | (1,836) |
| Underlying segment result | 5,481 | 357 | 2,498 | (7,522) | 814 |
| Separately disclosed items | (21,715) | (3,823) | (218) | (2,133) | (27,888) |
| Profit/(loss) before tax | (16,234) | (3,466) | 2,278 | (9,655) | (27,077) |
| Specific disclosure items | |||||
| Depreciation and impairment on owned plant, property and equipment | 1,375 | 70 | 96 | 1 | 1,542 |
| Depreciation on right of use assets | 1,109 | 112 | 165 | 146 | 1,532 |
| Accelerated depreciation of old website | 241 | - | - | - | 241 |
| Impairment of right of use assets | 61 | 20 | - | - | 81 |
| Negative goodwill | (2,205) | - | - | - | (2,205) |
| Impairment of goodwill | 22,005 | 3,065 | - | - | 25,070 |
| Impairment of intangible assets | 284 | - | - | 284 | |
| Impairment of fixed assets | - | 246 | - | - | 246 |
| Amortisation | 877 | 73 | 99 | - | 1,049 |
| Reconciliation of underlying operating result | |||||
| Underlying operating result (*) | 5,806 | 363 | 2,521 | (6,040) | 2,650 |
| Separately disclosed items | (21,714) | (3,823) | (218) | (2,133) | (27,888) |
| Operating (loss)/profit | (15,908) | (3,460) | 2,303 | (8,173) | (25,238) |
(*) Underlying operating result is continuing operations' operating profit before separately disclosed items
4. Operating loss
The following items have been included in arriving at the operating loss for continuing operations:
| 2025 £000 |
2024 £000 |
|
| Depreciation of property, plant and equipment under right-of-use assets | 2,066 | 1,532 |
| Depreciation and impairment of tangible assets | 1,521 | 1,788 |
| Amortisation of intangible assets - website | 678 | 241 |
| Amortisation of intangible assets - customer relationships and brands | 655 | 820 |
| Impairment of intangible assets | - | 284 |
| Impairment of goodwill | - | 25,070 |
| Impairment of fixed assets | 429 | - |
| Impairment of right of use assets | 1,318 | 81 |
| Impairment loss/(gain) on trade receivables | (73) | 10 |
| Profit on foreign currency transactions | (170) | (151) |
| Repairs and maintenance expenditure on plant and equipment | 191 | 16 |
5. Earnings per share
Basic earnings per share is calculated by dividing the earnings attributable to ordinary Shareholders by the weighted average number of ordinary shares during the year.
For diluted earnings per share the weighted average number of ordinary shares in issue is adjusted to assume conversion of all dilutive potential ordinary shares. The dilutive shares are those share options granted to employees where the exercise price is less than the average market price of the Company's ordinary shares during the year. For diluted loss per share the weighted average number of ordinary shares in issue is not adjusted since its impact would be anti-dilutive.
| Year ended 31 December 2025 | Year ended 31 December 2024 | |||||
| Loss after tax £000 |
Weighted average number of shares | Loss per share Pence |
Loss after tax £000 |
Weighted average number of shares | Earnings per share Pence |
|
| Basic and diluted earnings per share | ||||||
| Continuing operations | (3,318) | 63,275 | (5.24p) | (26,406) | 62,526 | (42.23p) |
6. Net cash from operating activities
| 2025 £000 |
2024 £000 |
|
| Reconciliation of (loss)/profit before taxation to net cash flows from operations | ||
| Loss from continuing operations before tax | (2,952) | (27,077) |
| Depreciation and impairment of property, plant and equipment | 1,521 | 1,537 |
| Depreciation on right of use assets (IFRS 16) | 2,066 | 1,526 |
| Impairment of right of use assets (IFRS 16) | 1,318 | 82 |
| Write off of right of use liability (IFRS 16) | (29) | - |
| Finance costs | 1,961 | 1,839 |
| Loss on sale of plant and equipment | (6) | - |
| Amortisation of intangible assets | 1,329 | 1,289 |
| Impairment of fixed assets | 429 | 246 |
| Impairment of Intangible asset | - | 284 |
| Negative goodwill | (170) | (2,205) |
| Impairment of goodwill | - | 25,070 |
| Cash settled share options | - | (45) |
| Equity settled share-based payment charge | 531 | 729 |
| Exchange differences on non-cash balances | 120 | (128) |
| Operating cash inflow before changes in working capital and provisions | 6,118 | 3,147 |
| Change in trade and other receivables | (3,617) | 3,310 |
| Change in stocks | 769 | 4,864 |
| Change in trade and other payables | 5,058 | (1,562) |
| Change in provisions | (129) | (239) |
| Cash generated from operations | 8,199 | 9,520 |
| Tax paid | (419) | (814) |
| Net cash generated from operating activities | 7,780 | 8,706 |
7. Acquisitions & Disposals
Allswage Limited
In March 2025, the Group acquired the Trade and assets of Allswage Limited, a UK based supplier of pneumatics and hydraulics that were in administration. The total consideration was £50,000. The value of assets and liabilities recognised as on acquisition are as follows:
| Fair Value £000 |
|
| Inventories | 197 |
| Intangible assets | 177 |
| Other Payables | (147) |
| Total | 227 |
| Amount settled in cash | (50) |
| Less assets acquired | 227 |
| Negative Goodwill on acquisition | 177 |
Fair values
The fair values included in the table above are provisional and subject to management estimations at the reporting date.
Intangible assets
The intangible assets recognised within the Group relate to the Allswage Brand at £22,000 and the Customer list at £154,000.
Allswage's contribution to Group results
The Allswage branch generated sales of £1,816,000 and an underlying profit before tax of £222,000; after accounting for £28,000 amortisation of acquired intangibles and £111,000 of central recharges the actual result is a profit before tax of £69,000 between the 11 March 2025 and 31 December 2025. The central recharge cost is calculated as a proportion of total central costs; there has not been any incremental increase in central costs as a result of the acquisition.
Thomas Group Limited
In May 2025, the Group acquired the Trade and assets of Thomas Group Limited, a UK based service provider and global distributor of branded engine, filtration and fuel-technology products. The total consideration was £50,000. The value of assets and liabilities recognised as on acquisition are as follows:
| Fair Value £000 |
|
| Trade Debtors | 188 |
| Inventories | 259 |
| Intangible assets | 130 |
| Fixed assets | 127 |
| Prepayments | 11 |
| Trade Creditors | (304) |
| Other Payables | (72) |
| Borrowings | (310) |
| Total | 21 |
| Amount settled in cash | 50 |
| Less assets acquired | 29 |
| Goodwill written off through P&L | (29) |
Fair values
The fair values included in the table above are provisional and subject to management estimations at the reporting date.
Intangible assets
The intangible assets recognised within the Group relate to the Thomas Group Brand at £16,000 and the Customer list at £114,000.
Thomas Group's contribution to Group results
The Thomas Group branch generated sales of £1,158,000 and an underlying loss before tax of £92,000; after accounting for £16,000 amortisation of acquired intangibles, £12,000 of costs associated with the acquisition and £138,000 of central recharges the actual result is a loss before tax of £269,000 between the 1 May 2025 and 31 December 2025. The central recharge cost is calculated as a proportion of total central costs; there has not been any incremental increase in central costs as a result of the acquisition.
Subsequent events
On 12 February 2026 the Group completed the acquisition of 100% of the issued share capital of Q-Plus B.V. and its subsidiaries, a Netherlands-based distributor and service provider of pneumatic and compressed air solutions.
The total consideration of €5.9 million comprises €4.1 million cash, a €1.25 million vendor loan and contingent consideration of up to €0.5 million, together with the repayment of approximately €2.0 million of intercompany debt on completion. The cash element was funded from the Group's equity placing and retail offer completed in February 2026. Net of related costs the Group raised c.£9.0 million as a result of the equity placing. The excess proceeds will be used to pay down the Group debt.
8. Goodwill
| 2025 £000 |
2024 £000 |
|
| Cost | ||
| Balance at 1 January | 63,164 | 63,164 |
| Balance at 31 December | 63,164 | 63,164 |
| Impairment | ||
| At 1 January | 48,168 | 23,098 |
| Impairment charge | - | 25,070 |
| At 31 December | 48,168 | 48,168 |
| Carrying amount at 31 December | 14,996 | 14,996 |
DEFINITIONS
The Group uses a number of alternative performance measures ("APMs") in addition to those measures reported in accordance with IFRS. The APMs are useful to assess the underlying performance of the Group by excluding any one-off, non-operating and non-cash items. Items excluded in this way are grouped under separately disclosed items on the face of the income statement. In doing so, the APMs provide comparability and consistency of trading performance between periods.
The APMs are used to manage and budget for the Group's performance, and for determining the performance rewards for Executive Directors and that of other management throughout the business. The APMs are also used in presentations to investors to communicate the underlying performance of the Group.
The APMs are described in detail and reconciled to IFRS measures in the table below; further details will be contained in the notes accompanying the 2025 Annual Report and Financial Statements to be published shortly.
Underlying Operating Profit
Underlying Operating Profit is the measure used by the Directors to assess trading performance of the Group. In the context of presenting the performance of the Group's segments, this measure is referred to as Underlying segment result or underlying operating result, as appropriate. The reconciliation of this APM to the Operating profit in the Consolidated income statement is shown below:
| 2025 £000 |
2024 £000 |
|
| Underlying operating profit (result) | 3,643 | 2,650 |
| Less Separately disclosed items: | ||
| - Acquisition costs | (225) | (41) |
| - Amortisation of acquired intangibles | (655) | (820) |
| - Accelerated depreciation of old website | (197) | (241) |
| - Impairment of fixed assets | (429) | (246) |
| - Impairment of goodwill | - | (25,070) |
| -Impairment of intangible asset | - | (284) |
| - Impairment of leased assets | (1,318) | (81) |
| - Share-based payment costs | (531) | (729) |
| - Write off lease liability | 24 | - |
| '- Negative goodwill | 170 | 2,205 |
| - Restructuring | (1,477) | (2,581) |
| Operating loss | (991) | (25,238) |
Underlying EBITDA
Underlying EBITDA is another measure used by the Directors to assess trading performance of the Group.
The below reconciliation reconciles to Underlying Operating profit:
| 2025 £000 |
2024 £000 |
|
| Underlying EBITDA (result) | 7,711 | 5,941 |
| Less Depreciation and Amortisation | ||
| - Amortisation of new website | (481) | (228) |
| - Depreciation of fixed assets | (1,521) | (1,537) |
| - Depreciation of ROU Assets | (2,066) | (1,526) |
| (4,068) | (3,291) | |
| Underlying Operating profit | 3,633 | 2,650 |
Underlying operating overheads
Underlying operating overheads is total of distribution costs and administrative costs before separately disclosed items. The APM has been introduced this year to spotlight the management of overheads attributable to "business as usual" trading activity in the current inflationary environment.
| Lines in Income statement | 2025 £000 |
2024 £000 |
| Administrative expenses before separately disclosed items | 37,867 | 34,196 |
| Distribution expenses | 4,360 | 4,169 |
| Total | 42,227 | 38,365 |
Net Debt
Net Debt is Bank Debt less the value of cash and cash equivalents. It excludes lease liabilities under IFRS 16. Bank Debt is the value of Barclays RCF facility of £20m and any utilised value of £5m overdraft facility, less any unamortised value of loan arrangement fee.
Net Debt is a key APM used by the Directors to monitor the indebtedness of the Group.
| 2025 £000 |
2024 £000 |
|
| Cash and Cash equivalents | 4,734 | 1,839 |
| Interest bearing borrowings | (19,972) | (16,913) |
| Net Debt | (15,238) | (15,074) |
Working Capital
Working Capital is inventories, trade and other receivables and prepayments less trade and other payables. The APM is used to monitor the working capital levels across the Group, with a view to manage the indebtedness of the Group within the desired levels. The calculation for Working Capital is shown below.
| 2025 £000 |
2024 £000 |
|
| Inventories | 29,156 | 29,263 |
| Trade and other receivables | 25,809 | 22,740 |
| Prepayments | 1,587 | 1,053 |
| Trade and other payables | (26,583) | (20,866) |
| Working capital | 29,969 | 32,190 |
FORWARD-LOOKING STATEMENTS
This document contains certain forward-looking statements which reflect the knowledge and information available to the Company during the preparation and up to the publication of this document. By their very nature, these statements depend upon circumstances and relate to events that may occur in the future thereby involving a degree of uncertainty. Therefore, nothing in this document should be construed as a profit forecast by the Company.
The information contained within this announcement is deemed by the Company to constitute inside information stipulated under the Market Abuse Regulation (EU) No. 596/2014 as it forms part of UK domestic law by virtue of the European Union (Withdrawal) Act 2018. Upon the publication of this announcement via the Regulatory Information Service, this inside information is now considered to be in the public domain.
| FURTHER ENQUIRIES TO: |
| Flowtech Fluidpower plc Mike England, Chief Executive Officer Russell Cash, Chief Financial Officer & Company Secretary Tel: +44 (0) 1695 52759 Email: [email protected] |
| Panmure Liberum (Nominated Adviser and Joint Broker) Nicholas How, Managing Director, Investment Banking William King, Assistant Director, Investment Banking Tel: +44 (0) 20 3100 2000 |
| Singer Capital Markets (Joint Broker) Sara Hale, Head of Investment Banking James Todd, Associate, Investment Banking Tel: +44 (0) 207 496 3000 |
| TooleyStreet Communications (IR and media relations) Fiona Tooley Tel: +44 (0) 7785 703523 or Email: [email protected] |
This information is provided by RNS, the news service of the London Stock Exchange. RNS is approved by the Financial Conduct Authority to act as a Primary Information Provider in the United Kingdom. Terms and conditions relating to the use and distribution of this information may apply. For further information, please contact [email protected] or visit www.rns.com.
RNS may use your IP address to confirm compliance with the terms and conditions, to analyse how you engage with the information contained in this communication, and to share such analysis on an anonymised basis with others as part of our commercial services. For further information about how RNS and the London Stock Exchange use the personal data you provide us, please see our Privacy Policy.
END
PREPPUQPWUPQPWW