AI Terminal
EURASIA MINING PLC
Interim / Quarterly Report • Sep 30, 2025
7631_rns_2025-09-30_b90e9d60-220c-4cc9-a91f-6cc65cd74951.html
Interim / Quarterly Report
Open in ViewerOpens in native device viewer
National Storage Mechanism | Additional information 
RNS Number : 2922B
Eurasia Mining PLC
30 September 2025
THIS ANNOUNCEMENT CONTAINS INSIDE INFORMATION AS DEFINED IN REGULATION NO. 596/2014 (AS IT FORMS PART OF RETAINED EU LAW AS DEFINED IN THE EUROPEAN UNION (WITHDRAWAL) ACT 2018) AND IS IN ACCORDANCE WITH THE COMPANY'S OBLIGATIONS UNDER ARTICLE 7 OF THAT REGULATION.
30 September 2025
Eurasia Mining plc
("Eurasia" or the "Company")
Interim Results for the six months ended 30 June 2025
EXECUTIVE CHAIRMAN STATEMENT
Dear Shareholder,
It gives me great pleasure to summarise our progress for you as the first half of 2025 saw major improvements to our assets. West Kytlim mine is now in a position to significantly step up its precious metals production, while our NKT licence has been extended to allow time to apply for a production permit. A summary of both projects follows.
As announced in our 2024 annual report in the financial statements, the top-line of the P&L of the Company more than tripled (3.3X) in comparison to the previous year, setting a new historical high. However, due to the FOREX fluctuations of the intercompany loans during 2024, the bottom-line was negative despite the profitability of Eurasia's subsidiary's Kosvinsky Kamen (KK), the owner of the West Kytlim mine. These FOREX paper losses were reversed in 1H2025, that results in the Group's £6.4m profit before tax, setting a new record and a milestone for Eurasia.
URALS PRODUCTION CLUSTER
As previously announced, six wholly-owned enrichment plants have been successfully launched to full commercial scale production, representing a doubling of the previously installed enrichment capacity and six times the average enrichment capacity utilised over the past two years.
A fleet of seven heavy 39-ton Chinese FAW trucks has been added to scale up both stripping and mining capacity. All seven trucks are in operation, making the total truck capacity two to three times the capacity of KAMAZ trucks used previously and with improved production logistics, a net 20x improvement. This is primarily due to significantly shorter transportation distances to optimised locations of the six enrichment plants relative to the mining blocks.
Three heavy Chinese Lonking excavators with increased shovel capacity have been acquired. These excavators, together with the electric dragline launched in 2023 (which has a 4.2 million m3 of annual installed capacity) and fully refurbished over 2024-2025 with new engine, shovel, and ancillaries), have doubled the previously installed excavation capacity in terms of the total shovel size. This capacity is already significantly adding to both stripping and mining volumes.
A South Korean Shantui heavy bulldozer was also acquired to further increase the stripping capacity and production volumes in 2025. This has allowed one of the smaller bulldozers to be allocated to road repairs, resulting in higher productivity of the trucks with lower diesel consumption.
In total, six enrichment plants (plus enrichment workshop/laboratory), 15 excavators, seven bulldozers and 18 dump trucks are being utilised in 2025.
As a result, record setting volumes were achieved as announced via RNS on 28 July 2025. These volume increases represent completion of a step-change milestone to achieve the long-term annual target of 64Koz of precious metals over the projected 20-year life of mine (please refer to RNS published on 1 July 2020).
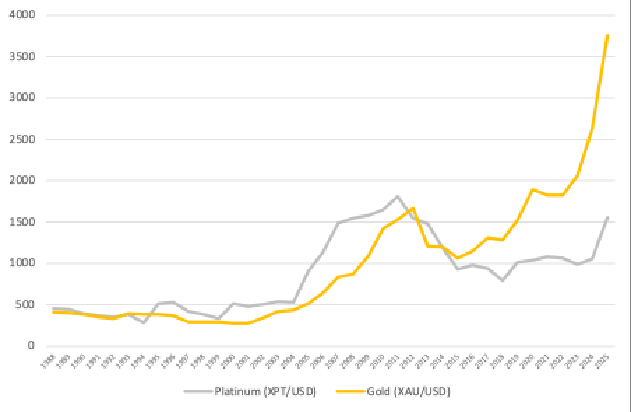
Platinum market is now in deficit for the fifth consecutive year [1] , particularly in 2023-2025
2023: The platinum market experienced a significant deficit of approximately 600-900 koz; average price was about $965/oz amid stock depletion and subdued movements [2] .
2024: Deficits deepened to 700-1,000 koz (significant relative to global mining of 4.5 moz) with demand rising; prices remained rangebound at $900-1,000/oz on average (~$954/oz), influenced by further stock depletion despite supply constraints2.
2025 (YTD): Ongoing deficits of 700-1,000 koz projected, with declining supply; prices broke a multi-year slump, surging ~40% in 1H2025 to above $1,400/oz due to tightening supply and strong investment demand [3] . On 26 September 2026 it reached $1564/oz.
Outlook: Structural deficits are likely to persist into 2026 and beyond, supporting price upside [4] . Also, due to scarcity of platinum (4.5 moz annual mining relative to 87.5 moz of gold mining) the platinum price had been consistently outperforming the gold price until 2015, when the gold price broke out. The platinum price has been catching up recently surging circa 40% in 1H2025, but still has significant potential upside relative to the gold price. Please refer to the chart below:
ARCTIC FIRST MOVER CLUSTER
With its Kola brownfield restart assets Eurasia is well established in the Arctic, where the Company has the first mover advantage and a competitive edge with the existing infrastructure of the formerly producing NKT mine. The Arctic has been announced as a priority area for co-operation between the United States and Russia, boosted by the recent Pursuing Peace Summit held in Alaska.
NKT is Tier-1 scale mine (that used to be in production) that contains 305Kt of Nickel, 143Kt of Copper, 57 tons of platinum group metals ("PGM") and Gold as confirmed in the Competent Person Report (the "CPR") by Wardell Armstrong International ("WAI") in 2021.
As announced via RNS on 27 August 2025, Eurasia's Arctic subsidiary Terskaya Mining Company (TMC) completed additional drilling of 16,417 meters with 9,224 samples being tested by SGS and Alex Stewart International for primary and secondary controls of the PGM assays on the historical drill core and the trenches by Severonickel / Norilsk Nickel.
This will allow an upgrade from resources to reserves under the JORC Code as well as the state standards and allow the application for a production permit at NKT.
In recognition of significant work done by TMC in accordance with the licence agreement, the existing NKT licence of TMC that was supposed to expire on 20 August 2025 was extended by the relevant authorities to 20 August 2027 to allow more than sufficient time to smoothly transition to the production permit. The Directors are looking forward to making further updates on the exciting developments of Eurasia's Kola company making brownfield restart assets.
MARKETING
The Company achieved its goal of a secondary listing on the Astana International Exchange (AIX) in Kazakhstan. A broker note was produced in the local language for this market. Further research is expected in the coming several weeks.
THE FUTURE
As you can see, your Company has successfully managed to secure its assets and enhance them. With these new milestones as described, additional value has been created to further increase our chances of successful completion of the sale process. We will continue to work on achieving liquidity events for all shareholders.
Christian Schaffalitzky
Executive Chairman
Condensed consolidated statement of comprehensive income
for the six months ended 30 June 202 5
| Note | 6 months to | 12 months to | 6 months to | |
| 30 June | 31 December | 30 June | ||
| 202 5 | 202 4 | 202 4 | ||
| (unaudited) | (audited) | (unaudited) | ||
| £ | £ | £ | ||
| Sales | 4 | - | 6,636,001 | - |
| Cost of sales | - | (6,701,131) | - | |
| Gross profit | (65,130) | - | ||
| Administrative costs | (1,220,285) | (2,055,218) | (885,970) | |
| Investment income | 186,702 | 3,232 | 2,958 | |
| Finance costs | (280,093) | (144,695) | (49,145) | |
| Other gains | 5 | 7,868,944 | - | 1,230,703 |
| Other losses | 5 | (135,190) | (6,385,687) | (870,249) |
| Profit/(loss) before tax | 6,420,078 | (8,647,498) | (571,703) | |
| Income tax expense | (1,242) | (347) | - | |
| Profit/(loss) for the period | 6,418,836 | (8,647,845) | (571,703) | |
| Other comprehensive (loss)/income: | ||||
| Items that will not be reclassified subsequently to profit and loss: |
||||
| NCI share of foreign exchange differences on translation of foreign operations | (1,159,340) | 901,049 | (134,419) | |
| Items that will be reclassified subsequently to profit and loss: |
||||
| Parents share of foreign exchange differences on translation of foreign operations |
(2,750,579) | 2,319,969 | (264,735) | |
| Other comprehensive (loss)/income for the period, net of tax | (3,909,919) | 3,221,018 | 1,351,389 | |
| Total comprehensive income/(loss) for the period | 2,508,917 | (5,426,827) | (970,857) | |
| Profit/(loss) for the period attributable to: | ||||
| Equity holders of the parent | 4,561,693 | (6,552,157) | (553,519) | |
| Non-controlling interest | 1,857,143 | (2,095,688) | (18,184) | |
| 6,418,836 | (8,647,845) | (571,703) | ||
| Total comprehensive income/(loss) for the period attributable to: | ||||
| Equity holders of the parent | 1,811,114 | (4,232,188) | (818,254) | |
| Non-controlling interest | 697,803 | (1,194,639) | (152,603) | |
| 2,508,917 | (5,426,827) | (970,857) | ||
| Basic and diluted loss (pence per share) | 0.16 | (0.23) | (0.02) |
Condensed consolidated statement of financial position
As at 30 June 202 5
| Note | At 30 June 202 5 |
At 31 December 202 4 |
At 30 June 202 4 | |
| (unaudited) | (audited) | (unaudited) | ||
| £ | £ | £ | ||
| ASSETS | ||||
| Non-current assets | ||||
| Property, plant and equipment | 6 | 10,399,446 | 6,928,215 | 9,473,508 |
| Assets in the course of construction | 392,213 | 161,131 | 518,150 | |
| Intangible assets | 7 | 3,668,526 | 2,761,023 | 3,436,107 |
| Investment in financial assets | - | - | ||
| Total non-current assets | 9,850,369 | 13,427,765 | ||
| Current assets | ||||
| Inventories | 2,581,413 | 322,597 | 4,127,939 | |
| Trade and other receivables | 8 | 927,048 | 1,482,947 | 1,271,268 |
| Other financial assets | 428,030 | 30,561 | 67,304 | |
| Current tax assets | 4,243 | 3,019 | 4,661 | |
| Cash and bank balances | 1,872,447 | 3,682,292 | 215,922 | |
| Total current assets | 5,813,181 | 5,521,416 | 5,687,094 | |
| Total assets | 20,273,366 | 15,371,785 | 19,114,859 | |
| EQUITY | ||||
| Capital and reserves | ||||
| Issued capital | 9 | 64,477,397 | 61,575,811 | 61,233,311 |
| Reserves | 10 | 4,118,260 | 6,868,839 | 4,284,135 |
| Accumulated losses | (46,048,020) | (50,609,713) | (44,611,075) | |
| Equity attributable to equity holders of the parent | 22,547,638 | 17,834,937 | 20,906,371 | |
| Non-controlling interest | (4,564,280) | (5,262,083) | (4,220,047) | |
| Total equity | 17,983,358 | 12,572,854 | 16,686,324 | |
| LIABILITIES | ||||
| Non-current liabilities | ||||
| Lease liabilities | 12 | - | - | 6,142 |
| Provisions | 14 | 386,191 | 250,695 | 389,325 |
| Total non-current liabilities | 386,191 | 250,695 | 395,467 | |
| Current liabilities | ||||
| Borrowings | 11 | 642,741 | 262,706 | 50,713 |
| Lease liabilities | 12 | 208,014 | 26,105 | 113,324 |
| Trade and other payables | 13 | 831,501 | 2,101,359 | 1,843,351 |
| Current tax liabilities | 906 | 221 | - | |
| Provisions | 14 | 220,655 | 157,845 | 25,680 |
| Total current liabilities | 1,903,81 7 | 2,548,236 | 2,033,068 | |
| Total liabilities | 2,290,00 8 | 2,798,931 | 2,428,535 | |
| Total equity and liabilities | 20,273,366 | 15,371,785 | 19,114,859 |
Condensed statement of changes in equity
For the six months ended 30 June 202 5 (unaudited)
| Attributable to owners of the parent | ||||||||||
| Note | Share capital |
Share premium | Deferred shares | Other reserves | Foreign currency translation reserve | Accumulated losses | Total attributable to owners of parent | Non-controlling interest | Total equity | |
| £ | £ | £ | £ | £ | £ | £ | £ | £ | ||
| Balance at 1 January 2025 | 2,879,382 | 51,670,946 | 7,025,483 | 3,539,906 | 3,328,933 | (50,609,713) | 17,834,937 | (5,262,083) | 12,572,854 | |
| Issue of shares | 72,033 | 2,829,554 | 2,901,587 | 2,901,587 | ||||||
| Transaction with owners | ||||||||||
| Loss for the period | 4,561,693 | 4,561,693 | 1,857,143 | 6,418,836 | ||||||
| Other comprehensive loss | ||||||||||
| Exchange differences on translation of foreign operations |
(2,750,579) | (2,750,579) | (1,159,340) | (3,909,919) | ||||||
| Total comprehensive income | (2,750,579) | 4,561,693 | 1,811,114 | 697,803 | 2,508,917 | |||||
| Balance at 30 June 202 5 | 2,951,415 | 54,500,500 | 7,025,483 | 3,539,906 | 578,354 | (46,048,020) | 22,547,638 | (4,564,280) | 17,983,358 |
Condensed statement of changes in equity
For the six months ended 30 June 2024 (unaudited)
| Attributable to owners of the parent | ||||||||||
| Note | Share capital |
Share premium | Deferred shares | Other reserves | Foreign currency translation reserve | Accumulated losses | Total attributable to owners of parent | Non-controlling interest | Total equity | |
| £ | £ | £ | £ | £ | £ | £ | £ | £ | ||
| Balance at 1 January 2024 | 2,864,560 | 51,343,268 | 7,025,483 | 3,539,906 | 1,008,964 | (44,057,556) | 21,724,625 | (4,067,444) | 17,657,181 | |
| Transaction with owners | - | - | - | - | - | - | - | - | - | |
| Loss for the period | - | - | - | - | - | (494,924) | (494,924) | (3,535) | (498,459) | |
| Other comprehensive loss | ||||||||||
| Exchange differences on translation of foreign operations |
- | - | - | - | (323,330) | - | (323,330) | (149,068) | (472,398) | |
| Total comprehensive income | - | - | - | - | (323,330) | (494,924) | (818,254) | (152,603) | (970,857) | |
| Balance at 30 June 2024 | 2,864,560 | 51,343,268 | 7,025,483 | 3,539,906 | 685,634 | (44,552,480) | 20,906,371 | (4,220,047) | 16,686,324 |
Condensed consolidated statement of cash flows
for the six months ended 30 June 202 5
| 6 months to 30 June | 12 months to 31 December | 6 months to 30 June | ||
| 202 5 | 202 4 | 202 4 | ||
| (unaudited) | (audited) | (unaudited) | ||
| £ | £ | £ | ||
| Cash flows from operating activities | ||||
| Loss for the period | 6,418,836 | (8,647,845) | (571,703) | |
| Adjustments for: | ||||
| Depreciation and amortisation of non-current assets | 254,591 | 2,983,691 | 1,929,115 | |
| Finance costs recognised in profit or loss | 280,093 | 144,695 | 49,145 | |
| Investment revenue recognised in profit or loss | (186,702) | (3,232) | (2,958) | |
| (Gain)/loss on disposal of investments | - | - | ||
| Impairment loss/(reversal) recognised on inventory | 135,190 | - | 870,249 | |
| Rehabilitation cost recognised in profit or loss | 2 7 , 960 | 40,374 | (33,709) | |
| Income tax expense recognised in profit or loss | 1,242 | 347 | - | |
| Net foreign exchange (profit)/loss | (7,868,944) | 6,385,687 | (1,230,703) | |
| (937,734) | 903,717 | 1,009,436 | ||
| Movements in working capital | ||||
| (Increase)/decrease in inventories | (2,474,638) | 1,521,567 | (2,582,503) | |
| Decrease/(increase) in trade and other receivables | 295,948 | (2,328) | 526,726 | |
| (Decrease)/increase in trade and other payables | (849,748) | 1,523,743 | 913,478 | |
| Cash (used in)/generated by operations | (3,966,172) | 3,946,699 | (132,863) | |
| Income taxes paid | (2,536) | 1,410 | 1,334 | |
| Net cash (used in)/generated by operating activities | (3,968,708) | 3,948,109 | (131,529) | |
| Cash flows from investing activities | ||||
| Payments for bank trust agreement | (200,557) | - | - | |
| Interest received | - | 2,276 | - | |
| Proceeds from repayment of non-related party loans | - | 25,294 | - | |
| Payments for property, plant and equipment | (1,168,297) | (1,522,327) | (887,525) | |
| Payments for other intangible assets | (96,061) | (221,409) | (135,366) | |
| Net cash (used in)/generated by investing activities | (1,464,915) | (1,716,166) | (1,022,891) | |
| Cash flows from financing activities | ||||
| Proceeds from issues of equity shares | 2,901,587 | - | - | |
| Proceeds from issue of convertible loan notes | - | 342,500 | ||
| Proceeds from borrowings | 329,000 | 506,883 | - | |
| Repayment of short-term loan | (230,482) | (300,151) | ||
| Repayment of lease liability | (566,338) | (125,962) | (49,631) | |
| Interest paid | (18,878) | (29,096) | (12,825) | |
| Net cash used in financing activities | 2,414,888 | 394,174 | (62,456) | |
| Net (decrease)/increase in cash and cash equivalents | (3,018,734) | 2,626,116 | (1,216,876) | |
| Effects of exchange rate changes on the balance of cash held in foreign currencies |
1,208,889 | (261,889) | 114,733 | |
| Cash and cash equivalents at the beginning of period | 3,682,292 | 1,318,065 | 1,318,065 | |
| Cash and cash equivalents at the end of the period | 1,872,447 | 3,682,292 | 215,922 |
Selected notes to the condensed consolidated financial statements
for the six months ended 30 June 202 5
1. General information
Eurasia Mining plc (the "Company") is a public limited company incorporated and domiciled in Great Britain with its registered office at International House, 42 Cromwell Road, London SW7 4EF, United Kingdom and principal place of business at Clubhouse Bank, 1 Angel Court, EC2R 7HJ. The Company's shares are listed on AIM, a market of the London Stock Exchange. The principal activities of the Company and its subsidiaries (the "Group") are related to the exploration for and development of platinum group metals, gold and other minerals.
The financial information set out in these condensed interim consolidated financial statements (the "Interim Financial Statements") do not constitute statutory accounts as defined in Section 435 of the Companies Act 2006. The Group's statutory financial statements for the year ended 31 December 2024, prepared in accordance with UK-adopted International Accounting Standards, have been filed with the Registrar of Companies. The auditor's report on those financial statements was unqualified. The report did not contain a statement under Section 498(2) of the Companies Act 2006.
2. Basis of preparation
The Group prepares consolidated financial statements in accordance with UK-adopted International Accounting Standards in conformity with the requirements of the Companies Act 2006. These condensed consolidated interim financial statements for the period ended 30 June 2025 have been prepared by applying the recognition and measurement provisions of the standards and the accounting policies adopted in the audited accounts for the year ended 31 December 202 4 .
These Interim Financial Statements have been prepared under the historical cost convention.
The accounting policies have been applied consistently throughout the Group for the purposes of preparation of these condensed consolidated interim financial statements.
The Interim Financial Statements are presented in Pounds Sterling (£), which is also the functional currency of the parent company.
3. Accounting policies
The Interim Financial Statements have been prepared in accordance with the accounting policies adopted in the Group's last annual financial statements for the year ended 31 December 202 4 .
4. Revenue
| 6 months to | 12 months to | 6 months to | ||
| 30 June | 31 December | 30 June | ||
| 202 5 | 202 4 | 202 4 | ||
| £ | £ | £ | ||
| Sale of concentrates containing platinum and other metals | - | 6,636,001 | - | |
| - | 6,636,001 | - |
Selected notes to the consolidated financial statements
for the six months ended 30 June 202 5 (continued)
5. Other gains and losses
| 6 months to | 12 months to | 6 months to | ||
| 30 June | 31 December | 30 June | ||
| 202 5 | 202 4 | 202 4 | ||
| £ | £ | £ | ||
| Gains | ||||
| Net foreign exchange gain | 7,868,944 | - | 1,230,703 | |
| - | 1,230,703 | |||
| Losses | ||||
| Loss on revaluation of stock to net realisable value | (135,190) | - | (870,249) | |
| Net foreign exchange loss | - | (6,385,687) | - | |
| 7,733,754 | (6,385,687) | (870,249) | ||
| 7,733,754 | (6,385,687) | 360,454 |
The majority of the foreign exchange gains and losses are a result of the revaluation of monetary assets and liabilities in the subsidiary accounts as a result of movements in the Rouble exchange rates.
Loss on revaluation of stock available at 30 June 202 5 represents platinum concentrate ready for sale or refining, which was valued (i) using methodology set in the refining and sale and purchase agreement made with local refinery and (ii) exchange rate and metal prices at 30 June 202 5 .
6. Property, plant and equipment
| 30 June | 31 December | 30 June | ||
| 202 5 | 2024 | 202 4 | ||
| £ | £ | £ | ||
| Net book value at the beginning of period | 6,928,215 | 10,210,983 | 10,210,983 | |
| Additions | 910,049 | 1,310,899 | 719,325 | |
| Transferred from assets under construction | 809,957 | 319,213 | 2,305 | |
| Depreciation | (254,591) | (2,983,691) | (1,929,115) | |
| Exchange differences | 2,005,816 | (1,929,189) | 470,010 | |
| Net book value at the end of period | 10,399,446 | 6,928,215 | 9,473,508 |
Selected notes to the consolidated financial statements
for the six months ended 30 June 202 5 (continued)
7. Intangible assets
| 30 June | 31 December | 30 June | ||
| 202 5 | 202 4 | 202 4 | ||
| £ | £ | £ | ||
| Net book value at the beginning of period | 2,761,023 | 3,148,382 | 3,148,382 | |
| Additions | 96,061 | 221,409 | 135,366 | |
| Exchange differences | 811,442 | (608,768) | 152,359 | |
| Net book value at the end of period | 3,668,526 | 2,761,023 | 3,436,107 |
Intangible assets represent capitalised costs associated with Group's exploration, evaluation and development of mineral resources.
8. Trade and other receivables
| 30 June | 31 December | 30 June | ||
| 202 5 | 202 4 | 202 4 | ||
| Trade receivables | - | 948,766 | - | |
| Advances made | 136,946 | - | 17,271 | |
| Prepayments | 12,235 | 16,077 | 24,730 | |
| VAT recoverable | 531,186 | 445,525 | 521,875 | |
| Mining tax refund due | - | - | 408,462 | |
| Other receivables | 246,681 | 72,579 | 298,930 | |
| 927,048 | 1,482,947 | 1,271,268 |
The fair value of trade and other receivables is not materially different to the carrying values presented. None of the receivables are provided as security or past due.
Selected notes to the consolidated financial statements
for the six months ended 30 June 202 5 (continued)
9. Share capital
| 30 June | 31 December | 30 June | ||
| 202 5 | 202 4 | 202 4 | ||
| Issued ordinary shares with a nominal value of 0.1p: | ||||
| Number | 2,951,414,924 | 2,879,381,734 | 2,864,559,995 | |
| Nominal value (£) | 2,951,415 | 2,879,382 | 2,864,560 | |
| Fully paid ordinary shares carry one vote per share and carry the right to dividends. | ||||
| Issued deferred shares with a nominal value of 4.9 p: | ||||
| Number | 143,377,203 | 143,377,203 | 143,377,203 | |
| Nominal value (£) | 7,025,483 | 7,025,483 | 7,025,483 |
Deferred shares have the following rights and restrictions attached to them:
- they do not entitle the holders to receive any dividends and distributions;
- they do not entitle the holders to receive notice or to attend or vote at General Meetings of the Company;
- on return of capital on a winding up the holders of the deferred shares are only entitled to receive the amount paid up on such shares after the holders of the ordinary shares have received the sum of 0.1p for each ordinary share held by them and do not have any other right to participate in the assets of the Company.
There had been no change in the issued share capital during the reporting period
| Ordinary shares | Number of shares | Share capital |
Share premium |
|
| £ | £ | |||
| Balance at 1 January 2025 | 2,879,381,734 | 2,879,382 | 51,670,946 | |
| Balance at 30 June 2025 | 2,951,414,924 | 2,951,415 | 54,500,499 | |
| Deferred shares | Number of deferred shares | Deferred share capital |
||
| £ | ||||
| Balance at 1 January and 30 June 2025 | 143,377,203 | 7,025,483 |
10. Reserves
| 30June | 31December | 30June | ||
| 2025 | 2024 | 2024 | ||
| £ | £ | £ | ||
| Capital redemption reserve | 3,539,906 | 3,539,906 | 3,539,906 | |
| Foreign currency translation reserve | 578,354 | 3,328,933 | 744,229 | |
| Equity-based payment reserve | - | - | ||
| 4,118,260 | 6,868,839 | 4,284,135 |
The capital redemption reserve was created as a result of a share capital restructuring in earlier years. There is no policy of regular transactions affecting the capital redemption reserve.
The foreign currency translation reserve represents exchange differences relating to the translation from the functional currencies of the Group's foreign subsidiaries into GBP.
The equity-based payments reserve represents a reserve arisen on (i) the grant of share options to employees under the employee share option plan and (ii) on issue of warrants under terms of professional service agreements.
Selected notes to the consolidated financial statements
for the six months ended 30 June 2025 (continued)
11. Borrowings
| 30 June | 31 December | 30 June | ||
| 2025 | 2024 | 2024 | ||
| £ | £ | £ | ||
| Current | ||||
| Unsecured loan | 642,741 | 262,706 | 50,713 | |
| 642,741 | 262,706 | 50,713 |
In 2024 the Company signed a convertible loan agreement with Sanderson Capital Partners Ltd to borrow up to GBP 2,500,000 ("Sanderson Facility"). As announced on 28 March 2025, Eurasia did a strategic private placing among US and UK institutional investors and ceased using Sanderson Facility.
12. Lease liabilities
The Group has the following leases in place:
i) Leases of mining equipment. The Group has an option to purchase the equipment for a nominal amount at the maturity of the finance lease. The Group's obligation under finance leases are secured by the lessor's title to the leased assets.
Interest rates underlying obligations under finance leases are fixed at respective contract dates ranging from 21.9% to 23.5% per annum. For comparison Russian central bank rate is 19% at the date of this report.
ii) Rent of offices and other properties. The average lease term is three years expiring in 2025. There is no option to purchase properties at the end of rental period.
| Minimum lease payments | 30 June | 31 December | 30 June | |
| 2025 | 2024 | 2024 | ||
| £ | £ | £ | ||
| Less than one year | 224,668 | 27,173 | 118,706 | |
| Between one and five years | - | - | 6,320 | |
| 27,173 | 125,026 | |||
| Less future finance charges | (16,654) | (1,068) | (5,560) | |
| Present value of minimum lease payments | 208,014 | 26,105 | 119,466 | |
| Present value of minimum lease payments | 30 June | 31 December | 30 June | |
| 2025 | 2024 | 2024 | ||
| £ | £ | £ | ||
| Less than one year | 208,014 | 26,105 | 113,324 | |
| Between one and five years | - | 6,142 | ||
| Present value of minimum lease payments | 208,014 | 26,105 | 119,466 |
Selected notes to the consolidated financial statements
for the six months ended 30 June 2025 (continued)
13. Trade and other payables
| 30 June | 31 December | 30 June | ||
| 2025 | 2024 | 2024 | ||
| Trade payables | 514,739 | 1,045,818 | 1,111,521 | |
| Accruals | 124,125 | 198,622 | 239,346 | |
| Social security and other taxes | 34,095 | 760,759 | 226,368 | |
| Other payables | 158,54 2 | 96,160 | 266,116 | |
| 831,50 1 | 2,101,359 | 1,843,351 |
The fair value of trade and other payables is not materially different to the carrying values presented. The above listed payables were all unsecured.
14. Provision
| 30 June | 31 December | 30 June | ||
| 2025 | 2024 | 2024 | ||
| £ | £ | £ | ||
| Long term provision: | ||||
| Environment rehabilitation | 386,191 | 250,695 | 389,325 | |
| Short term provision: | ||||
| Environment rehabilitation | 220,655 | 157,845 | 25,680 | |
| 606,846 | 408,54 0 | 415,005 | ||
| Movement in provision | Six month to | 12 month to | Six month to | |
| 30 June | 31 December | 30 June | ||
| 2025 | 2024 | 2024 | ||
| £ | £ | £ | ||
| At 1 January | 408,540 | 397,747 | 397,747 | |
| Utilised in the period | 26,695 | 40,374 | - | |
| Reduction resulting from re-measurement or settlement without cost | - | (33,709) | ||
| Unwinding of discount and effect of changes in the discount rate | 35,366 | 67,766 | 31,988 | |
| Exchange difference | 136,245 | (97,347) | 18,979 | |
| At the end of the period | 606,846 | 408,540 | 415,005 |
Provision is made for the cost of restoration and environmental rehabilitation of the land disturbed by the West Kytlim mining operations, based on the estimated future costs using information available at the reporting date.
The provision is discounted using a risk-free discount rate of from 1 2 . 99 % to 14. 99 % (202 4 : 14.66% to 16.67% ) depending on the commitment terms, attributed to the Russian Federal Bonds.
Provision is estimated based on the sub-areas within general West Kytlim mining licence the company has carried down its operations on by the end of the reporting period. Timing is stipulated by the forestry permits issued at the pre-mining stage for each of sub-areas. Actual costs in respect of the long-term provision recognised by 30 June 202 5 will be incurred within 2025-2040.
Selected notes to the consolidated financial statements
for the six months ended 30 June 2024 (continued)
15. Commitments
During 202 5 the Group entered into several lease agreements to lease mining plant and equipment. As at 30 June 202 5 the average lease term was one year.
During 2023 the Group entered into several rent agreements to rent office and other properties. As at 30 June 202 5 the average rental term was 6 months .
Present value of minimum lease payments £ 208 , 014 (30 June 202 4 : £119,466).
[1] Sources: Norilsk Nickel
[2] Sources: Johnson Matthey, WPIC, Macrotrends
[3] Sources: Johnson Matthey, WPIC, Macrotrends, IMPI
[4] Sources: Johnson Matthey, WPIC, Grand View Research
This information is provided by RNS, the news service of the London Stock Exchange. RNS is approved by the Financial Conduct Authority to act as a Primary Information Provider in the United Kingdom. Terms and conditions relating to the use and distribution of this information may apply. For further information, please contact [email protected] or visit www.rns.com.
RNS may use your IP address to confirm compliance with the terms and conditions, to analyse how you engage with the information contained in this communication, and to share such analysis on an anonymised basis with others as part of our commercial services. For further information about how RNS and the London Stock Exchange use the personal data you provide us, please see our Privacy Policy.
END
IR SEIFMUEISEIU