AI assistant
EDM Resources Inc. Audit Report / Information 2021
45546_rns_2021-05-06_ee18702c-495f-4155-9ddd-654063c8f621.pdf
Audit Report / Information
Open in viewerOpens in your device viewer
NI 43-101 TECHNICAL REPORT Gypsum Resource Estimation Update of the Mineral Resources at the Scotia Mine, Nova Scotia, Canada 45.0° North Latitude, 63.3° West Longitude
Completed for ScoZinc Limited Suite 1301, 1959 Upper Water Street Halifax, Nova Scotia

Qualified Person:
B3J 3N2
Patrick Hannon, M.A.Sc., P.Eng.

Effective date: 22 March 2021


| 1 | Summary | 20 | |
|---|---|---|---|
| 2 | Introduction and Terms of Reference | 30 | |
| 2.1 | Issuer30 | ||
| 2.2 | Terms of Reference30 | ||
| 2.3 | Purpose of Report30 | ||
| 2.4 | Basis of Technical Report30 | ||
| 2.5 | Site Visits 30 |
||
| 2.6 | Units of Measure30 | ||
| 2.7 | Site Grid Parameters 31 |
||
| 2.8 | QP Declaration 31 |
||
| 2.9 | Effective Date 31 |
||
| 3 | Reliance on Other Experts | 32 | |
| 4 | Property Description and Location | 33 | |
| 4.1 | Area of the Property33 | ||
| 4.2 | Location and Access33 | ||
| 4.3 | Exploration Land Status 34 |
||
| 4.4 | Aggregate Lease 41 |
||
| 4.5 | Environmental42 | ||
| 5 | Accessibility, Climate, Local Resources, Infrastructure and Physiography | 43 | |
| 5.1 | Topography and vegetation43 | ||
| 5.2 | Accessibility 43 |
||
| 5.3 | Climate43 | ||
| 5.4 | Local Resources & Infrastructure 45 |
||
| 5.5 | Physiography 46 |
||
| 6 | History | 47 | |
| 6.1 | Modern Pre-mining Exploration 47 |
||
| 6.2 | Scotia Mine Deposit Main Zone47 | ||
| 6.3 | Getty Zone 49 |
||
| 6.4 | Ownership History 50 |
||
| 6.5 | Historical Mineral Resource and Mineral Reserve Estimates 52 |
||
| 7 | Geological Setting and Mineralization | 56 | |
| 7.1 | Regional Geology 56 |
||
| 7.2 | Property Geology62 | ||
| 7.3 | Mineralization75 | ||
| 8 | Deposit Types | 77 | |
| 8.1 | Gypsum 77 |
||
| 8.2 | Genesis of the evaporites77 | ||
|---|---|---|---|
| 8.3 | Zinc and Lead 80 |
||
| 9 | Exploration |
82 | |
| 9.1 | Exploration History82 | ||
| 10 | Drilling | 89 | |
| 10.1 | Sample Length – True Width Relationship89 |
||
| 10.2 | Main Zone (pre-2011)89 | ||
| 10.3 | Main Zone Drilling (post 2011) 93 |
||
| 10.4 | Getty Zone 95 |
||
| 10.5 | Gypsum 95 |
||
| 11 | Preparation, Analyses, and Security | 96 | |
| 11.1 | Gypsum 96 |
||
| 11.2 | Sample Preparation and Analyses 97 |
||
| 12 | Data Verification | 102 | |
| 12.1 | Main Zone102 | ||
| 12.2 | Historical Data Verifications105 | ||
| 13 | Mineral Processing and Metallurgical Test Work | 106 | |
| 13.1 | Introduction 106 |
||
| 13.2 | Sample Description106 | ||
| 13.3 | Mineralogy 106 |
||
| 13.4 | Review 107 |
||
| 13.5 | Operational Data107 | ||
| 13.6 | Comminution Testing108 | ||
| 13.7 | Flotation Testing 108 |
||
| 13.8 13.9 |
Concentrate Solids Liquids Separation Testing 111 Predicted Metallurgical Results 111 |
||
| 13.10 | Conclusions 112 |
||
| 13.11 | Recommendations113 | ||
| 14 | Mineral Resource Estimates | 114 | |
| 14.1 | Gypsum 114 |
||
| 14.2 | Base Metals 116 |
||
| 14.3 | Resource Database117 | ||
| 14.4 | Geological and Grade Shell (Mineralization) Modelling 117 |
||
| 14.5 | Exploratory Data Analysis 119 |
||
| 14.6 | Evaluation of Outliers121 | ||
| 14.7 | Compositing121 | ||
| 14.8 | Variography 122 |
||
| 14.9 | Block Model and Grade Estimation 124 |
||
| 14.10 | Model Validation 127 |
||
|---|---|---|---|
| 14.11 | Mineral Resource Classification 136 |
||
| 14.12 | Mineral Resource Statement 136 |
||
| 15 | Mineral Reserve Estimate | 141 | |
| 15.1 | Mineral Reserve Estimate 141 |
||
| 15.2 | Mineral Reserve Estimation141 | ||
| 15.3 | Cut-Off Grade 142 |
||
| 15.4 | Mining Dilution and Recovery143 | ||
| 15.5 | Mineral Reserves144 | ||
| 15.6 | Conversion of Mineral Resources to Mineral Reserves 144 |
||
| 16 | Mining Methods | 145 | |
| 16.1 | Introduction 145 |
||
| 16.2 | Mine Design145 | ||
| 16.3 | Geotechnical Considerations147 | ||
| 16.4 | Phased Pit Designs 158 |
||
| 16.5 | Gypsum Assessment159 | ||
| 16.6 | Waste Management162 | ||
| 16.7 | Life-of-Mine Production Schedule 164 |
||
| 16.8 | Ore Stockpile Management 167 |
||
| 16.9 | Mining Equipment Fleet169 | ||
| 16.10 | Drilling & Blasting171 | ||
| 16.11 | Open Pit Dewatering & Hydrology172 | ||
| 16.12 | Mining Workforce173 | ||
| 16.13 | Mining Mobile Maintenance174 | ||
| 17 | Recovery Methods |
176 | |
| 17.1 17.2 |
Overall Process Design 176 Mill Process Plant Description 176 |
||
| 17.3 | Life of Mine Concentrate Production 188 |
||
| 17.4 | Reagent Handling & Storage190 | ||
| 17.5 | Services & Utilities 192 |
||
| 17.6 | Water Supply 192 |
||
| 18 | Project Infrastructure | 194 | |
| 18.1 | Scotia Mine Workforce196 | ||
| 18.2 | Electrical Power Systems 196 |
||
| 18.3 | Water 199 |
||
| 18.4 | Site Water Management200 | ||
| 18.5 | Medical Facilities 205 |
||
| 18.6 | Telecommunications205 | ||
| 18.7 Administration building206 |
|
|---|---|
| 18.8 Mine Services Building 207 |
|
| 18.9 Warehouse & Workshop208 |
|
| 18.10 Equipment and Spare Parts Asset Inventory 209 |
|
| 18.11 Maintenance Garage 216 |
|
| 18.12 Core Preparation Building 218 |
|
| 18.13 Core Storage Building219 |
|
| 18.14 Proposed Additional Mobile Fleet Workshops221 |
|
| 18.15 Mill Processing Building222 |
|
| 18.16 Tailings Storage Facility 234 |
|
| 18.17 Fuel Storage 236 |
|
| 18.18 Cold Warehouses & Storage Yard 236 |
|
| 18.19 Sewerage Treatment 237 |
|
| 18.20 Garbage Disposal239 |
|
| 18.21 Mill Process Control Systems239 |
|
| 18.22 Crushing Circuit 239 |
|
| 18.23 Grinding Circuit 239 |
|
| 18.24 Flotation Circuit240 |
|
| 18.25 Concentrate Loading & Transport 241 |
|
| 18.26 Tailings 241 |
|
| 18.27 Power241 |
|
| 18.28 Air242 |
|
| 18.29 Water 242 |
|
| 18.30 Existing Control Systems242 |
|
| 18.31 Additional Control Systems & Upgrades 243 |
|
| 18.32 Fire Detection and Fire Suppression Systems 243 |
|
| 18.33 Explosives244 |
|
| 18.34 Mine Services 244 |
|
| 18.35 Site Emergency Services & Rescue244 |
|
| 18.36 Mobile Mining Equipment 245 |
|
| 18.37 Water Management System 245 |
|
| 18.38 Waste Storage Facilities250 |
|
| 18.39 Laydown Areas 251 |
|
| 18.40 Transportation253 |
|
| 18.41 Logistics259 |
|
| Market Studies and Contracts | 265 |
| 19.1 Gypsum 265 |
|
| 19.2 Base Metals 270 |
| 19.3 | Market Studies271 | ||
|---|---|---|---|
| 19.4 | Concentrate Volumes and Quality272 | ||
| 19.5 | Locked Cycle Test Results 280 |
||
| 19.6 | Offtake Agreements281 | ||
| 19.7 | Contracts 282 |
||
| 19.8 | Smelter Market 282 |
||
| 19.9 | Metal Prices 284 |
||
| 19.10 | Lead Price291 | ||
| 19.11 | Conclusions 295 |
||
| 20 | Environmental Studies, Permitting and Social or Community Impact | 296 |
|
| 20.1 | Project Overview296 | ||
| 20.2 | Overview of Existing Information 296 |
||
| 20.3 | Environmental Management Plans301 | ||
| 20.4 | Permitting307 | ||
| 20.5 | Indigenous Background310 | ||
| 20.6 | Mine Closure311 | ||
| 21 | Capital and Operating Expenditure | 317 | |
| 21.1 | Sources of estimated costs 317 |
||
| 21.2 | Capital Cost Summary318 | ||
| 21.3 | Pre-production capital319 | ||
| 21.4 | Operating Expenditure Estimate326 | ||
| 22 | Economic Analysis |
342 | |
| 22.1 | Summary of Economic Results 342 |
||
| 22.2 | Cash Flow Model Cost Sources 343 |
||
| 22.3 | Cash Flow Model Assumptions 343 |
||
| 22.4 | Capital Expenditure 345 |
||
| 22.5 | Sustaining Capital Expenditure 345 |
||
| 22.6 | Operating Expenditure346 | ||
| 22.7 | Concentrate Sale terms347 | ||
| 22.8 | Taxation and Royalties 348 |
||
| 22.9 22.10 |
Cash Flow Financial Results 350 Economic Analysis350 |
||
| 23 | Adjacent Properties |
355 | |
| 24 | 24.1 | Other Relevant Data Mine Site Organization 356 |
356 |
| 24.2 | Project Execution Strategy 360 |
||
| 25 | Conclusions | 363 | |
| 25.1 | SRK Conclusions 2020 Technical 363 |
| 28 | Glossary | 383 | |
|---|---|---|---|
| 27 | References | 377 | |
| 26.2 | 2021 Technical Report Recommendations 375 |
||
| 26.1 | 2020 Technical Report Recommendations 371 |
||
| 26 | Recommendations |
371 | |
| 25.5 | Conclusions 2021 Updated Technical Report 366 |
||
| 25.4 | MineTech Conclusions 2020 Technical Report365 | ||
| 25.3 | Terrane Geotech Conclusions 2020 Technical Report 365 |
||
| 25.2 | Ausenco Conclusions 2020 Technical Report364 |
List of Tables
| Table 1-1: Summary of Past Production of Lead and Zinc Concentrate from the Scotia Mine 22 |
|
|---|---|
| Table 1-2: Scotia Mine Resource Statement Update, Feb 14th, 2021 – MineTech International Ltd. 25 |
|
| Table 1-3: Scotia Mine Base Metal Resources 26 |
|
| Table 1-4: Conversion of Mineral Resources to Mineral Reserves 26 |
|
| Table 1-5: Scotia Mine Gypsum Resource Statement 27 |
|
| Table 1-6: Project Economic Results 28 |
|
| Table 2-1: Site Grid Parameters 31 |
|
| Table 4-1: Summary of ScoZinc Exploration Licenses 38 |
|
| Table 4-2: Exploration License 06268 (20 Claims) 38 |
|
| Table 4-3: Exploration License 06959 (Getty Zone, 16 Claims) 38 |
|
| Table 4-4: Exploration License 08936 (1 Claim) 38 |
|
| Table 4-5: Exploration License 09069 (1 Claim) 38 |
|
| Table 4-6: Exploration License 51016 (3 Claims) 38 |
|
| Table 4-7: Mineral Lease 10-1 (38 Claims), Map Sheet (NTS) 11E-03B 39 |
|
| Table 4-8: Mineral Lease 40058 (1 Claim), Map Sheet (NTS) 11E-03B 40 |
|
| Table 4-9: Mineral Lease 40059 (1 Claim), Map Sheet (NTS) 11E-03B 40 |
|
| Table 4-10: Property Ownership, ScoZinc Limited 40 |
|
| Table 6-1: Historical Milling Records Compiled by MineTech in 2012 47 |
|
| Table 6-2: Historical Resource and Reserve Estimates 53 |
|
| Table 6-3: Previous Mineral Resource (Roy et al, 2006) 54 |
|
| Table 6-4: Previous Mineral Reserve Estimate (Roy et al, 2006) 54 |
|
| Table 6-5: Historic Resource Estimates for Getty Zone - Not NI 43‐101 Compliant (Cullen et al, 2011) 55 |
|
| Table 6-6: Mercator NI 43‐101 Resource Estimate for Getty Zone (effective December 12th, 2007) (Cullen et al, 2011) 55 |
|
| Table 10-1: Historical Surface and Underground Diamond Drilling Activity3 90 |
|
| Table 10-2: Descriptive Statistics 91 |
|
| Table 10-3: 2011 Drill Collar Summary 94 |
|
| Table 11-1: 2011 Sampling Standards 101 |
|
| Table 12-1: Holes that Were Verified During the Database Validation 102 |
|
| Table 12-2: Results of Verification Sampling (2004 Drilling Program by ScoZinc) 104 |
|
| Table 12-3: 1997 Drilling Program by Westminer 104 |
|
| Table 13-1: Master Composite Mineral Content 107 |
| Table 13-2: Historical Operational Data | 108 |
|---|---|
| Table 13-3: SMC Test Results |
108 |
| Table 13-4: Bond Ball Mill Work Index Test Results | 108 |
| Table 13-5: Proposed ScoZinc Mine Production Plan (first 5 years) |
110 |
| Table 14-1: Gypsum Resource Estimation Parameters | 115 |
| Table 14-2: Density – Non-Mineralized Materials |
117 |
| Table 14-3: Summary Statistics – GRFM ZN and Pb Assays |
121 |
| Table 14-4: Default Values by Zone | 122 |
| Table 14-5: Composites Summary Statistics |
122 |
| Table 14-6: Variogram Parameters by Zone – Zinc |
123 |
| Table 14-7: Primary Block Model Geometry |
125 |
| Table 14-8: Secondary Block Model Geometry |
125 |
| Table 14-9: Estimation Parameters | 126 |
| Table 14-10: Resource Pit Optimization Parameters | 137 |
| Table 14-11: Scotia Mine Resource Statement, Feb 31st, 2021 – SRK Consulting (U.S.), Inc. MineTech International Ltd |
139 |
| Table 14-12: Resource Sensitivity within the Resource Pit Shell |
140 |
| Table 15-1: Optimization Inputs for Zinc-Equivalent Calculation |
143 |
| Table 15-2: Scotia Mine Mineral Reserve Estimates |
144 |
| Table 15-3: Conversion of Mineral Resources to Mineral Reserves |
144 |
| Table 16-1: Pit Optimization Parameters used for Mine Planning |
146 |
| Table 16-2: Geotechnical Pit Slope Parameters | 147 |
| Table 16-3: Geotechnical Waste Dump Parameters |
148 |
| Table 16-4: Design Basis for Ultimate Pit Design |
149 |
| Table 16-5: Tonnage and Grade by Pit Phase |
158 |
| Table 16-6: Phased Pit Sequencing | 158 |
| Table 16-7: 2004 Gypsum Assay Results Within LOM Pit |
160 |
| Table 16-8: Waste Dump Design Criteria |
162 |
| Table 16-9: Waste Storage Capacity Vs Waste Storage Required |
162 |
| Table 16-10: Waste Movement Sequence | 164 |
| Table 16-11: Diluted LOM Mine Production Schedule | 166 |
| Table 16-12: Ore Stockpile Grade Ranges |
167 |
| Table 16-13: Mine Production Ramp Up Schedule | 170 |
| Table 16-14: Mining Heavy Equipment Fleet Requirements |
170 |
|---|---|
| Table 16-15: Mining Workforce During Peak Operation |
174 |
| Table 16-16: Mine Maintenance & Site Services Workforce During Peak Operation | 174 |
| Table 17-1: Key Milling Plant Process Design Criteria |
178 |
| Table 19-1: Gypsum and calcined gypsum price, 2005 - 2020 (USGS) |
268 |
| Table 19-2: Lead and Zinc, North American Producer price in \$US/pound. |
271 |
| Table 19-3: Zinc Concentrate Grades: Scotia Mine vs. other Zinc Projects |
272 |
| Table 19-4: Concentrate Treatment Charges |
273 |
| Table 19-5: Scotia Mine Mineral Reserve Estimates |
274 |
| Table 19-6: Scotia Mine Historical Zinc Concentrate Specifications |
278 |
| Table 19-7: Scotia Mine Historical Lead Concentrate Specifications |
278 |
| Table 19-8: Forecast variations in grades, recoveries and metal concentrate produced |
279 |
| Table 19-9: Scotia Mine Metallurgical Performance Analysis |
280 |
| Table 19-10: North American Smelters |
283 |
| Table 19-11: Select International Smelters |
283 |
| Table 19-12: Prices of zinc and lead used in financial analysis |
284 |
| Table 19-13: Prices of zinc and lead used in financial analysis – Long Term |
284 |
| Table 19-14: Prices of zinc and lead used in financial analysis |
292 |
| Table 19-15: Concentrate Treatment Charges |
292 |
| Table 19-16: Prices of zinc and lead used in economic analysis |
295 |
| Table 20-1: ScoZinc Permits and Approvals |
309 |
| Table 20-2: ScoZinc Reclamation Plan |
314 |
| Table 21-1: Sources of inputs to Capital and Operating Expenditure estimates |
318 |
| Table 21-2: Summary of capital costs |
318 |
| Table 21-3: Pre-production capital costs |
319 |
| Table 21-4: Salvage value capital estimate |
320 |
| Table 21-5: Pre-production capital costs inclusions and exclusions |
320 |
| Table 21-6: Recommended pre-production cost items |
321 |
| Table 21-7: Reclamation Bond requirements |
324 |
| Table 21-8: Total sustaining capital costs |
326 |
| Table 21-9: Total operating expenditure summary |
326 |
| Table 21-10: Scotia Mine Workforce Labour Levels |
335 |
| Table 22-1: Economic Results Summary |
342 |
| Table 22-2: Forecast Metal Prices by Calendar Year |
343 |
|---|---|
| Table 22-3: Forecast Metal Prices by Project Year |
344 |
| Table 22-4: Capital Expenditure Summary |
345 |
| Table 22-5: Sustaining Capital Expenditure Summary |
346 |
| Table 22-6: Unit Operating Expenditure |
346 |
| Table 22-7: Zinc Concentrate Indicative Smelter Charges |
348 |
| Table 22-8: Lead Concentrate Indicative Smelter Charges |
348 |
| Table 22-9: Cash flow Financial Results |
350 |
| Table 22-10: Metal Price Sensitivities Analysis |
351 |
| Table 22-11: Exchange Rate Sensitivities Analysis |
351 |
| Table 22-12: Cash flow Model Detail |
353 |
| Table 24-1: Scotia Mine Departments |
356 |
| Table 24-2: Scotia Mine Positions (Year 1+) |
359 |
| Table 25-1: Zinc and lead Mineral Resource Base (Carrew et.al. 2020) | 367 |
| Table 25-2: Zinc and lead Mineral Reserve Base (Carrew et.al. 2020) | 368 |
| Table 25-3: Conversion of Measured and Indicated Mineral Resources to Proven and Probable Mineral Reserves (Carrew et. a. 2020) |
368 |
| Table 25-4: Estimated Gypsum Mineral Resources within the optimum pit outline at the Scotia Mine | 369 |
| Table 26-1: Specific Gravities of the Scotia Mine minerals of value | 375 |
| Table 26-2: Recommendations, 2021 Report |
376 |
List of Figures
| Figure 4-1: Location of Scotia Mine |
33 |
|---|---|
| Figure 4-2: Scotia Mine Location Relative to Halifax |
34 |
| Figure 4-3: Exploration Licenses, Mineral Leases, and Real Property Boundary (Surface Rights) |
35 |
| Figure 4-4: Real Property Map, ScoZinc Limited |
36 |
| Figure 4-5: Getty Zone Mineral Claims Location Map |
37 |
| Figure 4-6: Sand Mining at Gays River, 1998 | 41 |
| Figure 5-1: Temperature Averages, Middle Musquodoboit |
44 |
| Figure 5-2: Precipitation, 1% of Precipitation Events Yield | 44 |
| Figure 5-3: Topography and Infrastructure in the Scotia Mine Area | 45 |
| Figure 5-4: Natural Gas Pipeline Between Goldboro and HRM |
45 |
| Figure 6-1: Figure from the Letter from F. Clyde Lendrum to J.S, Kermeen, VP Seabright Resources Inc., dated May 22, 1985 (Assessment Report ME 1986-084, 1986, 307 page(s), 8 map(s). ISN: 8738 |
48 |
| Figure 7-1: E.R. Faribault's Map of the Scotia Mine Area (GSC map 908) Noted the Galena in Limestones, (Faribault, 1907) |
57 |
| Figure 7-2: General Geology in the Scotia Mine area. (Geological Map of the Province of Nova Scotia (map_1979-011_200_cln) |
58 |
| Figure 7-3: Tectonism and Volcanism of the Last Million Years, Tectonic Plate Boundaries {NASA, DTAM, 1998) |
59 |
| Figure 7-4: The Closure of the Atlantic Creating the Supercontinent Pangea. Meguma Rocks Folded and Stuck to North America. (Lutgens and Tarbuck, 1882) |
60 |
| Figure 7-5: Regional Geology Map |
62 |
| Figure 7-6: Stereonet Showing the Facture Pattern |
63 |
| Figure 7-7: Fracture Patterns in the Goldenville Quartzite (Author's Personal Field Book) |
63 |
| Figure 7-8: Goldenville Bedding Strike and Dip Varies from Northwest Dipping Slopes to Northeast Dipping Slopes (Author's Personal Field Book) |
64 |
| Figure 7-9: The Geological History of the Scotia Mine Deposit (Hannon and McKee, 1984) | 65 |
| Figure 7-10: Soil Types in the Scotia Mine Area from Report 13, Soil Survey of Halifax County Nova Scotia (Macdougall And Cann, 1963) |
67 |
| Figure 7-11: Stratigraphic Setting of Gays River Formation (Boehner et al, 1979) |
68 |
| Figure 7-12: Top-of-Carbonate Contour Map |
68 |
| Figure 7-13: Geological Cross-Section A-A' |
69 |
| Figure 7-14: Geological Cross-Section B-B' |
70 |
| Figure 7-15: Geological Cross-Section C-C' | 71 |
| Figure 7-16: Getty Zone Geological Map | 72 |
| Figure 7-17: Getty Zone Stratigraphic Column |
73 |
|---|---|
| Figure 7-18: Carbonate Bank Cross-Section |
74 |
| Figure 8-1: Cartoon Cross Section of the Bar Theory Put Forth by Carl Ochsenius in 1888, as Illustrated by De Mille, 1978 |
78 |
| Figure 8-2: The Linked Basin Theory of Ochsenius as Illustrated by de Mille, 1978 | 78 |
| Figure 8-3: Salts Dissolved in Sea Water% by Weight. (Verhoogen, et.al., 1970) | 79 |
| Figure 8-4: Mississippi Valley Type Carbonate Hosted Deposits in Canada (GSC map D1860A) |
80 |
| Figure 10-1: Sample Histogram for Zn and Pb |
92 |
| Figure 10-2: Sample Interval Histogram |
93 |
| Figure 13-1: Zinc Recovery as a Function of Head Grade (2008 Production Data) |
109 |
| Figure 13-2: Lead Recovery as a Function of Head Grade (2008 Production Data) |
110 |
| Figure 13-3: Lead Recovery Model for Cash Flow Analysis |
112 |
| Figure 13-4: Zinc Recovery Model for Cash Flow Analysis |
112 |
| Figure 14-1 Gypsum Domain 3D View Looking NE | 115 |
| Figure 14-2: Section view of gypsum domain |
116 |
| Figure 14-3: GRFM Solid – Perspective View, Looking ESE |
118 |
| Figure 14-4: Section View – Getty, Looking SE |
118 |
| Figure 14-5: Boxplot – GRFM Zinc Assays |
119 |
| Figure 14-6: Boxplot – GRFM Lead Assays |
120 |
| Figure 14-7: Typical Directional Variogram – Zinc (Main Zone, Azimuth 180º/Dip 0º) |
123 |
| Figure 14-8: Plan View of Zn and Pb Block Grades and Cross-Section Locations for Main, Getty and Northeast Zones |
128 |
| Figure 14-9: Main Zone Cross-Section Comparing Assay Composite Grades to Estimated Block Grades for both Zn and Pb (Section Looking South-West) |
129 |
| Figure 14-10: Getty Zone Cross-Section Comparing Assay Composite Grades to Estimated Block Grades for both Zn and Pb (Section Looking North-West) |
130 |
| Figure 14-11: Northeast Zone Cross-Section Comparing Assay Composite Grades to Estimated Block Grades for both Zn and Pb (Section Looking South-West) |
131 |
| Figure 14-12: Plan View of Gypsum Block Grades | 132 |
| Figure 14-13: North East Cross Section Comparing Assay Grade with Block Model Grades for Gypsum (Gyp%) |
133 |
| Figure 14-14: Easting Swath Plot for Zn and Pb | 134 |
| Figure 14-15: Northing Swath Plot for Zn and Pb |
135 |
| Figure 14-16: 3D Isometric View of the Resource Pit and Block Model (Zn% Grade Shown) |
138 |
| Figure 15-1: Resource Block Model | 141 |
| Figure 15-2: Orebody with Surface Constraints | 142 |
|---|---|
| Figure 16-1: Constrained Optimized Pit Shell |
146 |
| Figure 16-2: Pit Slope Design Details |
148 |
| Figure 16-3: Waste Dump Design Details |
149 |
| Figure 16-4: EOP Surface Year 1 |
150 |
| Figure 16-5: EOP Surface Year 2 |
150 |
| Figure 16-6: EOP Surface Year |
151 |
| Figure 16-7: EOP Surface Year 4 |
151 |
| Figure 16-8: EOP Surface Year 5 |
152 |
| Figure 16-9: EOP Surface Year 6 |
152 |
| Figure 16-10: EOP Surface Year 7 |
153 |
| Figure 16-11: EOP Surface Year 8 |
153 |
| Figure 16-12: EOP Surface Year 9 |
154 |
| Figure 16-13: EOP Surface Year 10 |
154 |
| Figure 16-14: EOP Surface Year 11 |
155 |
| Figure 16-15: EOP Surface Year 12 |
155 |
| Figure 16-16: EOP Surface Year 13 |
156 |
| Figure 16-17: EOP Surface Year 14 |
156 |
| Figure 16-18: Ultimate Pit Design & Dump Design | 157 |
| Figure 16-19: Phased Pit Sequencing |
159 |
| Figure 16-20: Gypsum Stockpile Locations |
161 |
| Figure 16-21: Typical Cross Section Showing Gypsum Intersection with Pit |
161 |
| Figure 16-22: Waste Dump Design | 163 |
| Figure 16-23: Mill Throughput per Month with Head Grades |
167 |
| Figure 16-24: Ore Stockpile Balances per Month |
168 |
| Figure 16-25: ROM Ore Stockpile Area |
169 |
| Figure 16-26: Mine Production Rate per Month Figure 16-27: 3D View of Underground Workings Network Within the Main Zone Pit |
170 171 |
| Figure 16-28: Overburden Slope Depressurizing Well Locations | 173 |
| Figure 16-29: Mine Infrastructure Layout | 175 |
| Figure 17-1: Processing Plant | 177 |
| Figure 17-2: Overall Process Flow Diagram |
182 |
| Figure 17-3: Overall Plant Layout |
183 |
| Figure 17-4: Crushing Area Section | 184 |
|---|---|
| Figure 17-5: Sizing Screen Area Section | 185 |
| Figure 17-6: Dewatering and Concentrate Handling Section |
186 |
| Figure 17-7: Reagent Flow Sheet |
187 |
| Figure 17-8: Annual Ore Processed | 188 |
| Figure 17-9: Mill Annual Production |
188 |
| Figure 17-10: Forecast LOM Concentrate Production |
189 |
| Figure 17-11: Zinc Concentrate Production |
189 |
| Figure 17-12: Lead Concentrate Production | 190 |
| Figure 18-1: Site Aerial photo (2017) |
194 |
| Figure 18-2: Proposed site layout mining additions (plan view) |
195 |
| Figure 18-3: Proposed site layout processing additions (plan view) |
195 |
| Figure 18-4: 8,000 kVA transformer |
197 |
| Figure 18-5: Mine dewatering transformer and substation |
197 |
| Figure 18-6: Existing Electrical System Single-Line Diagrams |
198 |
| Figure 18-7: Water treatment plant and water storage |
199 |
| Figure 18-8: Pumping station at Gay's River |
200 |
| Figure 18-9: Proposed New Reservoir location |
201 |
| Figure 18-10: Tailings Pond |
202 |
| Figure 18-11: Polishing Pond |
203 |
| Figure 18-12: Storm Water Pond |
204 |
| Figure 18-13: Scotia Mine site supply and distribution |
205 |
| Figure 18-14: Administration Building |
206 |
| Figure 18-15: Mine Technical Services & Operations Building |
207 |
| Figure 18-16: Warehouse & Workshop |
208 |
| Figure 18-17: Site Warehouse Receiving Bay |
209 |
| Figure 18-18: Selected Processing Assets |
210 |
| Figure 18-19: Selected Processing Assets Figure 18-20: Selected Processing Assets |
211 212 |
| Figure 18-21: Selected Warehouse Assets |
212 |
| Figure 18-22: Selected Maintenance Assets |
214 |
| Figure 18-23: Selected Maintenance Assets |
215 |
| Figure 18-24: Selected Mining Assets |
216 |
| Figure 18-25: Maintenance Garage |
217 |
|---|---|
| Figure 18-26: Maintenance Garage (interior) |
218 |
| Figure 18-27: Core Preparation Building |
219 |
| Figure 18-28: Core Storage Building |
220 |
| Figure 18-29: Core Storage Building (interior) |
220 |
| Figure 18-30: Sample Dome Structure |
221 |
| Figure 18-31: Existing Mill Processing Building – South Side Exterior View |
223 |
| Figure 18-32: Existing Mill Processing Building – North Side Exterior View |
223 |
| Figure 18-33: Existing Mill Fine-Ore-Bin (Silo) |
224 |
| Figure 18-34: Proposed Additions to Mill Process Building |
225 |
| Figure 18-35: Crushing Circuit |
226 |
| Figure 18-36: Grinding Circuit |
227 |
| Figure 18-37: Flotation Circuit |
228 |
| Figure 18-38: Zinc thickener tank |
228 |
| Figure 18-39: Concentrate Dewatering Area |
229 |
| Figure 18-40: Concentrate Loadout Area |
229 |
| Figure 18-41: Control Room |
230 |
| Figure 18-42: Reagent tanks |
231 |
| Figure 18-43: Wet Metallurgical laboratory |
232 |
| Figure 18-44: Dry Metallurgical laboratory |
232 |
| Figure 18-45: Large Main Deck Maintenance Bay |
233 |
| Figure 18-46: Large Ground Floor Maintenance Bays |
233 |
| Figure 18-47: Tailings Storage Facility |
234 |
| Figure 18-48: Tailings Storage Facility Decant Tower |
235 |
| Figure 18-49: Tailings Storage Facility Causeway |
235 |
| Figure 18-50: Diesel Fuel Farm |
236 |
| Figure 18-51: Cold Warehouse and Storage Yard |
237 |
| Figure 18-52: Underground Sewerage Treatment System |
238 |
| Figure 18-53: Effluent Treatment System – Septic leach field |
238 |
| Figure 18-54: Nova Scotia electricity transmission system |
242 |
| Figure 18-55: Water Supply and Distribution Systems Flow Sheet |
247 |
| Figure 18-56: Tailings Storage Pond |
248 |
| Figure 18-57: Polishing Pond |
248 |
| Figure 18-58: Discharge Weir |
249 |
|---|---|
| Figure 18-59: Storm Water Pond |
249 |
| Figure 18-60: Waste Dump (2017) |
250 |
| Figure 18-61: Waste Rock Storage - Waste Dump design |
251 |
| Figure 18-62: Laydown Area |
252 |
| Figure 18-63: Secondary Laydown Area (Proposed New Reservoir location) |
252 |
| Figure 18-64: Distance from the Scotia Mine gate to Stanfield Airport |
253 |
| Figure 18-65: Halifax Stanfield Airport Non-Stop Flight Destinations |
253 |
| Figure 18-66: Milford Railway Siding route from Scotia Mine |
254 |
| Figure 18-67: CN Milford Railway Siding |
255 |
| Figure 18-68: Spring Weight Road Restrictions |
256 |
| Figure 18-69: Mine Access Road |
257 |
| Figure 18-70: ScoZinc's Bridge |
258 |
| Figure 18-71: ScoZinc's Bridge & Highway Access |
258 |
| Figure 18-72: Container Handling Facility |
260 |
| Figure 18-73: Onsite container weighbridge |
261 |
| Figure 18-74: Fairview Cover Container Terminal route from the Scotia Mine |
262 |
| Figure 18-75: Fairview Cove Container Terminal |
263 |
| Figure 18-76: Nearby Milford Railway Siding |
264 |
| Figure 19-1 A series of slides from the Midwest soil Improvement Symposium (accessed at http://www.gypsoil.com/symposium) |
267 |
| Figure 19-2 Gypsum Price in Canadian Dollars per metric tonne. |
270 |
| Figure 19-3 Historical Gypsum price in US\$ per metric tonne between 1900 and 2020 | 270 |
| Figure 19-4: Lead and Zinc, North American Producer price in \$US/pound. |
271 |
| Figure 19-5: Historical Zinc Treatment Charges |
274 |
| Figure 19-6: Forecast LOM Concentrate Production |
275 |
| Figure 19-7: Forecast Annual Production of Zinc Concentrate |
275 |
| Figure 19-8: Forecast Annual Production of Lead Concentrate |
276 |
| Figure 19-9: Forecast Annual Concentrate Production |
277 |
| Figure 19-10: Composite Cash Costs for Zinc Mines vs. Scotia Mine |
287 |
| Figure 19-11: C1 Cost Curve – Base Case & Probable Projects vs. Scotia Mine |
288 |
| Figure 19-12: Expected Demand for Minerals by 2050 |
291 |
| Figure 19-13: Historical Lead Treatment Charges |
294 |
| Figure 20-1: Historical Average Monthly Rainfall |
297 |
|---|---|
| Figure 20-2: Historical Average Monthly Temperature |
298 |
| Figure 20-3: Historical Average Monthly Snowfall |
298 |
| Figure 20-4: ScoZinc Monitoring Locations |
304 |
| Figure 20-5: Scotia Mine Water Process Flow Chart |
306 |
| Figure 21-1: Scotia Mine Average C1 Cash Cost |
327 |
| Figure 21-2: Annual Cash Operating Expenditure |
328 |
| Figure 21-3: Annual Cash Operating Expenses by Cost Centre |
328 |
| Figure 21-4: Annual Cash Operating Expenses by Cash Cost Component | 329 |
| Figure 21-5: LOM Mine Cash Operating Expenditure | 330 |
| Figure 21-6: Annual Mine Cash Operating Expenditure |
331 |
| Figure 21-7: LOM Mill Cash Operating expenditure |
332 |
| Figure 21-8: Annual Mill Cash Operating Expenditure | 333 |
| Figure 21-9: LOM G&A Cash Operating expenditure |
334 |
| Figure 21-10: Annual G&A Cash Operating expenditure | 334 |
| Figure 21-11: Annual Workforce Levels (Average) | 335 |
| Figure 21-12: Annual Workforce Levels (by type) | 336 |
| Figure 21-13: Annual Power Distribution |
337 |
| Figure 21-14: Annual Site Power Costs |
338 |
| Figure 21-15: Annual Diesel Consumption Costs |
339 |
| Figure 21-16: Container Transport Frequency | 340 |
| Figure 21-17: Container Transport Costs |
340 |
| Figure 22-1: Post-Taxation Sensitivity Diagram |
352 |
| Figure 23-1: Carrolls Farm and Carrolls Corner Prospects |
355 |
| Figure 24-1: Annual Average Workforce Levels |
356 |
| Figure 24-2: Ownership and Management Organizational Structure |
357 |
| Figure 24-3: Annual Average Workforce Levels |
358 |
Abbreviations
| Abbreviation | Unit or Term |
|---|---|
| A | Ampere |
| AA | Atomic absorption |
| ANFO | Ammonium nitrate fuel oil |
| Ag | Silver |
| °C | Degrees Celsius |
| CCD | Counter-current decantation |
| COG | Cut-off grade |
| Cfm | Cubic feet per minute |
| ConfC | Confidence code |
| CRec | Core recovery |
| CSS | Closed-side setting |
| CTW | Calculated true width |
| CWA | Clean Water Act |
| ° | Degree (degrees) |
| dia. | Diameter |
| EIS | Environmental Impact Statement |
| EMP | Environmental Management Plan |
| EPA | Environmental Protection Agency |
| FA | Fire assay |
| Ft | Foot (feet) |
| ft2 ft3 |
Square foot (feet) |
| Cubic foot (feet) | |
| G | Gram |
| Gal g/L |
Gallon Gram per litre |
| g-mol | Gram-mole |
| Gpm | Gallons per minute |
| g/t | Grams per tonne |
| Ha | Hectares |
| HDPE | Height Density Polyethylene |
| HFRA | Healthy Forests Restoration Act |
| Hp | Horsepower |
| HTW | Horizontal true width |
| ICP | Inductively coupled plasma |
| IDW | Inverse distance weighting |
| IFC | International Finance Corporation |
| ILS | Intermediate Leach Solution |
| IRR | Internal Rate of Return |
| kA | Kiloamperes |
| Km kV |
Kilometer or Kilometre Kilovolt |
| kW | Kilowatt |
| kWh | Kilowatt-hour |
| kWh/t | Kilowatt-hour per metric tonne |
| L | Liter or Litre |
| L/sec | Liters per second |
| L/sec/m | Liters per second per metre |
| lb. | Pound |
| LHD | Long-Haul Dump truck |
| LLDDP | Linear Low Density Polyethylene Plastic |
| LOI | Loss on Ignition |
| LOM | Life-of-Mine |
| M | Million |
| MACT | Maximum Achievable Control Technology |
| MDA | Mine Development Associates |
| Mm | Millimetre |
| MME | Mine & Mill Engineering |
| Abbreviation | Unit or Term | ||||
|---|---|---|---|---|---|
| MPO | Mine plan of operations | ||||
| Mt | Million tonnes | ||||
| MTW | Measured true width | ||||
| MW | Million watts | ||||
| MWMP | Meteoric Water Mobility Procedure | ||||
| m.y. | Million years | ||||
| NGO | Non-governmental organization | ||||
| NI 43-101 | Canadian National Instrument 43-101 | ||||
| NPV | Net Present Value | ||||
| OSC | Ontario Securities Commission | ||||
| % | Percent | ||||
| Pb | Lead | ||||
| PLC | Programmable Logic Controller | ||||
| PMF | Probable maximum flood | ||||
| POD | Plan of Development | ||||
| Ppb | Parts per billion | ||||
| Ppm | Parts per million | ||||
| QA/QC | Quality Assurance/Quality Control | ||||
| RC | Reverse circulation drilling | ||||
| RoM | Run-of-Mine | ||||
| ROW | Right-of-way | ||||
| RQD | Rock Quality Description | ||||
| SEC Sec |
U.S. Securities & Exchange Commission Second |
||||
| SG | Specific gravity | ||||
| SPT | Standard penetration testing | ||||
| T | Tonne (metric ton) (Equal to 2,204.6 pounds) | ||||
| T&E | Threatened or endangered | ||||
| t/h | Tonnes per hour | ||||
| t/d | Tonnes per day | ||||
| t/y | Tonnes per year | ||||
| TSF | Tailings storage facility | ||||
| TSP | Total suspended particulates | ||||
| µm | Micron or microns | ||||
| V | Volts | ||||
| VFD | Variable frequency drive | ||||
| W | Watt | ||||
| WPCP | Water pollution Control Permit | ||||
| XRD | X-ray diffraction | ||||
| Y | Year | ||||
| Yrs | Years | ||||
| Zn | Zinc | ||||
| ZnEq | Zinc Equivalent |
1 Summary
Introduction
This report is an update of the Mineral Resources at the Scotia Mine in central Nova Scotia. The report is for ScoZinc Mining Ltd. (SZM: TSX V) ("ScoZinc" or "the Company") of Halifax, Nova Scotia, Canada.
Mr. Jason Baker, Mine Manager for ScoZinc, based in Halifax, engaged Patrick Hannon, M.A.Sc., P.Eng., mining and geological engineer with MineTech International Limited ("MineTech"), to complete an update of the 2020 National Instrument 43-101 report for the Scotia Mine.
The previous technical report did not consider Gypsum to be a Mineral Resource. Gypsum was classed as waste in that report (Carew et al, 2020).
Mr. Hannon is a mining engineer and geological engineer qualified person (QP) with experience in gypsum mining and other industrial minerals, coal, base metals and precious metals. He has worked on the Scotia Mine property several times over the past years as project engineer, mine geologist and mine superintendent during the 1970s and early 1980s, as President of ScoZinc Limited 2004 – 2007 and as co-author of the 2020 Technical Report and as consultant engineer for the tailings dam inspections.
Property Description and Location
The Scotia Mine deposit ("the Property") is located in the Musquodoboit Valley, approximately sixty kilometres northeast of Halifax, in the community of Gays River, in the Halifax Regional Municipality. The entrance to the property, just off paved highway 224, is at latitude 45.03° North, longitude 63.33° West. The property is approximately fifteen kilometres from highway 102, a four lane highway between Halifax and Truro. The site is twenty-five kilometres from the Halifax International Airport.
ScoZinc currently holds five exploration licenses covering 41 claims in the immediate vicinity of the Scotia Mine Deposit. Each individual claim covers an area of approximately forty acres (16.2 hectares).
ScoZinc currently holds the mineral rights to the Main and Getty Zones, the mining rights and surface rights (real property rights) for the Scotia Mine deposit and an environmental assessment (environmental registration) for the Scotia Mine.
In Nova Scotia the surface owner has the rights to sand, gravel, clay, gypsum and limestone, thus as surface rights owner, ScoZinc has title to the gypsum. The gypsum and other industrial mineral resources are discussed in this report. Portions of the 2020 Technical Report (Carew et.al. 2020) are repeated in this report without any change.
Gallant Aggregates Ltd. of Elmsdale, Nova Scotia owns a 25 acre site inside the mine gate and has a "License, Option and Royalty Agreement" with ScoZinc granting Gallant the right to remove, extract and process sand, gravel, and fill and to obtain materials from the overburden and waste material created by ScoZinc at the Scotia Mine site (Main Zone) for the greater of \$25,000 per annum or \$1.00 per metric tonne. In addition, Gallant has a right of first refusal to purchase the Scotia Mine property if ScoZinc plans to sell the property after mining operations are completed or abandoned.
ScoZinc also has an agreement with an adjacent landowner (Benjamin) to lease 13 hectares of land, adjacent to the tailings impoundment, for the purpose of stockpiling stripped overburden waste material. There is a royalty agreement with Globex Resources Ltd., former holder of the Getty zone claims, for a 1% Net Smelter Return interest in the associated claims.
An Environmental Assessment Document is in place for Scotia Mine (Main Zone), approved in August 2000, which addresses the environmental concerns of a surface and underground mining operation along with the diversion of a 500-metre section of the Gays River to accommodate the pit design. The river has not yet been diverted.
ScoZinc has environmental approval to mine in the area that was approved to be mined by ScoZinc Limited in 2007-2008. Resources in that area have not been exhausted; however, additional environmental assessment work would be required before the mine could expand very far outside of its that footprint, either west along strike in the Main Zone, north east across Gays River to the Northeast Zone, or to the Getty Zone. ScoZinc has approval for its proposed south west expansion of the previously mined Main Pit. The Industrial Approval went through a renewal process and was approved March 28, 2019 with an expiry date of February 23, 2027.
Scotia Mine is fully permitted for operations. Only minor upgrades and improvements are required to the mining and processing facilities and production could begin within a year of a decision to proceed. ScoZinc intends to expand the existing operations with the additions of run-of-mine ROM based primary and secondary crushers, a container handling yard, mobile fleet fuel bay and additional mobile fleet maintenance workshop. Some of these opportunities require permitting and have been included in the Pre-Feasibility Study by way of temporary additions until permanent permitting can be provided. All mining and maintenance operations will be conducted by ScoZinc.
Prior to expansion outside the currently permitted area, updated plans would have to be approved by the Nova Scotia Department of Energy, and Mines and Nova Scotia Department of the Environment. An updated Industrial Approval and Environmental Assessment (essentially an environmental operating permit) would be required.
Accessibility, Climate, Local Resources, Infrastructure
The mean annual temperature is approximately 6°C and the annual precipitation is between 1,250mm to 1,500mm. Farming, forestry, mining and small businesses occupy most of the available people in the area. There are plenty of well qualified mining people in Nova Scotia and in the area.
There is an open pit gold mine in the pre-Carboniferous rocks south of Middle Musquodoboit.
The existing surface rights are sufficient for mining operations.
The Scotia Mine has excellent infrastructure in place including processing facilities, waste dumps, a tailings pond, grid-power, all-season port terminal access, and paved highways. (Highway 224 may be subject to spring weight restrictions). The mine site infrastructure is well established, as it has been on high level care & maintenance since 2009. ScoZinc equipment and spare parts asset inventory is assessed at approximately \$5.3 million. Water for mineral processing is provided from pit perimeter wells designed to un-saturate the pit slopes and to provide clean water to the plant for optimal water quality. Water may also be sourced from the tailings
pond. Additional water is sourced from the nearby Gays River and treated for potable water site needs and fire suppression. ScoZinc expects most of its workforce will be sourced from the region.
The Tailings Storage Facility ("TSF") is permitted with 8 million tonnes of capacity. ScoZinc intends to either seek approval to expand the capacity by 6 million tonnes or use a sink-float process to separate any clean carbonates which could be sold as agricultural lime, thus reducing the space required for the extra tonnage.
The Scotia Mine mill, which was designed and built in 1978 and 1979, has both a zinc circuit and a lead flotation circuit. The plant was built with a rated capacity of 1,350 tonnes per day; however, it has operated for extended periods at a rate in excess of 2,000 tonnes per day.
Storage and ship loading facilities for lead and zinc concentrates are available at the port of Sheet Harbour, a distance of eighty kilometres from the mine site over paved roads and at the port of Halifax, which has two container terminals. There is also a railway siding is located in Milford, eight road-kilometres from the site and at Shubenacadie.
History
The Main Zone was discovered in 1973 by the Imperial Oil Enterprises ("Esso")/Cuvier Mines joint venture. Esso initiated mine development in 1978 and commissioned the mill in 1979. From 1979 to 1981 the mine produced 554,000 tonnes of ore containing 2.1% Zinc and 1.4% Lead. The mine closed in 1982 due to ground water inflow and operating losses caused by low metal prices.
Seabright Resources Inc. acquired the mine and mill in 1984. Seabright was acquired by Western Mining Corporation (Westminer) in 1988 a review of the potential for mining the deposit was undertaken. Following completion of feasibility studies in 1989, the underground workings were dewatered and test mining was carried out. A total of 187,000 tonnes were mined over a fifteen-month period with average grades of 7.47% Zinc and 3.50% Lead. In 1991, production was suspended again due to groundwater inflow and economic considerations. In 2006, Acadian Gold Corp ("Acadian Gold") purchased 100% of ScoZinc and all of its assets (consisting mainly of Scotia Mine and its infrastructure) from OntZinc for \$7million. In 2007, ScoZinc purchased the remaining 2% NSR.
ScoZinc reactivated the mill and surface-mined the Main Zone during 2007 and 2008. Depressed metal prices forced ScoZinc to place the mine on care-and-maintenance status. In February 2011, Selwyn Resources Limited ("Selwyn") purchased ScoZinc and all of its assets, including the Scotia Mine and ScoZinc's exploration claims, for \$10 million less a deduction relating to increased reclamation bonding requirements that were being determined at the time of the acquisition.
| Mill Feed | Concentrate Produced | Metal Recover (%) | |||||||
|---|---|---|---|---|---|---|---|---|---|
| Tonnes | Pb (%) | Zn (%) | Tonnes Pb |
Tonnes Zn |
Pb (%) | Zn (%) | Pb (%) | Zn (%) | |
| Esso (1979-1981) | 550,000 | 1.4 | 2.1 | 10,000 | 17,000 | 73.6 | 61.5 | 95.6 | 90.5 |
| WMC (1989-1991) | 190,000 | 3.5 | 7.5 | 8,000 | 21,000 | 75.6 | 61.2 | 90.9 | 90.2 |
| ScoZinc, 2007 | 337,000 | 0.85 | 2.14 | 3,359 | 8,694 | 64.4 | 75.5 | 55.4 | 66.7 |
| ScoZinc, 2008 | 718,271 | 1 | 2.7 | 8,535 | 27,729 | 70.1 | 81.6 | 81.6 | 79.9 |
| Total | 1,795,271 | 1 | 2.92 | 29,894 | 74,423 | 72.1 | 87.8 | 58.6 | 83.2 |
Table 1-1: Summary of Past Production of Lead and Zinc Concentrate from the Scotia Mine
Geology and Mineralization
The Gays River flows over the deposit to the Shubenacadie River which flows north to the Minas Basin.
The zinc and lead sulphides are hosted by a Carboniferous age dolomitized carbonate barrier reef complex that grew upon an eroded Cambrian Ordovician anticline as the ocean invaded the Maritime Basin. This barrier reef restricted water flow between the Shubenacadie basin and the smaller Musquodoboit basin. The reef faced the Shubenacadie basin side and started as a coral reef in clean marine waters. The Shubenacadie Basin itself was restricted and evaporites eventually filled the basins, covering the reef and locking in the hydrocarbons that accumulated in the fore reef. Magnesium rich waters dolomitized the reef and probably hot metal brines carried zinc and lead chlorides to the reef were they precipitated as sulphides.
The zinc-lead deposit consists of three main zones of mineralization referred to as the Main (formerly Gays River deposit), Getty and Northeast Zones. The Main Zone lies along the Southside of the Gays River, immediately east of the confluence with the Gays River South Branch. The Getty Zone lies just northwest of the zone on the western side of Gays River. The two Zones are separated by less than one kilometre.
Deposit Types
Industrial minerals on the property include the gypsum, sand and gravel, cretaceous clay found in the trench, the limestone and clean Goldenville quartzite are available on site. Scotia Mine is close to the metropolitan area of HRM with a demand for building materials and it is close to the ocean, so a large market is available.
Market Studies and Contracts
With the addition of the industrial mineral gypsum, the ScoZinc's Scotia Mine has an opportunity to vertically integrate as a producer of products for plastering, absorbents, agricultural fertilizer and soil conditioner, and of course exporting gypsum for wallboard.
Mineral Resource Estimates
Only Mineral Resources are estimated in this report. No Mineral Reserves are identified and no capital and operating costs are discussed. This update focusses solely on added gypsum resources to the mineral resources previously reported by Carew et al, in 2020.
The author considers the base metal Mineral Resources and base metal Mineral Reserves stated in the 2020 Pre-Feasibility Study to be current and these are unchanged from the values stated in the report. That report was prepared by Ausenco Engineering Canada Inc. ("Ausenco"), MineTech International Limited ("MineTech"), SRK Consulting (U.S.), Inc. ("SRK"), and Terrane Geoscience Inc. ("Terrane"), with assistance from ScoZinc technical personnel.
Gypsum resources were estimated using the optimized pit shell that was used to estimate the zinc and lead resources in July 2020.
The estimate used 59 gypsum assays from 13 previously drilled holes that were distributed within the optimized pit shell. The resource was estimated using GEOVIA GEMS 6.8.2 and it is based on 1,831 surface and underground drill holes and 15,873 samples, of which 1,639 drill holes and a total of 139 assays were included in the modeled gypsum mineralization.
The gypsum resource portion of this update is categorized as Measured, Indicated and Inferred, based on hole spacing, as follows:
- Measured considers two holes within 50m radii. Search ellipse must have at least two of eight octants populated with data.
- Indicated considers two holes within 150m radii.
- Inferred all other blocks estimated in the mineralized zone.
The Scotia Mine Deposit mineral resource summary statement in provided in Table 1-2: Scotia Mine Resource Statement Update, Feb 14th, 2021, with an effective date of December 14th, 2019.
| Gypsum | |||||||
|---|---|---|---|---|---|---|---|
| Classification | Zone | Tonnage | Zn | Pb | ZnEQ | Tonnage | Gypsum |
| (kt) | (%) | (%) | (%) | kt) | (%) | ||
| Getty | 60 | 1.38 | 1.25 | 2.58 | 0 | 0 | |
| Measured | Main | 4,130 | 2.57 | 1.30 | 3.81 | 1,310 | 93.0 |
| (M) | North East | 130 | 3.18 | 1.88 | 4.98 | 220 | 91.9 |
| Total | 4,320 | 2.57 | 1.32 | 3.83 | 1530 | 92.8 | |
| Getty | 8,090 | 1.24 | 0.81 | 2.02 | 0 | 0 | |
| Getty South | 840 | 1.58 | 0.25 | 1.82 | 0 | 0 | |
| Indicated | Main | 9,870 | 1.92 | 1.01 | 2.89 | 2,500 | 92.7 |
| (I) | North East | 2,330 | 2.88 | 1.15 | 3.98 | 1150 | 88.7 |
| Total | 21,130 | 1.75 | 0.92 | 2.64 | 3650 | 91.4 | |
| Getty | 8,150 | 1.24 | 0.82 | 2.03 | 0 | 0 | |
| Getty South | 840 | 1.58 | 0.25 | 1.82 | 0 | 0 | |
| M & I | Main | 14,000 | 2.11 | 1.09 | 3.16 | 3,810 | 92.8 |
| North East | 2,460 | 2.89 | 1.19 | 4.04 | 1370 | 89.2 | |
| Total | 25,450 | 1.89 | 0.99 | 2.84 | 5180 | 91.8 | |
| Getty | 950 | 1.35 | 0.54 | 1.87 | 0 | 0 | |
| Getty South | 770 | 1.53 | 0.25 | 1.77 | 0 | 0 | |
| Inferred | Main | 2,980 | 1.49 | 0.79 | 2.25 | 250 | 92.2 |
| North East | 310 | 2.01 | 0.74 | 2.72 | 540 | 90.7 | |
| Total | 5,010 | 1.50 | 0.66 | 2.13 | 790 | 91.2 |
| Table 1-2: Scotia Mine Resource Statement Update, Feb 14th, 2021 – MineTech International Ltd. | ||||||
|---|---|---|---|---|---|---|
- Mineral Resources are not Mineral Reserves and do not have demonstrated economic viability. There is no certainty that any part of the Mineral Resources estimated will be converted into Mineral Reserves;
- Determination of reasonable prospects of eventual economic extraction was based on assumed prices for zinc of US\$1.35/lb, and for lead of US\$1.14/lb, a Zn recovery of 86% and a Pb recovery of 93%, mining and processing costs varying by zone, and pit slopes of 45 degrees in rock and 22 degrees in overburden (see table 3);
- Near surface resources are reported based on a Zinc equivalent (ZnEq) grade of 0.90% and a gypsum grade of 80%. The ZnEq grade incorporates Zn and Pb sales costs of US\$0.19/lb and US\$0.11/lb respectively, and a 2% royalty fee; and
- Numbers in the table have been rounded to reflect the accuracy of the estimate and may not sum due to rounding
- Gypsum volumes were reduced 10% to account for un-modeled Karst topography
Statement Update, Feb 14th, 2021, with an effective date of December 14th, 2019.
| Classification | Zone | Tonnage | Zn | Pb | ZnEQ |
|---|---|---|---|---|---|
| (kt) | (%) | (%) | (%) | ||
| Getty | 60 | 1.38 | 1.25 | 2.58 | |
| Measured | Main | 4,130 | 2.57 | 1.30 | 3.81 |
| (M) | North East | 130 | 3.18 | 1.88 | 4.98 |
| Total | 4,320 | 2.57 | 1.32 | 3.83 | |
| Getty | 8,090 | 1.24 | 0.81 | 2.02 | |
| Getty South | 840 | 1.58 | 0.25 | 1.82 | |
| Indicated | Main | 9,870 | 1.92 | 1.01 | 2.89 |
| (I) | North East | 2,330 | 2.88 | 1.15 | 3.98 |
| Total | 21,130 | 1.75 | 0.92 | 2.64 | |
| Getty | 8,150 | 1.24 | 0.82 | 2.03 | |
| Getty South | 840 | 1.58 | 0.25 | 1.82 | |
| M & I | Main | 14,000 | 2.11 | 1.09 | 3.16 |
| North East | 2,460 | 2.89 | 1.19 | 4.04 | |
| Total | 25,450 | 1.89 | 0.99 | 2.84 | |
| Getty | 950 | 1.35 | 0.54 | 1.87 | |
| Getty South | 770 | 1.53 | 0.25 | 1.77 | |
| Inferred | Main | 2,980 | 1.49 | 0.79 | 2.25 |
| North East | 310 | 2.01 | 0.74 | 2.72 | |
| Total | 5,010 | 1.50 | 0.66 | 2.13 |
Table 1-3: Scotia Mine Base Metal Resources
Table 1-4: Conversion of Mineral Resources to Mineral Reserves
| Mineral Resources | Mineral Reserves | Conversion Factor1 | ||||||
|---|---|---|---|---|---|---|---|---|
| Measured | Indicated | Total | Proven | Probable | Total | Measured/ | Indicated/ | Total |
| Proven | Probable | |||||||
| 21.13 | 4.32 | 25.45 | 10.29 | 3.37 | 13.65 | 49 | 78 | 54 |
| 2.57 | 1.75 | 1.89 | 2.46 | 1.88 | 2.02 | 75 | 52 | 57 |
| 1.32 | 0.92 | 0.99 | 1.21 | 1.07 | 1.10 | 71 | 57 | 60 |
Note 1: Metal conversion factors reflect total metal content.
The gypsum Mineral Resources are tabulated below.
| Classificatio | Gypsum | |||
|---|---|---|---|---|
| n | Zone | Tonnage | Tonnage | Gypsum |
| (kt) | kt) | (%) | ||
| Getty | 60 | 0 | 0 | |
| Measured | Main | 4,130 | 1,310 | 93.0 |
| (M) | North East | 130 | 220 | 91.9 |
| Total | 4,320 | 1530 | 92.8 | |
| Getty | 8,090 | 0 | 0 | |
| Getty South | 840 | 0 | 0 | |
| Indicated | Main | 9,870 | 2,500 | 92.7 |
| (I) | North East | 2,330 | 1150 | 88.7 |
| Total | 21,130 | 3650 | 91.4 | |
| Getty | 8,150 | 0 | 0 | |
| Getty South | 840 | 0 | 0 | |
| M & I | Main | 14,000 | 3,810 | 92.8 |
| North East | 2,460 | 1370 | 89.2 | |
| Total | 25,450 | 5180 | 91.8 | |
| Getty | 950 | 0 | 0 | |
| Getty South | 770 | 0 | 0 | |
| Inferred | Main | 2,980 | 250 | 92.2 |
| North East | 310 | 540 | 90.7 | |
| Total | 5,010 | 790 | 91.2 |
Table 1-5: Scotia Mine Gypsum Resource Statement
Source: MineTech, 2021
Notes:
- Determination of reasonable prospects of eventual economic extraction was based on assumed prices for zinc of US\$1.35/lb, and for lead of US\$1.14/lb, a Zn recovery of 86% and a Pb recovery of 93%, mining and processing costs varying by zone, and pit slopes of 45 degrees in rock and 22 degrees in overburden (see table 3).
- Near surface resources are reported based on a Zinc equivalent (ZnEq) grade of 0.90% and a gypsum grade of 80%. The ZnEq grade incorporates Zn and Pb sales costs of US\$0.19/lb. and US\$0.11/lb. respectively, and a 2% royalty fee; and
- Numbers in the table have been rounded to reflect the accuracy of the estimate and may not sum due to rounding
- Gypsum volumes were reduced 10% to account for the Karst topography
Economic Analysis
The main source of revenue for the Scotia Mine property is the carbonate hosted zinc lead deposit; however, the industrial minerals could become a source of steady income.
There is no royalty on gypsum as gypsum belongs to the holder of the surface rights. However, there is a Gypsum Mining Tax at the rate of thirty-three and one-third per cent upon his net income derived from mining operations.
Anhydrite is a mineral and subject to a royalty of 14 cents per short ton, \$0.154/metric tonne. The other royalty on the zinc and lead minerals to the Crown is outlined in section 82 of the Mineral Resources Regulations: "Unless otherwise provided in Section 81 and subsection (2), an operator must pay an annual royalty of the greater of the following: 2% of the net revenue from mining and 15% of all net income from mining."
The zinc and lead deposit is the primary expected source of revenue at the Scotia Mine Property. Other potential revenue sources are sand and gravel, the gypsum, and possibly agricultural limestone if the lead values can be removed, as well as crushed rock and forest products.
The 2020 Prefeasibility Study was based on optimization work completed by the Scotia Mine staff in early 2020 and late 2019. The study assumed a truck and shovel operation and conventional flotation concentrate that would be shipped to port in containers.
The results of the 2020 study indicate a Base Case pre-tax Net Present Value ("NPV") of \$156.4 million using a 5% discount rate, with an Internal Rate of Return ("IRR") of 52.3% and a post-tax NPV (5%) of \$114.6 million, with a post-tax IRR of 48.6%.
The pre-taxation and post-taxation NPVs for the Base Case with the project's expected IRRs are illustrated in the table below, all at a Canadian/US dollar exchange rate of 1.41:1.
| Financial Analysis | Before-Tax | After-Tax | |
|---|---|---|---|
| NPV (8% discount rate) | \$156.4M | \$114.6M | |
| NPV (5% discount rate) | \$205.8M | \$150.4M | |
| IRR | 52.3% | 48.6% | |
| EBITDA (annual average) | \$17.1M | ||
| Payback period | 2.4 years |
Table 1-6: Project Economic Results
The 2020 PFS indicates an average annual production of approximately 33,313 tonnes of zinc concentrate and 10,189 tonnes of lead concentrate, containing approximately 35 million pounds of zinc and 15 million pounds of lead per 12-month period over the life of the mine. Average annual earnings before interest, taxes, depreciation and amortization ("EBITDA") are \$17.1 million per year and cumulative EBITDA earnings of \$353 million over a mine life of 14 years, using Base Case metal price forecasts of US\$1.16 per pound initially for zinc and US\$0.83 per pound for lead. Pre-production Capital Costs, including refurbishment and upgrades to the processing plant, pre-commercial production costs and mining pre-stripping costs are estimated at \$29.7 million, including \$2.7 million contingency, with a payback of 29 months (2.4 years) from commercial production.
Environmental Studies, Permitting, and Social or Community Impact
Environmental responsibility and stewardship have been and continue to be a priority to ScoZinc. To that end, there are extensive monitoring programs at the Scotia Mine including but not limited to: Surface Water quality, Groundwater quality, Wetland, Wildlife and Vegetation. These programs have continued throughout care & maintenance and will be implemented for operations.
Roughly half of the mineral resources used in the economic analysis are already under permit.
Scotia Mine is on the traditional lands of the Mi'kmaq community of the Millbrook First Nation of Truro. Millbrook also have Reserve Land located in Cole Harbour, Sheet Harbour and Beaver Dam.
Recommendations
Calcining and screening tests for processing the gypsum into the higher value calcined gypsum are recommended. Bench scale laboratory work to characterize the gypsum would be followed by a market study to determine the customer specifications and ideally, obtain letters of interest from end users for the calcined gypsum products. Potential markets for the gypsum are cement plants, agricultural outlets and a plaster producing factory. A factory could be set up at the Scotia Mine site and the product sent by ocean transport in containers, as is planned for the lead and zinc concentrate.
To convert the gypsum Mineral Resources to gypsum Mineral Reserves, a market must be established for the material. This will take bench scale laboratory work.
Sink-float testing is recommended for the base metals minerals. These tests are screening the material and testing each size fraction using heavy liquids with densities. This system was recently installed at Glencore's McArthur River (sphalerite and carbonates) mine with good results. They reduced the amount and upgrading the grade of the mill feed with the loss of about 5% of the metal (Strohmay and Cameron, 2015)
The cost of these studies, including laboratory work, plant design and cost estimating would be in the order of \$100,000.
2 Introduction and Terms of Reference
2.1 Issuer
This Report was prepared for ScoZinc Mining Ltd. and the responsibility for disclosure remains with ScoZinc Mining Ltd. ScoZinc Limited is a wholly owned subsidiary of ScoZinc Mining Ltd.
2.2 Terms of Reference
ScoZinc Limited, on behalf of ScoZinc Mining Ltd., engaged MineTech International Limited in March 2021 to complete a NI 43-1011 report adding a gypsum mineral resource to the update of by July 2020 report by Carew et al. The report will be published on CSA's "System for Electronic Document Analysis and Retrieval" ("SEDAR").
2.3 Purpose of Report
The purpose of this report is to update the mineral resources based on converting the gypsum, which was treated as waste in previous studies and reports, into a categorized resource.
2.4 Basis of Technical Report
This Technical Report is an update of the Technical Report completed on July 29th , 2020. This report reviewed the gypsum mineral market and the technology to upgrade the gypsum to higher value products such as calcined gypsum (Plaster of Paris). Several sections from reports authored by other consultants have been directly quoted from the 2020 Carew report, in this report. These indicated in the appropriate sections.
Digitised and hard copy material for all exploration activity since inception of exploration on the property was supplied by ScoZinc Mining Ltd. ("ScoZinc").
Cullen et al (2011) described the Getty portion of the Scotia Mine deposit in a report titled, "Technical Report on a mineral resource estimate, Getty Deposit." And their work is used to describe that deposit in this report.
2.5 Site Visits
The most recent site visit dates of Mr. Hannon, the qualified person for this report was November 20th, 2020.
2.6 Units of Measure
Unless otherwise stated, all units used in this report are metric. Unless otherwise stated, the legal currency used is the Canadian dollar.
1 National Instrument 43-101 "Standards of Disclosure for Mineral Projects" Canadian Securities Administrators
2.7 Site Grid Parameters
A site mine grid was used throughout the report. The grid is a simple translation with almost no rotational deviation from the Nova Scotia Grid, which is a 3° Modified Transverse Mercator projection using an ATS 77 datum. Based on the site mine grid offset from the Nova Scotia grid, the elevation datum is mean sea level plus 500.11 metres. For reference, the co-ordinates of two points, in both site and Nova Scotia grids, are reported in Table 2-1.
The same site grid was used for both the Main and Getty Zones.
| Scotia Mine Site | |||||||
|---|---|---|---|---|---|---|---|
| Control | Mine Grid | ATS 77, NS Grid | |||||
| Monument | Site Grid North (m) |
Nova Scotia Grid East (m) |
Elev. MSL+500 (m) |
North (m) | East (m) | Elev. (m) | |
| No. 4 | 6,869.72 | 8,597.50 | 531.33 | 4,988,509.11 | 5.591,210.89 | 31.25 | |
| No. 7 | 7,019.95 | 8,866.55 | 530.69 | 4,988,659.37 | 5,591,479.94 | 30.58 |
2.8 QP Declaration
The author (Patrick Hannon, M.A.Sc., P.Eng. of MineTech International Limited) has revised the recent Technical Report on the property by added the industrial mineral gypsum in this report, updating the base metal prices, MineTech's recommendations and conclusions.
The work of the authors of the 2020 Technical Report (Timothy Carew, P.Geo. of SRK Consulting U.S., Inc. Tony Gilman, M.Sc., P.Eng. of Terrane Geoscience Inc. and Tommaso Roberto Raponi, P.Eng. of Ausenco Engineering Canada Inc.) is considered current and is repeated in this report for completeness.
2.9 Effective Date
This report has an effective date of March 22nd, 2021.
3 Reliance on Other Experts
The author of this report has not relied on any other expert in the preparation of this report.
All work in the 2020 report was completed by Qualified Persons (Carew, et. al. 2020).
4 Property Description and Location
4.1 Area of the Property
ScoZinc currently holds five exploration licenses covering 41 claims in the immediate vicinity of the Scotia Mine Deposit. In total, the 41 claims cover approximately 664 hectares (1,641 acres).
4.2 Location and Access
The Scotia Mine ("the Property") is located approximately sixty kilometres northeast of Halifax, Nova Scotia in the community of Gays River in the Halifax Regional Municipality ("HRM"). The entrance to the property from paved highway 224 is at latitude 45.03° North, longitude 63.33° West. The UTM coordinates for the gate are 4 986 550 m North 474 190 m East (NAD 83(CSRS), UTM zone 20N).
Scotia Mine is on the traditional lands of the Mi'kmaq community of the Millbrook First Nation of Truro. Millbrook also have Reserve Land located in Cole Harbour, Sheet Harbour and Beaver Dam. The Millbrook First Nation has been developing their land in Truro over the past decade, building the Millbrook Power Centre which includes office buildings, theaters, casinos, restaurants, service stations, fast food outlets, and other services. They are also developing their Cole Harbour land, by building apartment buildings and an office building for General Dynamics (https://www.millbrookband.com/).


Figure 4-2: Scotia Mine Location Relative to Halifax
4.3 Exploration Land Status
The Property encompasses the Getty, Main and North-East zones of the Scotia Mine deposit and consists of 615 hectares of mineral rights, including land with exploration potential for zinc/lead mineralisation, and 568.4 hectares of land ownership (real property) (Figure 4-3 and Figure 4-4 below).
The Getty Zone property consists of 62 contiguous mineral claims, of approximately 992 hectares.

Figure 4-3: Exploration Licenses, Mineral Leases, and Real Property Boundary (Surface Rights)

Figure 4-4: Real Property Map, ScoZinc Limited


4.3.1 Exploration Licenses
ScoZinc currently holds five exploration licenses covering 41 claims in the immediate vicinity of the Scotia Mine Deposit (Figure 4-5). Each individual claim covers an area of approximately forty acres (16.2 hectares). In total, the 41 claims cover approximately 664 hectares (1,641 acres).These licenses are located along strike from the Scotia Mine Deposit and include favourable host rocks similar to that at the mine site.
Exploration License no. 06959 covers the Getty Zone of the Scotia Mine deposit.
All exploration licenses were in good standing and registered to ScoZinc Limited as of January 27th, 2020. Issue dates range from May 2 nd, 1997 to May 6 th , 2006. The ScoZinc exploration licenses are summarized in Table 4-1. Table 4-2 through to Table 4-6 provide details on each ScoZinc exploration licenses in the immediate vicinity of the Scotia Mine Deposit.
Source: ScoZinc, 2019
| Exploration License | Number of | Claim Reference | Issue |
|---|---|---|---|
| Number | Claims | Map | Date |
| 6268 | 20 | 11E/03B | May 2, 1997 |
| 06959 (Getty Zone) | 16 | 11E/03B | October 20, 2006 |
| 8936 | 1 | 11E/03B | December 21, 2009 |
| 9069 | 1 | 11E/03B | August 19, 2005 |
| 51016 | 3 | 11E/03B | May 6, 2016 |
Table 4-1: Summary of ScoZinc Exploration Licenses
Table 4-2: Exploration License 06268 (20 Claims)
| Claim Reference Map |
Tract | Claims | Anniversary Date |
Issue Date |
|---|---|---|---|---|
| 19 | ABCDEFGHLMN | |||
| 11E/03B | 18 | ABCEFGH | May 2, 2021 | May 2, 1997 |
| 7 | NO |
Table 4-3: Exploration License 06959 (Getty Zone, 16 Claims)
| Claim Reference Map |
Tract | Claims | Anniversary Date | Issue Date |
|---|---|---|---|---|
| 30 | BCDEFGHJKLM | |||
| 11E/03B | 31 | ABGHJ | October 20, 2021 | October 20, 2006 |
Source: ScoZinc, 2019
Table 4-4: Exploration License 08936 (1 Claim)
| Claim Reference Map |
Tract | Claims | Anniversary Date | Issue Date |
|---|---|---|---|---|
| 11E/03B | 18 | P | December 21, 2021 | December 21, 2009 |
Source: ScoZinc, 2019
Table 4-5: Exploration License 09069 (1 Claim)
| Claim Reference Map |
Tract | Claims | Anniversary Date | Issue Date |
|---|---|---|---|---|
| 11E/03B | 28 | F | August 19, 2021 | August 19, 2005 |
Source: ScoZinc, 2019
Table 4-6: Exploration License 51016 (3 Claims)
| Claim Reference Map |
Tract | Claims | Anniversary Date | Issue Date |
|---|---|---|---|---|
| 11E/03B | 5 | QKJ | May 6, 2016 | May 6, 2021 |
4.3.1.1 Royalty Agreement
Exploration License 06959, which covers the Getty Zone of the Scotia Deposit, is subject to an agreement between ScoZinc Limited and Globex Resources Ltd., which provides Globex with a 1% Net Smelter Return (NSR) royalty interest in the associated claims. Agreement terms allow ScoZinc to purchase 50% of the NSR for \$300,000. The original agreement, signed in 2006, was between Globex Resources and Acadian Mining Corporation, but Acadian assigned the agreement to (its then subsidiary) ScoZinc Limited in May of 2011.
4.3.2 Mineral Leases
Three Mineral Leases, 10-1, 40058 and 40059, entirely cover the Main and Northeast Zones of the Scotia Mine Deposit, and this includes the existing Scotia Mine infrastructure. The Mineral Leases convey the mining rights to all minerals except coal, uranium, salt and potash.
Mineral Lease 10-1, consisting of 38 claims, was originally granted by the Nova Scotia Government to Westminer Canada Limited on April 2 nd, 1990, and subsequently renewed for an additional 20-year term on April 2 nd, 2010. Mineral Lease 10-1 was originally granted as a "Mining Lease." However, changes to the Nova Scotia Mineral Resources Act that came into effect in November 2004 changed the terminology such that existing "Mining Leases" are now known as "Mineral Leases." The anniversary date of Mineral Lease 10-1 is April 2 nd of each year, and the expiry date is April 2 nd, 2030, at which time the lease may be renewed again.
Mineral Leases 40058 and 40059, consisting of just 1 claim each and covering a portion of the Southwest Expansion area of the Main Zone, were issued by the Nova Scotia Government for a 20-year term on October 2 nd, 2013. The anniversary date of Mineral Leases 40058 and 40059 is October 2 nd of each year, and the expiry date is October 2 nd, 2033, at which time they may be renewed.
Table 4-7 lists the claims comprising the Mineral Leases, while Figure 4-5 shows the location of the three leases.
4.3.2.1 Reclamation Bond
The Nova Scotia government currently holds a reclamation security (bond) for each of the three Mineral Leases. As of December 31st, 2019, the amount of reclamation security for Mineral Lease 10-1 was \$2,874,285.69, the reclamation security for Mineral Lease 40058 was \$10,949.48, and the reclamation security for Mineral Lease 40059 was \$10,949.48. As of December 31st, 2019, the reclamation security for the three Mineral Leases totaled \$2,896,184.65.
| Tract | Claims | Number of Claims |
|---|---|---|
| 5 | NOP | 3 |
| 19 | JKPQ | 4 |
| 20 | BCDE FGK LMNO PQ | 13 |
| 28 | DEKL MNOP | 8 |
| 29 | ABCD FGH JKQ | 10 |
| Total | 38 |
Table 4-8: Mineral Lease 40058 (1 Claim), Map Sheet (NTS) 11E-03B
| Tract | Claims | Number of Claims |
|---|---|---|
| 29 | E | 1 |
| Total | 1 |
Source: ScoZinc, 2019
Table 4-9: Mineral Lease 40059 (1 Claim), Map Sheet (NTS) 11E-03B
| Tract | Claims | Number of Claims |
|---|---|---|
| 30 | A | 1 |
| Total | 1 |
Source: ScoZinc, 2019
4.3.3 Surface Rights (Real Property)
ScoZinc Limited owns outright approximately 703 hectares (1,736 acres) of land (real property) within the Scotia Mine Deposit area. These properties encompass the entire surface infrastructure of the existing mine and most of the resource within the Main and Northeast Zones of the deposit (refer to Table 4-10 and Figure 4-4). The boundaries were established through legal surveys.
| Property Identification Number (PID) | Area (ha) | Area (ac) |
|---|---|---|
| 369363 | 20.23 | 50.00 |
| 373423 | 2.29 | 5.65 |
| 373621 | 40.47 | 100.00 |
| 522201 | 35.13 | 86.80 |
| 522623 | 32.10 | 79.33 |
| 20080495 | 23.24 | 57.42 |
| 20080511 | 4.05 | 10.00 |
| 20080529 | 3.52 | 8.70 |
| 20158176 | 1.78 | 4.40 |
| 20158184 | 2.43 | 6.00 |
| 20223418 | 1.81 | 4.48 |
| 20313250 | 0.65 | 1.60 |
| 20416384 | 1.21 | 3.00 |
| 40227951 | 46.70 | 115.40 |
| 40227969 | 2.27 | 5.60 |
| 40227985 | 0.29 | 0.72 |
| 40290256 | 49.21 | 121.60 |
| 40290264 | 43.64 | 107.83 |
| 40291452 | 220.56 | 545.00 |
| 40312092 | 13.35 | 33.00 |
| 40746786 | 24.12 | 59.60 |
| 40757577 | 73.35 | 181.26 |
| 40763872 | 13.76 | 34.00 |
| 41094400 | 33.04 | 81.63 |
| 41239542 | 0.01 | 0.03 |
| 41283268 | 10.12 | 25.00 |
| 41358128 | 0.57 | 1.40 |
| 41358136 | 2.83 | 7.00 |
| Total | 702.73 | 1,736.45 |
Table 4-10: Property Ownership, ScoZinc Limited
4.3.3.1 Getty Zone
Cullen et al (2011) described the surface or real property rights that cover the Getty Zone:
"Acadian advised Mercator that surface rights to lands covering the Getty Zone are owned under separate titles by Allan Benjamin, David Benjamin and Heather Killen. Mercator did not review the access agreements for purposes of this report but assumes that similar access permission to enter the lands for exploration purposes will be established by Selwyn. The mineral exploration claims and permits currently in place with respect to the Getty project are adequate for execution of technical programs recommended in this report. Permits necessary to do the proposed program will be applied for as required. There is adequate suitable land within the claim area for the recommend work program and future mining activities; however, Selwyn does not hold surface rights to this land. Selwyn will negotiate suitable purchase arrangements when the economic viability of the project has been demonstrated."
4.4 Aggregate Lease
An aggregate lease covers the Scotia Mine property (Main Zone). Gallant Aggregates signed a thirty-year lease agreement to mine and remove aggregate from the property at a cost of one dollar per tonne of material that is removed from the property. The lease was signed on May 15th, 2003 and entitled Gallant, with certain limitations, to mine anywhere on ScoZinc's land. The agreement contains a renewal clause and gives Gallant the right of first refusal to purchase the surface rights (real property titles). A major condition of Gallant's lease is that metal mining takes precedence over aggregate mining. Therefore, Gallant's lease would not interfere with zinc and lead mining operations.


In January 2008, Gallant exercised its option under the Gallant Agreement to purchase approximately 25 acres of the Scotia Mine property. Concurrent with the transfer of the property, ScoZinc and Gallant executed a License, Option and Royalty, which terminated the Original Agreement and granted Gallant the right to access the Scotia Mine property to access existing water infrastructure and to obtain electrical power. The License, Option and Royalty Agreement grants Gallant the right to remove, extract and process sand, gravel, fill and obtain materials from the over burden and waste material created by ScoZinc at the Scotia Mine site for the greater of \$25,000 per annum or \$1.00 per metric tonne. In addition, Gallant has a right of first refusal to purchase the Scotia Mine property if ScoZinc plans to sell the property after mining operations are completed or abandoned.
4.5 Environmental
Between 1997 and 2000 work proceeded on an Environmental Registration Document. This document, which was submitted with the regulatory authorities in September 1999, addressed the environmental concerns of a surface and underground mining operation along with the diversion of a 500-metre section of the Gays River to accommodate the pit design. On August 4th, 2000, the Open-Pit Lead/ Zinc Mine and River Diversion Project proposed by Pasminco Resources Canada Company received Environmental Assessment approval.
The Environmental Registration Document covered only part of the deposit. This area was mined by ScoZinc Limited in 2007-2008. Mineral resources in this area have not been exhausted. However, additional Environmental Assessment work is required before the mine can expand very far outside of its current footprint, either west along strike in the Main Zone or northeast, across Gays River to the Northeast Zone.
On October 7th, 2011, Selwyn received approval from Nova Scotia Environment, a department of the provincial government, for its proposed Southwest Expansion of the previously mined Main Pit. On May 18th, 2012 Selwyn received an amended Industrial Approval allowing expansion of the existing mine to include the Southwest Expansion of the previously mined Main Pit.
Prior to expansion outside the currently permitted area, updated plans would have to be approved by the Nova Scotia government and an updated Industrial Approval (essentially an environmental operating permit) would be required.
5 Accessibility, Climate, Local Resources, Infrastructure and Physiography
5.1 Topography and vegetation
Scotia Mine is situated in undulating topography with the higher hills to the northeast of the mine reaching 150 m. The pre-Carboniferous rocks are resistant to erosion compared to the younger rocks. The younger rocks situated in the northeast trending valleys have elevations between 30 m and 60 m. Glacial till from the erosional particles of the Carboniferous carbonates and sandstones makes a good soil.
Most of the land area is in productive forest. The main species are red spruce, balsam fir, black spruce, hemlock, white pine, white spruce, maple and birch (MacDougall and Cann, 1963).
5.2 Accessibility
The Scotia Mine Deposit is located approximately sixty kilometres northeast of Halifax, Nova Scotia along the border between Colchester and Halifax Counties.
Access to the Property is by paved roads and is approximately fifteen kilometres off the Highway 102, along Route #224. The Halifax International Airport is located twenty kilometres southwest of the mine site.
Portions of Highway #224 and Highway #277 are subject to spring weight restrictions. Truck weights are limited for a period that normally lasts six weeks.
5.3 Climate
The climate at the Scotia Mine allows for exploration, mining and construction operations to continue throughout the year. The climate is moderated by the Atlantic Ocean, about 40 km southeast of the property.
The closest weather station is in village of Middle Musquodoboit, approximately 15 km east of the Property.
The mean maximum daily temperature is 24.6°C; in February, the mean minimum daily temperature is –11.1°C. Summer design temperature for buildings and equipment is 27°C; winter design temperature is –18°C. Mean annual total precipitation in Middle Musquodoboit is 1,180 mm. Average monthly rainfall ranges from 60.4 mm in February to 123.5 mm in November. Average monthly snowfall ranges from 41.2 cm in February to nil between June and September. All climate data is from the Environment Canada "Canadian Daily Climate Data" database.

Figure 5-1: Temperature Averages, Middle Musquodoboit
Figure 5-2: Precipitation, 1% of Precipitation Events Yield Over 45 mm of Rain in 24 Hours (100-Year Storm Event)

5.4 Local Resources & Infrastructure
5.4.1 Local Resources


The property is well situated with respect to utilities, three phase electric power, all season paved roads, and transportation links. The Halifax International Airport, Via Rail and the CNR railway line is just west of the site.
The natural gas pipeline between Goldboro and Halifax passes close to the site.

Figure 5-4: Natural Gas Pipeline Between Goldboro and HRM
Ocean shipping of containers is available from the deep-water ports of Halifax and Sheet Harbour. The Halifax area and the Truro area can supply and repair heavy mining equipment.
There is a well-educated well-trained workforce available in the area. There are two large open pit mines in the area, Atlantic Gold near Middle Musquodoboit (employing about 300 people) and National Gypsum at Dutch Settlement (employing about 100 people).
5.5 Physiography
The property is in a rural-residential area of central Nova Scotia that is typified by rolling topography and abundant surface water. The Main zone lies along the south side of the Gays River main branch, immediately east of the confluence with the Gays River south branch. The Getty Zone lies immediately west of the Main Zone, on the north side of Highway 224.
The Gays River water shed is characterized by gently rolling topography, having a maximum elevation of 170 m, an extensive cover of deciduous forest, a small population and local agricultural land development. The Gays River at the mine gate has an elevation of about 30m.
Lakes, ponds and rivers are sparsely distributed throughout the watershed. Typical vegetation consists of northern black spruce, balsam fir and juniper with birch in more wet areas. Areas of open bog occur on part of the claims. Currently, parts of the forest are being harvested or thinned.
6 History
Note: Item 6 has no change from Previous NI 43-101 Technical Report by Carew, et al, 2020 except Table 6-1, which had an error in the 2020 report, and the addition of the note and figure regarding the Seabright purchase of Scotia Mine in 1985.
6.1 Modern Pre-mining Exploration
6.1.1 Overview
The Gays River Formation has seen exploration since the 18 th century. Modern exploration on the Gays River Formation began in the early 1970s. Cullen et al note that: "First reports of zinc-lead mineralization in the Gays River area date to the late 1800's and from this time until the 1950's exploration consisted of limited amounts of mapping, pitting, trenching and sampling with up to 3% lead values being reported. Most activities focused on the area immediately around the adjacent Scotia Mine site, particularly along the South Gays River, where an outcropping of the Gays River Formation dolomite hosting low grade zinc and lead mineralization was trenched and drilled in the 1950's in the "Gays River Lead Mines Area" (Campbell, 1952). (Cullen et al, 2011, section 5.2)
6.2 Scotia Mine Deposit Main Zone
The history of the project begins with its discovery in the early 1970's by Cuvier Mines. Cuvier and Imperial Oil Limited ("ESSO") carried out exploration work and delineated the mineralized zone, which was then identified as being four kilometres long, 220 metres wide with depths varying from 20 to 200 metres. Initial development consisted of an exploration decline driven in 1975/76 with mine development starting in 1978 and mill commissioning in October 1979.
From 1979 until 1981, ESSO operated the mine and targeted the lower grade ore using a lower cost, bulk room and pillar mining method approach. Though Esso carried out some test mining in the higher-grade mineralization near the carbonate contact, it was not part of the mine plan at that time. During this period, 554,000 tonnes of lead/zinc ore was mined with an average grade of 2.12% zinc and 1.36% lead (see Table 6-1 below). Due to low metal prices, problems caused by high rates of water influx and difficult ground conditions, mining was suspended in 1981 and the mine was allowed to flood.
| Concentrate Produced | Metal Recovery (%) | ||||||||||
|---|---|---|---|---|---|---|---|---|---|---|---|
| Tonnes | Pb (%) | Zn (%) | Pb tonnes in concentrate |
Zn tonnes in concentrate |
Pb (%) | Zn (%) | Pb (%) | Zn (%) | |||
| Esso (1979-1981) | 550,000 | 1.40 | 2.10 | 10,000 | 17,000 | 73.6 | 61.5 | 95.6 | 90.5 | ||
| WMC (1989-1991) 190,000 | 3.50 | 7.50 | 8,000 | 21,000 | 75.6 | 61.2 | 90.9 | 90.2 | |||
| ScoZinc (2007) | 337,000 | 0.85 | 2.14 | 3,359 | 8,694 | 64.4 | 75.5 | 55.4 | 66.7 | ||
| ScoZinc (2008) | 718,271 | 1.00 | 2.92 | 8,535 | 27,729 | 70.1 | 55.9 | 81.6 | 79.9 | ||
| Total 1,795,271 | 1.36 | 3.01 | 29,894 | 74,423 | 72.1 | 58.6 | 87.8 | 83.2 |
| Table 6-1: Historical Milling Records Compiled by MineTech in 2012 | ||
|---|---|---|
Note: This table is corrected from Table 6-1 presented in the 2020 Technical Report on the Property
In 1985, Seabright Resources purchased the property and modified the mill circuits to treat gold ore from other Nova Scotian properties.
Prior to the purchase, Seabright commissioned an examination of the property by a processing engineer and a mining engineer (Clyde Lendrum Consulting Ltd. and American Mine Services). The purpose of the trip was to provide Seabright Resources Inc. with an opinion as to the quality and capability of the Gays River Mill to treat Gays River ore and to give a professional opinion as to whether the mill could be used to treat gold ore from other Seabright properties and/or on a commercial or custom basis, other mining companies.
Lendrum recommended Seabright do sink/float testing and provided a sketch that explains the process.

Figure 6-1: Figure from the Letter from F. Clyde Lendrum to J.S, Kermeen, VP Seabright Resources Inc., dated May 22, 1985 (Assessment Report ME 1986-084, 1986, 307 page(s), 8 map(s). ISN: 8738
In 1988, Westminer Canada Limited ("WMC") purchased Seabright Resources. WMC began dewatering the underground mine in 1989. Their extraction method was to use narrow vein, cut and fill mining to extract the higher-grade ore zones. The mine was placed back into operation and reached commercial production in March 1990. During the period of operations by WMC (August 1989 to May 1991) the mine produced 190,000 tonnes of ore at an average grade of 7.5% zinc and 3.5% lead. Mining was curtailed due to low metal prices, mining method problems and high rates of water influx. Also, for corporate reasons, WMC decided to focus on larger scale mining ventures. Following suspension of mining at Main Zone Mine, WMC commissioned several studies to characterise the local hydrology of the mine and to control the ground water in the mine. These results were never tested during mining, since a cyclic low in metal prices, among other factors, prompted WMC to place the property up for sale.
In late 1996, Savage Zinc, Inc. purchased the Main Zone Mine property from WMC and formed a wholly owned subsidiary named Savage Resources Canada Company ("Savage"). Savage started to rehabilitate the property, shops, equipment and office with the aim of starting production in 1997.
When Savage took over the operation of the former Main Zone mining facility, the underground workings were flooded to the surface. After purchasing equipment and hiring employees, the mine dewatering phase started on June 7th, 1997. With an installed pumping capacity of 9,000 USGPM, the average pumping rate to reach the 425-metre level was 5,200 USGPM. This level was reached during late August 1997. During this period of dewatering, men and equipment went underground to clean out the workings while management carefully examined the ground conditions. They decided to prepare a mine plan that considered an open-pit design. Later, after much review during a period of depressed metal prices, it was decided to abandon the proposed underground mining activities and keep the mine dewatered to the 425 level. The electrical equipment was removed, and the pumps were shut off on April 1 st, 1998. At present the mine is flooded above the portal.
Savage concluded that an open-pit operation was feasible and initiated environmental permitting, including provisions for a diversion of a portion of the Gays River. The Environmental Assessment plan was approved August 2000. The operating plan was never initiated, probably due to low metal prices at the time.
ScoZinc Limited ("ScoZinc"), purchased by Acadian Mining (ADA: TSX.V) in 2006 as its wholly-owned subsidiary, continued with Savage's plan and surface-mined the deposit during 2007 and 2008. ScoZinc mined 1.1 million tonnes of surface ore and stripped 9.4 million tonnes of over burden (refer to Table 6-1). Due to a drastic plunge of base metal prices nearly coinciding with the mine's re-opening, ScoZinc placed the mine on care-and-maintenance status near the end of 2008.
In 2008, ScoZinc also drilled 17 diamond drill holes through the Northeast Zone (refer to Section 10).
In April 2011, Selwyn Resources Limited ("Selwyn") purchased ScoZinc with plans to reopen the mine amid high and rising metal prices.
An August 2011 Preliminary Economic Assessment ("PEA") of the ScoZinc operation, prepared by Allnorth Consultants Ltd with Colin Fisher, P.Eng., as Qualified Person, found an average earnings before interest, taxes, depreciation and amortization ("EBITDA") for the first three years of operations of \$26.2 million per annum, and an internal rate of return of 63.9%. The PEA was limited to the Main Zone, and did not consider the river diversion discussed in Section 4.6. See the Selwyn press release dated August 30th, 2011 for more information.
6.3 Getty Zone
The following is adapted from Section 5 of Cullen et al (2011): "With the exception of regional soil geochemical surveying by Penarroya Ltd. in 1964 (Rabinovitch, 1967) that did not identify the Getty Zone, no substantial mineral exploration efforts appear to have been carried out on the current Getty property prior to its acquisition by Getty in 1972.
Exploration in the current deposit area was initiated in 1972 by Getty and joint venture partner Skelly Mining Corporation under terms of an option ‐ purchase agreement with Millmore‐Rogers Syndicate".
"Discovery of the Getty zinc‐lead zone is attributed to drill hole GGR‐12 which was completed in 1972 and intersected 4.63 metres of dolomite grading 15.48% combined zinc‐lead, beginning at a down hole depth of 93.11 metres. Subsequent completion of over 200 holes by Getty and Imperial on and around the property served to delineate a nearly continuous mineralized zone measuring approximately 1300 metres in length and up to 200 metres in width (Comeau, 1973, 1974; Comeau and Everett, 1975)".
"Getty retained MPH Consulting Limited ("MPH") to assess three development scenarios for the deposit and Riddell (1976) reported results of this work, which showed that production of 375,000 tonnes per year would be necessary to support a viable, stand‐alone open-pit operation".
"In 1980 economic aspects of developing the deposit based on an in‐house tonnage and grade model were assessed by Esso (MacLeod, 1980). This study concluded that mining through open‐pit methods as an ore supplement to the Main Zone deposit would be economically viable, provided that important operating assumptions were met. The earlier MPH work was also reviewed at this time and some economic models updated. None of the work indicated that profitable stand‐alone development of the deposit could be expected under market conditions of the time. George (1985) subsequently reviewed earlier evaluations and also reached a negative conclusion regarding development potential".
"In 1992 Westminer completed a resource estimate and preliminary economic assessment of the deposit based on Getty drilling results, with potential development in conjunction with the adjacent Main Zone deposit being considered (Hudgins and Lamb, 1992). Results showed that milling of about 550 tonnes per day of Getty ore could be undertaken at a low cost if excess milling capacity at Main Zone was being filled by such material. Westminer also indicated that zinc oxide production from the deposit would result in a substantially better financial return to the mine in comparison with a conventional smelter contract for sulphide concentrates".
"In December 2007 Mercator completed an inferred resource estimate for the property, on behalf of Acadian, which was reported by Cullen et al. (2007) and update by Cullen et al. (2008). Acadian completed a total of 138 new drill holes in support of these estimates." (Cullen et al, 2011, section 5.2).
6.4 Ownership History
6.4.1 Scotia Mine Deposit (Main Zone)
The Scotia Mine Deposit (Main Zone) was discovered in 1973 by the Imperial Oil Enterprises ("Esso") and Cuvier Mines Limited ("Cuvier") joint venture. Esso initiated mine development in 1978, commissioned the mill in 1979, developed the underground mine and began mining and milling.
Seabright Resources Inc. ("Seabright") acquired the Scotia Mine property and mill in 1984. Despite a favourable feasibility study, Seabright did not reactivate the Scotia Mine due to depressed metal prices at the time. Seabright converted the mill for gold processing and processed gold ore from several satellite properties.
The Scotia Mine property was acquired by Westminer Canada Limited ("Westminer"), a Canadian subsidiary of Western Mining Corp of Australia, in 1988, at which time a review of the potential for mining the deposit was undertaken. Westminer dewatered the mine and continued mining and milling.
In 1997, Savage Resources Canada Limited acquired the Scotia Mine assets from Westminer. Savage concluded that an open-pit operation was feasible and initiated environmental permitting, including provisions for a diversion of a portion of the Gays River. Savage was subsequently taken over by Pasminco Resources Canada Company ("Pasminco Resources") and the Environmental Assessment plan was approved by the Nova Scotia Minister of the Environment in August 2000. The operating plan was never initiated.
Regal Mines Limited ("Regal Mines") purchased Pasminco Resources in February 2002. Regal was owned 50% by OntZinc Corporation ("OntZinc") and 50% by Regal Consolidated Ventures Limited ("Regal Consolidated"). As part of the sale, Pasminco Canada Holdings Inc. ("Pasminco Holdings") retained a 2% net smelter return ("NSR") royalty on future production. OntZinc acquired Regal Consolidated's 50% interest in December 2002 to own 100% of Pasminco Resources. Savage Resources Limited was the successor of Pasminco Holdings and held the 2% royalty.
OntZinc later changed its name to Hudbay Minerals Inc. ("Hudbay") after purchasing, through reverse takeover, Hudson's Bay Mining and Smelting in December 2004. Hudbay owned Scotia Mine through its wholly‐owned subsidiary, ScoZinc Limited ("ScoZinc").
In 2006, Acadian Gold Corp ("Acadian Gold") purchased 100% of ScoZinc and all of its assets (consisting mainly of Scotia Mine and its infrastructure) from OntZinc for \$7 million. Acadian Gold subsequently changed its name to Acadian Mining Limited ("Acadian Mining"). On May 29th, 2007, ScoZinc exercised its option to buy‐out the 2% NSR for \$1,450,000.
ScoZinc reactivated the mill and continued surface mining the deposit during 2007 and 2008. Depressed metal prices forced ScoZinc to place the mine on care‐and‐maintenance status.
In February 2011, Selwyn Resources Limited ("Selwyn") purchased ScoZinc and all of its assets, including the Scotia Mine and ScoZinc's exploration claims, for \$10 million less a deduction relating to increased reclamation bonding requirements that were being determined at the time of the acquisition. In a May 2 nd, 2011 letter, the Nova Scotia government informed ScoZinc that the increased bond requirement amounted to \$1,887,790 (refer to Section 4.3 and Appendix 2). On June 1 st , 2011 Selwyn announced the closing of the sale and therefore acquiring 100% of ScoZinc and all of its assets.
6.4.2 Getty Zone
The following is adapted from Cullen et al (2011), section 5.1:
"The Getty Property was acquired by Getty in 1972, at which time Getty and joint venture partner Skelly Mining Corporation began exploration under terms of an option ‐ purchase agreement with Millmore‐Rogers Syndicate.
"Claims covering the Getty Zone were placed under closure in 1987 by the Nova Scotia government and a tender was subsequently let for acquisition of exploration rights to the property. In 1990 Westminer Canada Limited (Westminer) was deemed the successful bidder and awarded a Special Exploration Licence for further assessment of the deposit. Attempted renewals of the Getty Special Exploration Licence by Westminer for three consecutive years were not successful.
"Between 1992 and September 2006 Getty property claims were maintained under government closure and no work was carried out.
"Pasminco Resources Canada Company ("Pasminco") acquired the adjacent Main Zone and infrastructure in 1999 through purchase of Savage Resources Inc., and in 2000 Pasminco submitted an application to NSDNR for a Special Mining Lease covering the deposit. No lease was issued and the closed status of the property was maintained.
"In September 2006, the provincial government tendered exploration rights to the closed Getty property and Exploration Licences 6959 and 6960 were subsequently issued to Acadian on October 20th, 2006 as successful bidder under the tendering process."
6.5 Historical Mineral Resource and Mineral Reserve Estimates
The following resource and reserve estimates are historical in nature, have not been extensively audited by the author and some were not prepared according to National Instrument 43‐101 (except where noted) and should not be relied upon.
6.5.1 Scotia Mine Deposit (Main Zone)
Numerous resource estimates have been carried out over the past thirty years since the discovery of the Scotia Mine mineralisation. These resource estimates have been based on differing underlying parameters including varying minimum thickness of intercept, differing cut‐off grades, utilisation of zinc equivalent or independent lead and zinc minimum grades, etc. Resource figures have ranged throughout the years from an initial 12,000,000 tonnes at 7% zinc‐equivalent (drill‐indicated) in 1974 (Patterson, 1993) to the 1985 figure of 980,000 tonnes at 5.35% lead and 9.42% zinc (mineable) at a 7% zinc‐equivalent cut‐off (Hale and Adams, 1985).
Westminer (Nesbitt Thompson, 1991; WMC, 1995) reported resources that were outlined by over 1,300 underground and surface holes in addition to the information derived from the underground workings. The calculations were based on a minimum true thickness of two metres with a cut‐off of 7% zinc‐equivalent. The total geologic reserves were quoted as 2,400,000 tonnes averaging 6.3% Pb and 8.7% Zn (Table 6‐2). A mineable reserve was also quoted as 1,370,000 tonnes averaging 5.3% Pb and 9.8% Zn.
In 1992, Campbell, Thomas and Hudgins reported that there was potential for mining an additional 800,000 tonnes of lower grade mineralisation via open-pit methods. The authors went on to say "there is excellent potential to expand the underground reserves, particularly in the eastern section of the mine. Underground development in the western and central zones resulted in significant expansion of the reserves as ore zone continuity has generally been better than had been originally interpreted from the drill information."
In Claude Poulin's July 1 st, 1998 memo titled "Scotia Mine, Mineral Resource Status," he reported the deposit's resources. Higher grade [greater than 7% Zn‐equivalent (% Zn + 0.5 x % Pb)] and lower grade zones (greater than 2% but less than 7%) were outlined by Savage's geologists. The higher-grade zone consists of massive sulphide and lies at the contact between the dolomite and the Trench or evaporite units. The lower grade zone consists of disseminated zinc and lead within the dolomite. These outlines were transferred to a block model by Tim Carew, manager of Gemcom Services in Reno, Nevada. Inverse distance squared weighting was used to calculate block grades. Top‐cut values of 15% Zn and 10% Pb were used. No dilution or mining recovery factors were applied to the calculations. Undiluted resources are reported in the Table 6-2 overleaf.
The reader should note that the Resources were unclassified. They were not separated into Measured, Indicated and Inferred categories "due to the lack of geostatistical information" [Poulin, 1998 (1)]. Those Resources were not entirely independent and did not follow NI 43‐101 guidelines, as the report predated that Standard.
Reserves were estimated through a pit optimisation process carried out on the Central portion of the deposit. These were reported in Claude Poulin's July 1 st, 1998 memo titled "Scotia Mine, Mining Reserve Status". Zinc and lead prices were US\$ 0.55 and US\$ 0.36 per pound, respectively. The optimised pit, which considered diverting Gays River by moving it toward the highway, was sent to Mine Design Associates (MDA) for practical pit design. Savage supplied the economic and geotechnical parameters to MDA. Dilution and recovery factors of 20% and 90%, respectively, were used.
Reserves included Resources that lie northeast of the highway. These would be accessed using underground methods. For this material, dilution and recovery factors of 25% and 90%, respectively, were used. The estimated Reserves are reported in Table 6-2 overleaf. Those Reserves were not entirely independent and did not follow NI 43‐101 guidelines, as the report predated that Standard.
It was discovered during the 2019 mineral resource estimation process that an error was made when calculating resource and reserve grades during the 1998 estimate. When estimating block grades in the High-Grade Zone, lower grade (less than 7% Zn‐Eq) assays in the zone were filtered‐out because they were thought to belong to a separate domain. Likewise, in the lower grade Disseminated Zone, higher grade (greater than 7% Zn‐Eq) were filtered‐out. This incorrectly increased the grade of the high-grade zone, which increased the overall resource and reserve grade by approximately 1% Zn‐Eq. The error had less of an effect on the lower grade zone. The error was corrected during the 2019 mineral resource estimate.
| Estimator | Category | Tonnes | Zinc Grade | Lead Grade |
|---|---|---|---|---|
| Westminer (1991) | "Geologic Reserve" (Undifferentiated) |
2,400,000 | 8.70% | 6.30% |
| Reserve (Underground) | 1,370,000 | 9.80% | 5.30% | |
| Savage (1998) | Resource (Undifferentiated): | |||
| Higher Grade | 1,700,000 | 11.1%1 | 4.7%1 | |
| Lower Grade | 3,400,000 | 2.6%1 | 1.3%1 | |
| Total | 5,100,000 | 5.5%1 | 2.4%1 | |
| Reserve (Undifferentiated): | ||||
| Northeast (Underground) | 360,000 | 8.60% | 4.30% | |
| Central (Open-Pit) | 19,000,001 | 4.1%1 | 1.6%1 | |
| Total | 2,260,000 | 4.80% | 2.00% |
Table 6-2: Historical Resource and Reserve Estimates
Source: MineTech 2012
1 It was discovered during the current study that an error had been made during the grade estimation process in 1998. It should be noted that the above referenced Resources and Reserves estimates were not carried out in accordance with the Canadian Institute of Mining and Metallurgy and Petroleum CIM standards on Mineral resources and Reserve Definitions ("CIM Standards") and therefore do not conform to Sections 1.3 and 1.4 of NI 43‐101.
In 2006, MineTech International Limited ("MineTech") carried out a National Instrument 43‐101‐compliant resource and reserve estimate. MineTech's results are reported in Table 6-3 and Table 6-4 below.
| Mineral Resources | |||||||||
|---|---|---|---|---|---|---|---|---|---|
| Category | 3 Volume (m ) |
SG | Tonnes | Zinc Grade |
Lead Grade | ||||
| Measured (Surface) | 680,000 | 2.78 | 1,880,000 | 3.80% | 1.60% | ||||
| Indicated | |||||||||
| Surface | 810,000 | 2.77 | 2,250,000 | 3.20% | 1.40% | ||||
| Underground1 | 381,000 | 2.9 | 1,110,000 | 6.60% | 3.70% | ||||
| Sub Total | 1,190,000 | 2.82 | 3,360,000 | 4.30% | 2.20% | ||||
| Measured + Indicated (Surface & Underground) |
1,870,000 | 2.8 | 5,240,000 | 4.10% | 2.00% | ||||
| Inferred | 652,000 | 2.76 | 1,800,000 | 3.10% | 1.10% |
Table 6-3: Previous Mineral Resource (Roy et al, 2006)
Source: MineTech 2012
Notes:
- Northeast Underground Zone
2. Undiluted Resources
Table 6-4: Previous Mineral Reserve Estimate (Roy et al, 2006)
| Mineral Reserves | |||||||||
|---|---|---|---|---|---|---|---|---|---|
| Category | Volume (m3 ) |
SG | Tonnes | Zinc Grade |
Lead Grade |
||||
| Proven Reserve (Surface) | 630,000 | 2.78 | 1,750,000 | 3.20% | 1.30% | ||||
| Probable Reserve | |||||||||
| Surface | 610,000 | 2.76 | 1,690,000 | 2.50% | 1.00% | ||||
| Underground | 395,000 | 2.9 | 1,150,000 | 5.70% | 3.20% | ||||
| Sub Total | 1,005,000 | 2.83 | 2,840,000 | 3.80% | 1.90% | ||||
| Total Proven & Probable Reserves (Surface & Underground) |
1,635,000 | 2.81 | 4,590,000 | 3.60% | 1.70% |
Source: MineTech 2012
Notes:
- Dilution equals 15% and mining recovery equals 90%
6.5.2 Getty Zone
The following is taken from Cullen et al. (2011):
"Four previous estimates of tonnage and grade for in‐situ mineralization comprising the Getty Zone are available in the public record. The earliest of these was prepared for Getty by MPH Consulting Limited (Riddell, 1976) and was revised in 1980 as part of a Mine Valuation Study carried out for Esso (MacLeod, 1980). Subsequently, Westminer developed an in‐house estimate and preliminary economic assessment of the deposit based on historic drilling (Hudgins and Lamb, 1992). The fourth estimate was completed in December 2007 by Mercator for Acadian and reported by Cullen et al (2007)".
"Results of the first three historic estimates are presented below in Table 6-5 and all pertain to areas currently covered by Acadian exploration licences. These pre‐date National Instrument 43‐101 ("NI 43‐101") and have not been classified under Canadian Institute of Mining, Metallurgy and Petroleum Standards for Reporting of Mineral Resources and Reserves: Definitions and Guidelines (the CIM standards). On this basis they should not be relied upon. Table 6-6 presents the Cullen et al. (2007) NI43‐101 compliant resource estimate completed by Mercator, which has an effective date of December 12th, 2007".
| Reference | Tonnes | Zn & Pb (%) | Zn (%) | Pb (%) |
|---|---|---|---|---|
| Riddell (1976) | 4,470,400 | 3.71 | 1.87 | 1.84 |
| MacLeod (1980) | 3,149,600 | 2.97 | 1.6 | 1.37 |
| Hudgins and Lamb (1992) |
4,490,000 | 3.2 | 1.87 | 1.33 |
Table 6-5: Historic Resource Estimates for Getty Zone - Not NI 43‐ 101 Compliant (Cullen et al, 2011)
Notes: With regard to the historic mineral resource estimates stated above 1) a qualified person has not done sufficient work to classify the historical estimate as current mineral resources or mineral reserves; 2) the issuer is not treating the historical estimate as current mineral resources or mineral reserves as defined in sections 1.2 and 1.3 of NI 43‐ 101; and 3) the historical estimate should not be relied upon.
Table 6-6: Mercator NI 43‐ 101 Resource Estimate for Getty Zone (effective December 12th, 2007) (Cullen et al, 2011)
| Reference | Tonnes | Zn & Pb (%) | Zn (%) | Pb (%) |
|---|---|---|---|---|
| Cullen et al (2007) |
4,160,000 | 3.21 | 1.81 | 1.40 |
Riddell (1976) used a 2% (zinc% + lead%) cut‐ off, Macleod (1980) used 1.5% zinc cut‐ off and Hudgins and Lamb (1992) used a 1.5% zinc‐ equivalent cut‐ off defined as zinc equivalent = zinc% + (lead % x 0.60).
Figures for the previous Mercator estimate that are presented in Table 6-5 reflect application of a 2% zinc + lead cut‐off. The Riddell (1976) and MacLeod (1980) estimates are based on drill‐hole‐centered polygonal methods of volume estimation along with subjectively determined specific gravity factors reflecting general experience. Both estimates include length‐weighted drill hole grade assignments to polygons with subsequent tonnage‐ weighting to determine deposit grades. In contrast, Hudgins and Lamb (1992) used Surpac® deposit modeling software, a cross sectional method of volume estimation, a single assigned specific gravity factor of 2.75 g/cm3 and calculated average deposit zinc and lead grades as the length‐weighted averages of all qualifying drill hole intercepts.
7 Geological Setting and Mineralization
7.1 Regional Geology
R.R. Faribault of the Geological Survey of Canada (GSC) mapped and surveyed the Scotia Mine area in the as part of his compilation of the gold areas of Nova Scotia. Sheet 55 of the series GSC map No 908 was published in 1907. His description of the Scotia Mine area was accurate as he noted the galena, limestone and gypsum and the plunging anticline on the map below.

Figure 7-1: E.R. Faribault's Map of the Scotia Mine Area (GSC map 908) Noted the Galena in Limestones, (Faribault, 1907)
A summary of the regional and deposit geological settings of the Scotia Mine area is supplied by Patterson (1993). There is also a "special issue devoted to zinc‐lead mineralization and basinal brine movement, lower Windsor Group (Viséan), Nova Scotia Canada" released as Volume 93 by Economic Geology in 1998.

Figure 7-2: General Geology in the Scotia Mine area. (Geological Map of the Province of Nova Scotia (map_1979-011_200_cln)
Nova Scotia is located within the Appalachian Mountains system.
These mountains were created by plate collisions that closed the Atlantic Ocean, creating a large land mass. Nova Scotia has been squeezed between the North American Plate and the African Plate several times during late convergence.


The Meguma Group rocks were deposited off the coast of West Africa during the early Paleozoic time (from 450 million years ago until 370 million years ago, Figure 7-4). At this time, the end of the PreCambrian period there was no plant or animal life on the land but there was life in the oceans.
Figure 7-4: The Closure of the Atlantic Creating the Supercontinent Pangea. Meguma Rocks Folded and Stuck to North America. (Lutgens and Tarbuck, 1882)

When the supercontinent Pangea was formed the Meguma Group was folded into the series of anticlines and synclines. At the breakup of Pangea, the Meguma rocks were glued to North America.
The Scotia Mine Deposit occurs along the southern margin of the large (more than 250,000 km2 ) and deep (more than 12 kilometres) late Palaeozoic Fundy (Magdalen) Basin, bordered on the northwest by the New Brunswick platform, and on the south by the Meguma platform (Figure 7-5 overleaf). During the late Palaeozoic, the Fundy Basin was divided or segregated through a complex series of grabens into deep linear successor basins or sub‐basins, which are now interpreted (Fralic and Schenk, 1981) as small pull‐apart basins. Subsequent basement subsidence, fragmentation and block faulting produced the irregular pre‐Carboniferous topography that was partly filled‐in by early Carboniferous clastics, and later flooded by middle Carboniferous seas. Carboniferous sediments consisting of terrestrial conglomerates, and sandstones, siltstones and marine limestones and evaporites, were deposited in this Fundy Basin which probably remained active during and after the Carboniferous, and may have had a major impact in the ore‐forming process. These sub‐basins contained thick accumulations of terrestrial and shallow marine sediments, and therefore could provide substantial volumes of basinal fluids (Ravenhurst, 1987).
In their 2011 report, Cullen et al. give further detail about the Carboniferous strata:
"The Getty Zone is hosted by lower Mississippian age dolostone of the Windsor Group's Gays River Formation. Well defined carbonate banks characterize this formation and in most instances are associated with well‐defined paleo‐basement high features. On depositional basin scale, Gays River Formation bank carbonates and laminated limestone of the laterally equivalent Macumber Formation mark the onset of marine depositional conditions after a prolonged period of predominantly terrigenous clastic sedimentation represented by Horton Group siliciclastic rocks".
"Carboniferous strata in Central Nova Scotia occur within the Shubenacadie and Musquodoboit sub‐basins of the larger Maritimes basin and were described by Giles and Boehner (1982). Geometry of both sub‐basins was significantly influenced by strong northeast trending structural grain in basement sequences of the Cambro‐ Ordovician Meguma Group. Deformation was heterogeneously distributed across the sub‐basins and at present is now represented by northeast trending normal and thrust faults which are locally associated with open to moderately folded structural domains. Deformation features are essentially absent near the southern margins of the basins but become more prevalent and pervasive toward the northern limits, where effects of the regionally significant Cobequid‐Chedabucto fault system are represented. Minor faults or fracture zones may be present at Getty but no structural complexity is evident in either the surface morphology or drill logs." (Cullen et al., 2011, Section 6).
The Scotia Mine Project area is underlain by the Cambro‐Ordovician metasediments of the Meguma Group which form the pre‐Carboniferous basement upon which the Gays River carbonate host rock was deposited. The Meguma rocks were tightly folded during the Acadian Orogeny into long northeast-southwest anticlines and synclines which have been faulted and jointed. Erosion of this basement into irregular knobs and ridges was controlled by these structures prior to the deposition of overlying sediments (the Gays River carbonate). Unconformably overlying the Meguma Group are clastic sedimentary rocks of the Horton Group and marine sedimentary rocks of the Windsor Group which overstep the Horton near the basin margins and rest directly on Meguma basement. It is these Windsor Group carbonates which have been the host for the carbonate‐hosted base metal sulphide and associated sulphate deposits in Nova Scotia.
Over 100 base metals occurrences, including a few deposits, are hosted by Lower Windsor Group marine carbonate rocks in Nova Scotia. About half of these occur within the Kennetcook, Shubenacadie, Musquodoboit and River Denys sub‐basins. In addition to the Scotia Mine Deposits, the most significant examples include the Walton deposit and the Jubilee deposit. Walton has two types of mineralisation: concordant sheets of barite contain lenses of lead‐rich and copper rich mineralisation. Between 1941 and 1978, 4.5 million tonnes containing over 90% BaSO4, and 0.4 million tonnes containing 0.52% Cu, 4.28% Pb, 1.29% Zn and 350 g/t Ag were produced (Sangster, Savard and Kontak, 1998). At the Jubilee deposit on Cape Breton sulphides cement fault‐related breccias and replace adjacent limestone; there are reported, unclassified resources (e.g. Fallara and Savard, 1998) of 0.9 million tonnes containing 5.3% Zn and 1.4% Pb.

Figure 7-5: Regional Geology Map
Source: MineTech, 2012
7.2 Property Geology
7.2.1 Local Geology
The carbonates started growing in a warm sea of Carboniferous age, when the ocean invaded the Maritime Basin 300 million years ago. The carbonate host is a algal bank-coral reef which grew along an anticlinal fold in the older Cambrian-Ordovician rocks which were folded by compressional forces during the Taconic orogeny 440 million years ago. The carbonates formed a barrier between the two basins. To the Northwest was the Shubenacadie Basin and to the Southeast was the Musquodoboit basin. The Goldenville anticline's slope is controlled by bedding and jointing. The base metal deposit is on the north side of the anticline where the Goldenville rocks dips between 43° and 46° to the north. The strike of the beds is between 085° and 090°.
There are several well-developed joint sets in the Goldenville rocks. These are generally:
| Structural Geology | |||||||||
|---|---|---|---|---|---|---|---|---|---|
| Area/drift | Bedding | Jointing | Fault gouge | ||||||
| Strike | Dip | Strike Dip | Strike | Dip | |||||
| 101-3 | 253 48 | N | 0 76 | W | |||||
| 107A | 270 50 | N | |||||||
| 107A | 325 30 | W | |||||||
| 107 | 268 50 | N | |||||||
| 201 | 85 43 | N | 339 90 | ||||||
| 201 | 65 70 | S | |||||||
| 301 | 250 42 | N | 325 55 | W | |||||
| 301 | 315 75 | W | |||||||
| 301 | 15 80 | E |
Figure 7-6: Stereonet Showing the Facture Pattern
Figure 7-7: Fracture Patterns in the Goldenville Quartzite (Author's Personal Field Book)

Figure 7-8: Goldenville Bedding Strike and Dip Varies from Northwest Dipping Slopes to Northeast Dipping Slopes (Author's Personal Field Book)

The jointing and faulting influenced the erosion of the rock into the saw-tooth topography of headlands and valleys. Deep valleys with sheer cliff sides formed where the joint planes intersected.
On the joint controlled surface, the topography is step like. The blocks of quartzite are angular and average about 1m across. On the bedding controlled surface, the breccia boulders are more rounded and smaller. Much of the weathering of the Goldenville pre Carboniferous was in a dry and arid environment free of animal life and vegetation on the land.
The Carbonate reef started as a coral reef in a transgressing sea. In the decline area, the corals are thickest, with a maximum thickness of about 12m. The coral has an uneven surface topography due to erosion and/or destruction by brachiopods etc.
Above the coral zone algal stromatolites have bind the carbonate rock. Two types of algal binding are present, the bedded lagoon type in the decline portal area, and a deeper water type (mop string texture). Skeletal and micritic material is flat lying portion of the carbonate complex. At the reef crest and down dip the skeletal material fills channels that dip perpendicular to the reef crest.
For most of the time up until the Cretaceous Period, about 60 million years ago, the carbonates were covered by gypsum and anhydrite.


The carbonates on side of the complex facing the Shubenacadie basin to the northwest are well mineralized with lead and zinc sulphides (galena and sphalerite). The sphalerite is a honey yellow colour with very little iron. It is thought that the zinc and lead were transported from the deeper basin as metal chlorides as the sedimentary pile accumulated and pressure forced the pore water out of the sediments. When this brine encountered the carbonate rocks, the metal precipitated as sulphides as there was a hydrocarbon accumulation at the carbonate front, a decrease in pressure and other physical changes that made the zinc and lead minerals precipitate. The carbonates facing the Shubenacadie basin are enriched in lead at deeper elevations and the carbonates at higher elevations are zinc rich. There is a near contiguous band of massive galena / sphalerite on the northwest side of the carbonate complex. The carbonates on the southeast side of the reef are barren or very low grade. The deposition of zinc and lead minerals into the carbonates occurred over a very long period of time, probably millions of years.
The deeper parts of the Shubenacadie basin host very thick salt deposits, sodium salt, gypsum and anhydrite. Eventually these salt sediments killed of the coral and probably covered the deposit.
Moving ahead to the Cretaceous period, Nova Scotia was uplifted relative to sea level. During this time, some 60 million years ago, at the Scotia Mine, a river became established at the contact between the carbonates and the gypsum/anhydrite rocks.
The river eroded what is called the trench. On the northwest side of the trench is gypsum and on the southeast side is the carbonate complex. The trench varies in width from metres to tens of metres.
Erosion between the carbonates and gypsum is down to 100 metres in some places. The trench was eventually filled with gravel, sand, and mainly mud.
During the Pleistocene era, which began approximately two and a half million years ago and ended about 15,000 years ago, the Scotia Mine site was covered by thick ice sheets several times, with periods of warming and melting. There are glacial-fluvial sediments – sands and gravel all along the Musquodoboit Valley. These thick ice sheets compacted the earlier glacial sediments and also the material in the trench, so there is a hard basal till covered by unsorted glacial till. These glacial sediments cover almost all of the bedrock in the area.
Overlying the carbonate rocks are evaporites (gypsum, anhydrite, halite and minor potash) with minor interbeds of dolostone and mudstone, all of which constitute the Carroll's Corner Formation. Nearby, (5 kilometres to the southwest), the gypsum is being mined at the National Gypsum Quarry.
Both the bedrock and "trench" sediments are overlain by 20 to 40 metres of glacial till, which is locally cut by glacial fluvial sands and gravels.
Figure 7-10: Soil Types in the Scotia Mine Area from Report 13, Soil Survey of Halifax County Nova Scotia (Macdougall And Cann, 1963)


Figure 7-11: Stratigraphic Setting of Gays River Formation (Boehner et al, 1979)
Three geological cross sections are represents the prototypical cross sectional geology for the deposit. Figure 7-12 illustrates the Getty Area Stratigraphic column.

Figure 7-12: Top-of-Carbonate Contour Map
Source: MineTech, 2012

Figure 7-13: Geological Cross-Section A-A'


Figure 7-15: Geological Cross-Section C-C'


Source: MineTech, 2020

Figure 7-17: Getty Zone Stratigraphic Column

Figure 7-18: Carbonate Bank Cross-Section
7.3 Mineralization
7.3.1 Main Zone Mineralization
The base metal is controlled by initial porosity. The mineralizing fluid deposited galena in the lower elevations and more sphalerite mineralization in the upper portions of the carbonate complex, extending well into the reef. The mineralizing fluids chose the channel ways through the coral gardens. The most likely source of a channel way is where there is a change in the direction at the reef crest, where joint controlled slopes meet. Galena is generally in veins and along fractures. There is some dissemination through the smaller openings in the rock.
Once over the coral mound, the mineralizing fluid travelled along sheets of skeletal debris and dolomite sand. Thus, in the reef proper, the mineralized beds are generally flat lying to gently dipping (16°SE around the portal). Secondary mineralization is also open space filling. The open spaces probably were caused by several uplift periods. A miner amount of marcasite and zinc oxide is present in fractures of the carbonate near the surface and in the outcrops near the confluence of the Gays River and South Branch Gays River
Nesbitt Thomson Inc. (1991) describe the high‐grade mineralisation as consisting of a massive sulphide zone in contact with the evaporite or Trench, ranging in thickness from 0.1 to 5.0 metres and locally containing up to 78% Pb and 57% Zn. On the footwall of the massive sulphide, there is a zone of disseminated material (>7% Zn equivalent) which, in places, is up to 12 metres in thickness. Locally disseminated mineralisation (>2% Zn equivalent) extends up to twenty metres into the footwall. The parameters used to calculate "Zn equivalent" are unknown but would have reflected the prices of zinc and lead at the time.
The Main Zone is essentially controlled by a sinuous paleo coastline. The main part of the deposit is shallow (generally <150 m deep), has a dip length of approximately 100 m and a strike length following the paleo‐ coastline over a straight-line distance of 2 km (Nesbitt Thomson Inc., 1991).
The mineralisation at the Main Zone consists of massive and/or disseminated ore hosted predominantly by the carbonate rocks, with extensions down into the basal breccia unit. The massive mineralisation consists of fine‐ grained (<10‐20 m), Fe‐poor, beige‐coloured sphalerite and medium to coarse‐grained, Ag‐poor galena (<10‐20 ppm Ag in galena concentrates) (Kontak, 1998; Savard and Kontak, 1998), is restricted to the carbonate‐ evaporite contact and is 1 to 3 metres in true thickness. Disseminated mineralisation, consisting of yellow to orange, millimetre‐size euhedral sphalerite and millimetre‐to‐centimetre‐size euhedral galena, fills in primary porosity in the dolomitized carbonates and walls of primary cavities (Kontak, 1998).
Sphalerite and galena constitute about 99.5% of metallic minerals. Other sulphide minerals are marcasite, pyrite and chalcopyrite, while gangue minerals include calcite, dolomite, fluorite, barite and selenite (Patterson, 1993).
7.3.2 Getty Zone Mineralization
The following is taken from Section 8 (Mineralization) of Cullen et al (2011):
"Zinc and lead sulphide mineralization are found throughout the Getty carbonate bank, along with trace amounts of iron sulphide in isolated areas. Base metal sulphides are also present to a lesser extent in carbonate matrix of the underlying conglomerate/breccia unit and within calcite or micrite filled fractures and joints present in underlying Goldenville Formation greywackes. While not extensively reported to date, galena has also been documented locally at the Scotia Mine [Main Zone] deposit in thin (<20cm thick) discordant, steeply dipping veins that generally trend north‐south (B. Mitchell, personal communication, 2007)".
"Drilling to date on the Getty Zone has shown that massive to submassive high grade mineralization like that commonly present along steep bank front zones at Scotia Mine is not present to a significant degree at Getty (Bryant, 1975). However, a clear association of higher zinc and lead grades with dolostone intervals on the northeast and north slopes of the Getty bank is recognized and lower grades over thicker intervals occur within the carbonate sections at the top of the bank. Mineralization is more poorly developed along the southwest side of the bank".
"Sphalerite is the predominant base metal sulphide phase present and is typically honey yellow to buff or beige in colour and finely crystalline. Based on drill core observations, Bryant (1975) specified the following four modes of sphalerite occurrence within the deposit, with the first being the most common: (a) disseminated mineralization showing concentrations from trace to 10% or more, (b) semi‐massive and massive mineralization as seams and replacements along bedding surfaces or laminae, (c) massive, porosity filling or surface coating mineralization in fossiliferous and vuggy carbonate, (d) mineralization associated with secondary calcite in small stringers and veinlets".
"Silver is a trace constituent of the Getty sulphide assemblage but is not present at levels of economic significance. This parallels the situation at adjacent Scotia Mine where Roy et. al. (2006) reported historic silver values in mill concentrates that were typically less than 40 parts per million." (Cullen et al, 2011, section 8).
8 Deposit Types
8.1 Gypsum
Gypsum is an evaporite, a class of rocks that precipitate when water evaporation keeps pace with water input.
Block faulting during the early Carboniferous lowered the land relative to the sea. Slowly water invaded the area. The marine invasion led to carbonate-based life forms such as coral to establish colonies along the edge of the ancient sea. As the temperature and salinity of the water increased, gypsum, anhydrite and halite and some other salts precipitated out as the sea dried up.
Rock salt has been mined underground in Nova Scotia since 1920 when the Malagash Mine opened in Cumberland County. This deposit was mined through a vertical shaft. Salt was intersected less than 30m from surface.
Anhydrite is deposited directly from the evaporation of sea water at a temperature of 42C or higher, or at lower temperatures with increased salinity. At lower temperatures gypsum is deposited. (Berry and Mason, 1959).
Gypsum precipitates as a hydrated calcium sulphate CaSO4.2H2O. The crystals are tabular. Gypsum has a hardness of 2 on Mohs scale, between talc and calcite, so one can scratch gypsum crystals with a fingernail. Pure gypsum has a density of 2.3 tonnes per bank cubic metre and a bulk density of 1.6 tonnes per cubic metre.
In the arid Carboniferous environment gypsum crystals accumulated in thick beds, over a long period of time, as the sea water evaporated and was replenished in cycles. Halite, NaCl and other mineral salts precipitated out as the sea dried up.
8.2 Genesis of the evaporites
George de Mille, a carbonate specialist with Esso Minerals Canada wrote in 1978, after several visits to the Scotia Mine area that: "The bar theory put forth by Ochsenius in 1888 after a study of the Caspian Sea required that a coastal portion of a land mass, a bay for example, be partially restricted from the open sea or ocean by a bar of some nature. A sand or mud bar, a reef or a geologic structure could serve. Sea water crossing the bar tends to be lost by evaporation and to be more or less continuously replaced." (de Mille, 1978)
Figure 8-1: Cartoon Cross Section of the Bar Theory Put Forth by Carl Ochsenius in 1888, as Illustrated by De Mille, 1978

Figure 8-2: The Linked Basin Theory of Ochsenius as Illustrated by de Mille, 1978


Figure 8-3: Salts Dissolved in Sea Water% by Weight. (Verhoogen, et.al., 1970)
If a column of sea water 100m high were evaporated to complete dryness it would leave a salt bed 150 cm thick, composed of 116 cm of halite, 4 cm of gypsum and 30 cm of mixed sulphates and chlorides of magnesium and a little potassium chloride. The order of precipitation would be:
-
- Calcium carbonate
-
- Calcium Sulphate
-
- Sodium Chloride
-
- Magnesium sulphates and chlorides
-
- Sodium bromide and potassium chloride (Verhoogen, et al 1970, p.403).
8.3 Zinc and Lead
The Scotia Mine Deposit mineralization has long been considered a Mississippi Valley‐type ("MVT") lead‐zinc deposit (MacEachern and Hannon, 1974). Characteristics of sedimentary formations that host MVT lead‐zinc mineralization include shallow‐water, shelf‐type carbonate rocks with reefs around the peripheries of intracratonic basins, karst structures, limestone‐dolomite interfaces and proximity to a major hydrocarbon‐bearing basin. The archetypical MVTs occur in the United States in several famous districts surrounding the Michigan‐ Illinois Basin which also has significant hydrocarbon production. Each of the districts is enormous, with resource potential of 75 million to 750 million tonnes and individual deposits in the order of 1 to 100 million tonnes.

Figure 8-4: Mississippi Valley Type Carbonate Hosted Deposits in Canada (GSC map D1860A)
Other MVTs have been mined in the past in Canada (e.g. Pine Point in the Northwest Territories, Nanisivik mine in Nunavut, and Newfoundland Zinc at Daniel's Harbour).
MVTs are thought to have formed when hot, basin‐derived, oil field‐type brines, formed at depths of more than 2 km, migrated towards lower pressure areas around the basin periphery. Mineralisation precipitated from the zinc and lead rich brines when they encountered a source of sulphur in the porous areas of the carbonate.
Sangster and others (1998) draw on their own and others' evidence to conclude that all Windsor Group lead‐ zinc deposits are epigenetic relative to their enclosing strata, exhibiting both open‐space filling and host‐rock replacement. At the Scotia Mine Deposit, textures (including fossils) have been preserved; representing volume‐ for‐volume replacement of original limestones by dolomite, and the sulphides are, in turn, replacements and porosity fillings within the previously altered host rocks. Kontak (2002) feels that petroleum in fluid inclusions in the Scotia Mine Deposit mineralisation suggest a role of hydrocarbons in the mineralising process, like many MVTs, but Sangster and others (1998) point to basement rocks underlying the Palaeozoic sedimentary rocks as the source of the mineralising fluids.
The temperatures of formation of the Scotia Mine Deposit (and others in Nova Scotia) are higher than most North American MVTs and compare more favourably with the clearly epigenetic MVTs of the Central Ireland Basin (Sangster and others, 1998). The Irish deposits also occur in Upper Paleozoic (Carboniferous) carbonate rocks, predominantly in shallow‐water carbonates and a mudbank limestone (reef). The Irish deposits are also preferentially associated with east‐northeast‐trending faults which are thought to have acted as conduits for mineralising hydrothermal fluids; basement lineaments may also have controlled deposition. As with the Scotia Mine Deposit, sphalerite and galena are the main sulphides; barite is also usually present (Exploration and Mining Division Ireland, 2004). Seven economic deposits have been mined or are currently in production in Ireland. The largest of these, the world‐class Navan deposit, had total production and proven + probable reserves of 82.1 million tonnes containing about 10.6% Zn+Pb; its annual production is 2.5 million tonnes of ore. Other producers and former producers had resources between about 8 and 18 million tonnes and grades of 9‐ 25% Zn+Pb (Exploration and Mining Division Ireland, 2004).
It is noteworthy that two major carbonate‐hosted zinc‐lead deposits discovered in Ireland since 1986 occur down‐dip from areas where considerable exploration, including diamond drilling, had been carried out over the prior 20 years (Patterson, 1993). Similarly, the MVT deposits of the Viburnum trend in the U.S.A. were discovered at depths of 300 metres by understanding of the regional geology of the hosts rocks of the Old Lead Belt about 80 km away.
Cullen et al (2011) describe the Getty Zone in section 7.2 of their report, quoted below in part:
"Genetic Model [original section: DEPOSIT TYPE (7.2)]"
"The adjacent Scotia Mine deposit (Main Zone) has been the subject of extensive academic and government research and reporting since its discovery in 1973. Much of this work was summarised by Roy et. al. (2006) and the deposit is a considered an example of the Mississippi Valley Type (MVT) class of carbonate hosted, stratabound, base metal deposits. Prominent examples of the paleo‐basement high deposit setting occur along the Viburnum Trend of Southeast Missouri, but are characterised in that area by dominance of lead mineralization over that of zinc (Sangster et. al., 1998; Akande and Zentilli, 1983; MacEachern and Hannon, 1974)".
"Localization of base metals within the Getty bank complex is believed to have resulted from interaction between metal‐bearing basinal fluids, potentially sourced in the Horton Group stratigraphic section or in basement sequences, and chemical reductants, possibly including hydrocarbon, that were present at sites of deposition within the bank. Kontak (1998, 2000) reported on fluid inclusion and other studies of ore from the adjacent Scotia Mine property and concluded that saline brines in the 100º C to ≤ 250º C temperature range were involved in the main mineralizing process and that these temperatures are higher than those typically seen in MVT districts. Héroux, et. al (1994) studied organic maturation and clay mineral crystallinity characteristics of Gays River Formation rocks of the Musquodoboit and Shubenacadie basins and identified a corridor of higher interpreted heat flow that occurs in part over the Scotia Mine Deposit areas and is consistent with the higher fluid temperatures previously noted. It is clear that zinc and lead mineralization were superimposed on lithified and dolomitized host rocks (Akande and Zentilli, 1985; Kontak, 1998)." (Cullen et al, 2011)
9 Exploration
Note: Item 9 has no change from Previous NI43-101 Technical Report by Carew, et al, 2020
9.1 Exploration History
The Scotia Mine Deposit zones were explored more‐or‐less contemporaneously. Major drilling campaigns on both zones first started in the mid‐1970s. Esso Minerals was primarily involved with the Main Zone while Getty Northeast Mines Limited was primarily involved with the Getty Zone. During the 1980s, Seabright and Westminer carried out some drilling on the Main Zone and during the late‐2000's, ScoZinc chiefly drilled the Getty Zone.
9.1.1 Main Zone
Lead‐zinc mineralisation at Scotia Mine was first mentioned in records dating back to 1824. Knowledge of the occurrence may even go back to the early 1700's when French soldiers reportedly used the lead for making ammunition (MacEachern and Hannon, 1974). Other early references to Gays River lead were made in 1868 by J. W. Dawson in "Acadian Geology" and by H. Howe in "Mineralogy of Nova Scotia".
The earliest recorded prospecting may have been trenching along the outcrops in 1873‐1874. Additional trenching and pit sinking were carried out in 1928. Assessment records do not indicate any resumption of interest in the area until 1951. From the first reports of mineralisation in the area in the early 1800's, exploration activity up to 1950 had yielded best values of 3 % lead (Patterson, 1993).
1951
Maritime Barytes Limited acquired the property at Scotia Mine and carried out a surface exploration program involving some trenching and sampling. Gays River Lead Mines subsequently became involved in the evaluation of the property and commenced a drill program to delineate the occurrences of lead and zinc. A total of 67 delineation drill holes were completed by mid‐1952 and an additional seven holes were completed for exploration in the vicinity.
Drilling by Gays River Lead Mines Limited outlined four zones of mineralisation in an area about 400 metres by 900 metres. Over 800,000 tonnes of mineralised (galena, sphalerite, pyrite, marcasite and chalcopyrite) Windsor Group carbonate were defined overlying and flanking a northeast‐trending anticlinal Meguma greywacke basement high. Grades for the four zones ranged from 1.10% to 3.50% combined lead plus zinc with an average of 2.32% combined lead plus zinc. Most, if not all, assays were from sludge samples.
1962
Gunnex Limited carried out extensive soil sampling in the Scotia Mine area in 1962. Anomalies were encountered only over areas of previously known mineralisation where overburden was thin. An induced polarisation survey indicated only a very weak response over known mineralisation and did not add any new target areas. The lack of encouraging response on the periphery of the earlier defined mineralised area prompted Gunnex to forego any further exploration activity.
1968 – 1969
In 1968 and 1969 Penarroya Canada Limited completed extensive soil sampling and geological mapping in the Scotia Mine and Meaghers Grant areas. Two diamond drill holes in the Meaghers Grant area intersected minor zinc mineralisation. No drilling was carried out in the Scotia Mine area even though a number of soil anomalies had been identified. Most of the major anomalies corresponded with previously known mineralisation. Two new anomalous areas were, however, defined. They occur near Carroll's Corner and in the Black Brook area east of the Gays River and define a northeast trending geochemical high. The latter area is close to the northeast end of the presently defined Main Zone itself.
1971
Texasgulf Inc. drilled four diamond drill holes in the Scotia Mine area in 1971. One hole adjacent to a Gays River Lead Mines drill hole confirmed significant mineralisation in the carbonates. The remaining holes tested one soil anomaly southeast of Gays River and two areas northwest of Gays River. No encouraging mineralisation or carbonate build‐ups were intersected in the last three holes and work was terminated.
1972 – 1984
In 1972 personnel of Cuvier Mines Limited ("Cuvier") prospected the Scotia Mine area and located significant mineralised float material to the south of the old occurrence (MacEachern and Hannon, 1974) and subsequently acquired the ground. Cuvier also outlined geophysical and geochemical anomalies. In September of 1972 Cuvier optioned the property to Imperial Oil Enterprises ("Esso") with Esso holding a 60% interest and acting as the operator. Cuvier formed a joint venture with Preussag Canada Ltd. ("Preussag") to finance Cuvier's 40 % interest in the property.
Both Cuvier and Esso were of the opinion that the area had the proper geological setting for a Mississippi Valley‐type deposit. Esso recognised the possible existence of a reef complex trending north‐easterly from the old Scotia Mine drilling site. The source of the mineralised boulders had not been located and a combination of deep glacial till and lack of outcrop would necessitate fence‐type drilling in geologically favourable areas for the purpose of obtaining geological information as well as locating any mineralised areas.
A total of 20 holes were drilled prior to drilling the discovery hole 2.5 kilometres northeast of the original showing along the postulated reef trend. The discovery hole intersected 3.35 metres averaging 7% zinc (MacEachern and Hannon, 1974).
From October 1972 to August 1974, Esso/Cuvier drilled off the deposit and identified 12,000,000 tonnes averaging 7% Zn + Pb (Patterson, 1993) over an area of approximately 4 kilometres by 220 metres at depths ranging from 20 to 200 metres (450 surface core holes)2 .
The initial mine development by Esso began with developing the exploration decline in 1976 across the central portion of the mineralised zone to verify mining conditions, the grade and continuity of the mineralisation and to provide bulk samples for metallurgical testing. The decline was 760 metres in length but by mid‐1979 some 1,800 metres of drifting and 744 metres of underground development had been completed. The deepest workings were at a vertical depth of 100 metres. In December of 1977 Esso purchased Cuvier's and Preussag's interests in the property and formed Canada Wide Mines to develop and mine the deposit.
During the next two years various feasibility studies were carried out. Recoverable proven plus probable reserves were then estimated at 4.7 million tonnes at 2.8%Pb and 4.2%Zn (WMC, 1995). Esso commenced with the construction of the mill and other facilities in August of 1977. The 1,350 tonne processing plant was commissioned in October of 1979 and the mine was further developed to support a 1,350 tonne per day operation.
From 1978 until 1981, Esso operated the mine and targeted the lower grade mineralisation using a trackless, lower cost, bulk room and pillar mining method approach. The higher grade mineralization near the carbonate contact was not part of the mine plan. Operations continued until August 1981 when production was suspended except for an underhand cut and fill technique test stope. Mining conditions exacerbated by bad ground conditions and excessive water inflow caused the operation to be suspended. During the operation, a total of 553,688 tonnes of mineralised material averaging 1.36% Pb and 2.12% Zn were produced and run through the mill – 272,000 tonnes of waste were also removed. Throughout this period efforts to achieve the full production rate, as well as efforts to mine areas of higher grade mineralisation were complicated by the combination of the complex geological setting and the severe hydrological problems.
The plant was shut down in 1982 as a result of operating losses due to lower than expected grades, higher than expected operating costs, the difficult water problems and low metal prices.
Seabright Resources Inc. acquired the mine and mill in 1984 but despite a favourable feasibility study did not reactivate the mine due to depressed metal prices at the time.
A summary table of all known drilling at the Main Zone by all exploration companies over the years is included as Table 10-1. A map depicting the location of the surface holes is included as Figure 7-12.
1985 – 1987
Seabright's primary intention was the usage of the mill facility to process gold ore from their outlying properties, and a secondary intent to later re‐open the Main Zone mine (WMC, 1995). At the time, Seabright was mining (bulk sampling) gold‐bearing quartz veins from four small operations; Beaver Dam, Forest Hill, Caribou and Moose River, all located within the Meguma Group (Cambro‐Ordovician).
The milling facility was converted for gold processing. The mine was not re‐opened at that time by Seabright as a sharp drop in zinc prices rendered the underground mining operation uneconomic.
1987 – 1991
In 1988, Westminer Canada Limited ("WMC") purchased Seabright Resources. A review of the deposit, including the drilling of 89 surface core holes, led WMC to a positive production decision based on a reinterpretation of the geology and mining method. They began dewatering the underground workings in early 1989. Following the success of the mine dewatering and a test mining period to assess the suitability of the proposed narrow vein cut and fill mining method to extract the high grade ore zones, the mine was placed back into production. It reached commercial production rates in March 1990 (WMC, 1995) at a rate of 800 tonnes per day.
WMC's initial approach was to drive small 2.5x2.5 metre cut and fill stopes adjacent to the "Trench" material. Dry waste rock backfill was placed after each lift. In most areas, the method allowed the high-grade ore on the carbonate‐Trench contact to be extracted. In one area WMC successfully tested the room and pillar mining method (Nesbitt Thomson, 1991). A total of 187,010 tonnes of ore at an average grade of 3.5% Pb and 7.47% Zn were mined during WMC's involvement on the property.
Hydrological difficulties causing poor ground conditions continued to play a factor in the mine operation. In May 1991, rising water levels due to the spring runoff forced the cessation of mining in a number of stopes and WMC decided to place the mine in project mode. Following the suspension of production in 1991, WMC carried out an extensive program to understand the mine hydrology and concluded that the groundwater could be successfully managed so that mining operations would no longer be adversely affected.
WMC has identified the Eastern zone of the deposit as an area for possible early development because ground conditions are substantially better due to the hanging wall being generally gypsum/anhydrite rather than Trench. The grade is also higher relative to other sections of the deposit. The Eastern area appears promising for additional resources. WMC thoroughly assessed the property in 1991 and prepared a revised mine plan to resume mine production. The revised plan provided for more mechanisation of the mining method, institution of paste backfill, increased groundwater drainage through screened drainage wells and a revised pumping system. However, the operation was WMC's only lead and zinc producer, was not associated with any downstream smelting facilities and was a smaller operation relative to other corporate assets. For these reasons, the property did not fit within WMC's corporate strategy to focus on large scale operations and for this reason the property was sold to Savage Resources.
1996 – 1999
After acquiring the Scotia Mine in 1996, Savage conducted two exploration drilling programs to fill in the gaps from prior drilling and improve the mineral resource estimate on the mine property. In December 1996, 36 diamond drill holes, totalling 1,325 metres were drilled in the central mine area adjacent to the underground mine entrance to test the continuity of the disseminated low-grade mineralisation in the back reef (known as the sand pit area –an area of commercial aggregate). In April and May 1997, an additional 30 diamond drill holes totalling 2,339 metres were drilled in the Northeast zone (as identified by WMC). Both programs were successful and confirmed the presence of low grade (in the central area) and high-grade mineralisation (in the Northeast zone). According to Cullen (1997), the results of the drilling (based on a 7% Zn‐equivalent cut‐off grade) enhanced some areas of the Northeast zone and diminished other areas. He also states that a complete revision of some of this area (with additional drilling evaluation) be completed prior to any production decision.
Savage dewatered the underground workings from June to August 1997 and started to rehabilitate the mine before a decision was made to extract the ore in the main, central zone using open-pit methods. An open-pit design was prepared using appropriate technical criteria for ore mining and waste stripping (Gemcom and WhittleTM 3‐D Optimization). The preliminary mine plan assumed the processing of 1,350 tonnes per day with the ore coming from a combination of underground (1,000 tonnes per day) and open-pit operations (350 tonnes per day).
In early 1999 ownership of Savage was transferred to the Australian mining company Pasminco Canada Limited ("Pasminco").
2001 – 2003
Regal Mines Limited (Regal Mines) purchased Pasminco Resources Canada Company ("Pasminco Resources") and its assets in February 2002. Regal was owned 50% by OntZinc Corporation ("OntZinc") and 50% by Regal Consolidated Ventures Limited ("Regal Consolidated"). As part of the sale, Pasminco Canada Holdings Inc. ("Pasminco Holdings") retained a 2% net smelter return (NSR) royalty on future production. OntZinc acquired Regal Consolidated's 50% interest in December 2002 to own 100% of Pasminco Resources. Savage Resources Limited is the successor of Pasminco Holdings and held the 2% royalty. Pasminco Resources was later renamed ScoZinc Limited ("ScoZinc"). The mining and environmental permits are still in force and are held by ScoZinc along with all the Scotia Mine assets.
2004 – 2006
Exploration activity by ScoZinc included diamond core drilling, a hydraulic mining test, prospecting of the general area, geological compilation of past relevant data and two lines (ten samples) of Mobile Metal Ion Geochemistry (MMI) across areas of known mineralisation covered by thick accumulations of glacial till. The results of the MMI survey were inconclusive.
A hydraulic mining test was performed to determine whether such a method might be useful to uncover the glacial overburden and some of the Trench material in the area of the low grade, potentially surface mineable resources. This was primarily performed near the area of the sand pit next to the original portal. Generally, the test showed that it is possible to mine the sandy overburden in the current pit bottom using dredging methods.
Six holes were drilled through the "Trench" unit using a soil drilling rig. The Trench is a geological unit that occurs between the gypsum and dolomite units. The purpose of this program was to characterize the soils that make up the Trench. Four holes were drilled in the Central Zone near the current pit. The two other holes were drilled near the highway (Hwy 224) in the East Zone.
The soil holes in the Central Zone around the current pit consisted mainly of dark brown clay with fine‐to‐ medium grained sand. Rock fragments, rounded‐to‐angular, were occasionally noted. The soil holes in the East Zone near the river and highway consisted of fine‐to‐medium grained sand with minor clay. This observation may be an important factor during future mining. Permeability underneath the river is expected to be high to a depth of at least 20‐30 metres. This will adversely affect slope stability should the walls of an open-pit approach the river.
Twenty-five diamond core drill holes (1,845.3 metres) were completed by ScoZinc on the Scotia Mine property. Seventeen of these holes were meant to further define the lead and zinc mineralization contained within the reef carbonate while the remaining eight holes were meant to test the gypsum potential immediately overlying the mineralised zones.
Four holes (477 metres) were completed in the north‐eastern portion of the deposit while thirteen holes (1,172 metres) were completed in the central area of possible lower grade open-pit mineralisation. The program was moderately successful in the central area with zinc values consistently in the 2 to 4% range over 1 to 2 metres (see Table 10‐1). The drilling program in the northeastern zone proved less successful with mineralised intervals being quite thin.
Four holes (673.3 metres) were drilled in the northeast zone and an additional four in the central area to test the overlying gypsum in the hanging wall of the base metal mineralisation. The holes were drilled to obtain core samples of the gypsum deposits that immediately overlie the mineralised zones. The purpose of the samples was to carry out early tests of gypsum consistency and quality as well as to confirm preliminary estimates of the probable size of the gypsum resource adjacent to the mineralised trend.
In most of the diamond drill holes, a gypsum "cap," 20‐30 metres thick was encountered. Grade was highest (greater than 90% gypsum) near the bedrock surface and decreased with depth. At 20‐30 metres depth, gypsum grade dropped below 80%, transitioning to anhydrite over an interval of approximately ten metres. Because the gypsum was quite hard, it was difficult to visually determine the contact between gypsum and anhydrite.
2007 – 2008
ScoZinc began surface mining the deposit in 2007 and carried on into 2008. Due to a drastic fall in metal prices, ScoZinc placed the mine on care and maintenance status.
In 2008, ScoZinc drilled 17 diamond drill holes through the Northeast Zone (refer to Section 10).
2011
Selwyn drilled a further 39 drill holes totaling 4,950.50 metres between August 11th and October 11th, 2011 (see Section 10.2.2).
9.1.2 Getty Zone
A description of mineral exploration work that was carried out on the Getty Zone was given in Cullen et al (2011):
"… with the exception of regional soil geochemical surveying by Penarroya Ltd. in 1964 (Rabinovitch, 1967) that did not identify the Getty Zone, no substantial mineral exploration efforts appear to have been carried out on the current Getty property prior to its acquisition by Getty in 1972.
"Exploration in the current deposit area was initiated in 1972 by Getty and joint venture partner Skelly Mining Corporation under terms of an option-purchase agreement with Millmore‐Rogers Syndicate".
"Discovery of the Getty zinc‐lead deposit is attributed to drill hole GGR‐12 which was completed in 1972 and intersected 4.63 metres of dolomite grading 15.48% combined zinc‐lead, beginning at a down hole depth of 93.11 metres. Subsequent completion of over 200 holes by Getty and Imperial on and around the property served to delineate a nearly continuous mineralized zone measuring approximately 1,300 metres in length and up to 200 metres in width (Comeau, 1973, 1974; Comeau and Everett, 1975)".
"Mercator completed a NI 43‐101 compliant Inferred Mineral Resource Estimate for Acadian on the Getty Zone with an effective date of December 12, 2007. This initial estimate was subsequently updated in a new NI 43‐101 compliant resource in 2008 (Cullen et al., 2008) after a total of 10,620 metres of drilling in 138 diamond drill holes had been completed by Acadian on the Getty property under the direct supervision of Mercator staff. The information used to complete these estimates was compiled from the 2007‐2008 drilling by Acadian plus historical drilling undertaken prior to Acadian's involvement in the property".
"Acadian initiated a major diamond drilling program on the Getty property in July 2007, and Mercator provided all site supervision, logging, sampling and quality control/quality assurance services to Acadian for this program, which consisted of 138 diamond drill holes. The purpose of the drilling was to upgrade geological confidence in the deposit, provide a basis for the new mineral resource estimate and to provide a higher category classification to the mineral resource estimate (Cullen et al, 2008)."
10 Drilling
Note: Item 10 has no change from Previous NI43-101 Technical Report by Carew, et al, 2020
10.1 Sample Length – True Width Relationship
The sample intervals do not necessarily represent true widths. The orientation of the deposit is variable, meaning the true width of any given intercept must be calculated with reference to the geological model. The orientation of the deposit is well known and is described in Section 7.2.
10.2 Main Zone (pre-2011)
To date, 1,419 diamond core drill holes have been drilled on the Main Zone (refer to Figure 7‐12 and Table 10-1). The majority were drilled to determine the characteristics of the zinc and lead mineralized dolomite.
ScoZinc drilled 17 holes totaling 1,613 metres through the Northeast Zone in 2008. These collars, as well as the collars from ScoZinc's 2004 program, are shown in magenta in Figure 7-12.
ScoZinc Mining drilled a further 39 drill holes totaling 4,950.50 metres between August 11th and October 11th, 2011 (see section 10.2.2).
Most of the 914 surface holes were drilled vertically. The azimuth and dip of the 467 holes drilled from the underground workings was variable.
Generally, holes were drilled so as to fully penetrate the dolomite reef and continue on until no more mineralisation was found. This resulted in most drill holes being drilled a few metres beyond the dolomite reef.
Historical logs are provided in the previous Technical Report for the property (MineTech, 2006).
| From | To | Holes with Info4 |
Metres | Time Frame | Company | ||||
|---|---|---|---|---|---|---|---|---|---|
| Surface Holes | |||||||||
| 1 | 72 | 70 | 2,951.17 | 1951-1952 | Gays River Lead Mines | ||||
| 73 | 740 | 646 | 59,123.60 | 1972-1982 | Imperial Oil/ Canada Wide Mines |
||||
| 741 | 900 | 89 | 7,596.80 | 1985-1995 | Seabright, then Westminer (undifferentiated) |
||||
| 901 | 966 | 66 | 3,664.00 | 1997 | Savage/ Pasminco | ||||
| 967 | 991 | 25 | 1,864.30 | 2004 | ScoZinc | ||||
| 1130-08 | 1146-08 | 17 | 1,613.50 | 2008 | ScoZinc | ||||
| MNZ-001 | MNZ-39 | 39 | 4,950.50 | 2011 | Selwyn | ||||
| Subtotal | 952 | 81,764.40 | |||||||
| Underground Holes | |||||||||
| 1 | 341 | 318 | 7,460.70 | 1979-1982 | Imperial Oil/ Canada Wide Mines (undifferentiated) |
||||
| 342 | 651 | 149 | 4,434.90 | 1985-1995 | Seabright, then Westminer | ||||
| Subtotal | 467 | 11,895.60 | |||||||
| Total | 1,419 | 93,660.00 |
Table 10-1: Historical Surface and Underground Diamond Drilling Activity3
Source: MineTech, 2012
3 Data supplied by ScoZinc
4 The electronic database does not contain information for underground holes 342‐499
10.2.1 Sample Statistics
The following summary is taken from MineTech International Ltd.'s 2012 Technical Report.
Sample statistics were calculated for sampling within the carbonate. All samples for which at least one metal (zinc or lead) was assayed were considered. Most samples were assayed for both zinc and lead. Depending on the amount of visible mineral, some samples were assayed for only one metal. The total sample count was 8,022.
The samples from the 2011 drill program were not included in the sample statistics calculations.
The mean sample interval length was 1.44 metres with a standard deviation of 0.82 metres (Table 10‐2). Skewness is a measure of symmetry, or more precisely, the lack of symmetry. The positive value for skewness indicates that the data is skewed right, meaning that the right tail is heavier than the left tail. This is also shown in the histogram in Table 10‐3. The aggregate sample length was 11,522 metres.
The mean zinc grade was 3.55%. From the histogram, we can see that zinc assays are approximately lognormal. The range in zinc content was zero to 62.10%. Theoretically, the maximum possible zinc assay is 67.10% ‐ the zinc content of pure sphalerite.
The mean lead grade was 1.91%. From the histogram, we can see that lead assays are also approximately lognormal. The range in lead content was zero to 79.50%. Theoretically, the maximum possible lead assay is 86.6% ‐ the lead content of pure galena.
| Descriptive Statistic | Zinc Grade (%) | Lead Grade (%) |
|---|---|---|
| Mean | 3.55 | 1.91 |
| Standard Error | 0.08 | 0.07 |
| Median | 1.52 | 0.12 |
| Mode | 0.02 | 0.01 |
| Standard Deviation | 6.79 | 6.24 |
| Sample Variance | 46.17 | 38.99 |
| Kurtosis | 25.17 | 52.86 |
| Skewness | 4.60 | 6.56 |
| Range | 62.10 | 79.50 |
| Minimum | 0.00 | 0.00 |
| Maximum | 62.10 | 79.50 |
| Sum | n/a | n/a |
| Count | 8,022 | 8,022 |
Table 10-2: Descriptive Statistics
| Zinc Histogram | |||
|---|---|---|---|
| Range | Frequency | Cumulative % | |
| ٥ | 39 | .49% | 100.% 5000 |
| $0 - 1$ | 3056 | 38.58% | Frequency 90.% |
| $1-2$ | 1599 | 58.51% | Cumulative % |
| $2 - 3$ | 999 | 70.97% | 4000 80.% |
| 3-4 | 603 | 78.48% | 70.% |
| $4 - 5$ | 393 | 83.38% | |
| 5-6 | 259 | 86.61% | 3000 60.% |
| $6 - 7$ | 174 | 88.78% | Frequency 50.% |
| $7 - 8$ | 123 | 90.31% | |
| $8-9$ | 132 | 91.96% | 2000 40.% |
| $9 - 10$ | 74 | 92.88% | 30.% |
| $10 - 12$ | 118 | 94.35% | |
| $12 - 14$ | 68 | 95.20% | 1000 20.% |
| 14-16 $16 - 18$ |
58 42 |
95.92% 96.45% |
10.% |
| 18-20 | 33 | 96.86% | |
| 20-25 | 65 | 97.67% | ٥ |
| 25-30 | 41 | 98.18% | 1 10 100 |
| 30-35 | 33 | 98.59% | Zinc Grade (%) |
| 35-40 | 27 | 98.93% | |
| 40-45 | 23 | 99.21% | |
| 45-50 | 32 | 99.61% | |
| 50-55 | 15 | 99.80% | |
| 55-60 60-65 |
14 2 |
99.98% | |
| 65+ | ٥ | 100.00% 100.00% |
|
| Lead Histogram | |||
| Range | Frequency | Cumulative % | |
| ٥ | 851 | 10.61% | |
| $0 - 1$ $1-2$ |
5200 616 |
75.43% 83.11% |
5000 100.% |
| $2 - 3$ | 347 | 87.43% | Frequency 90.% |
| $3 - 4$ | 173 | 89.59% | Cumulative % 4000 80.% |
| 4-5 | 141 | 91.35% | |
| $5-6$ | 94 | 92.52% | 70.% |
| $6 - 7$ | 73 | 93.43% | 3000 60.% |
| $7-8$ | 70 | 94.30% | Frequency 50.% |
| $8 - 9$ | 59 | 95.04% | 2000 40.% |
| $9 - 10$ 10-12 |
45 | 95.60% 96.56% |
|
| $12 - 14$ | 77 34 |
96.98% | 30.% |
| $14 - 16$ | 33 | 97.39% | 1000 20.% |
| $16 - 18$ | 25 | 97.71% | 10.% |
| $18 - 20$ | 12 | 97.86% | |
| 20-25 | 41 | 98.37% | 0 .% |
| 25-30 | 26 | 98.69% | 10 100 1 |
| 30-35 | 29 | 99.05% | Lead Grade (%) |
| 35-40 40-45 |
17 10 |
99.26% 99.39% |
|
| 45-50 | 15 | 99.58% | |
| 50-55 | 10 | 99.70% | |
| 55-60 | 7 | 99.79% | |
| 60-65 | з | 99.83% | |
| 65-70 | 7 | 99.91% | |
| 70-75 | з | 99.95% | |
| 75-80 | 4 | 100.00% | |
| $80+$ | o | 100.00% | |
Figure 10-1: Sample Histogram for Zn and Pb


Source: MineTech, 2012
10.3 Main Zone Drilling (post 2011)
10.3.1 Type and Extent of Drilling
ScoZinc Mining drilled a further 39 drill holes (Table 10-3) totalling 4,950.50 metres between August 11th and October 11th, 2011. Of the 39 holes drilled, 34 were drilled on Mineral Lease 10‐1 and five were drilled on Exploration License 6959. Three of the 39 holes were drilled to the north‐east of the existing pit, while the remaining 36 were drilled in a broad area to the southwest of the pit. The deepest hole was 195 metres deep, the shallowest was 43 metres, and the mean depth was 128 metres. Drilling was carried out by Logan Drilling Group of Stewiacke, Nova Scotia.
Drill holes were planned to target zinc‐lead sulphide mineralization that possessed the potential to expand upon the current mineral resource or provide greater definition. Targets were primarily chosen to the southwest of the current mine pit, along the margins of, and clustered toward the southwest extent of the Main Zone.
10.3.2 Drilling Procedures
Once targets were determined, drill collar locations were calculated using a projected drill hole inclination that would intersect the Gays River Formation carbonate bank front at an angle closest to perpendicular. Targets were fine‐tuned based on ground factors, including terrain, proximity to watercourses, and property boundaries.
Drilling was carried out under the direction of ScoZinc Exploration staff. A skid‐mounted Longyear‐38 diamond drill was used to complete all drill holes, and was dragged onto each drill pad with the assistance of a small John Deer bulldozer. In addition to the drill, a covered water pump and drill rod sloop were also dragged to the area by bulldozer.
All recovered core was boxed, lidded and returned to the ScoZinc core shack where it was logged and sampled by ScoZinc exploration staff.
All drill core was logged, cut and sampled by ScoZinc staff at the ScoZinc core shack, ScoZinc mine complex. Both geotechnical and geological data was collected from all drill core. Geotechnical data collected included Total Core Recovery, RQD, strength and weathering data, "Q System" discontinuity orientation data, and RMR system data. Geological data collected included stratigraphic contacts, as well as all lithological, mineralogical, and structural observations of note.
10.3.3 Sampling
Thirty-eight drill holes intersected the Gays River Formation ("GRFM"). Silver and base metal analyses were conducted by a 23‐element, four‐acid digestion, ore‐grade ICP‐AES technique. Drill hole MNZ‐005 was not sampled, as it did not intersect GRFM.
A total of 722 samples were submitted to Acme Analytical Laboratories in Vancouver ("Acme"). Of those 722 samples, 559 samples (77.4%) were actual core samples and 163 samples (22.6%) were QA/QC samples (see section 11.4).
All but one drill hole (MNZ‐005) successfully intersected the mineralized Gays River Formation, although thicknesses and grades were somewhat variable.
| Hole ID | UTM Easting | UTM Northing | Elev. (m) | Az (true) | Dip | EOH (m) |
|---|---|---|---|---|---|---|
| MNZ-001 | 472840.32 | 4986616.85 | 23.8 | 154 | -75 | 165.1 |
| MNZ-002 | 472817.22 | 4986556.71 | 32.51 | 155 | -75 | 194.9 |
| MNZ-003 | 472745.12 | 4986528.99 | 37.54 | 152 | -65 | 161 |
| MNZ-004 | 472705.01 | 4986537.07 | 39.28 | 155 | -60 | 152 |
| MNZ-005 | 472909.24 | 4986221.07 | 44.15 | 160 | -87 | 56 |
| MNZ-006 | 472581.14 | 4986477 | 45.45 | 158 | -70 | 176 |
| MNZ-007 | 472714.91 | 4986245.28 | 46.25 | 158 | -80 | 63 |
| MNZ-008 | 472548.94 | 4986453.18 | 46.78 | 143 | -70 | 194 |
| MNZ-009 | 472577.79 | 4986408.98 | 45.01 | 155 | -70 | 167 |
| MNZ-010 | 472668.51 | 4986234.87 | 47.74 | 152 | -80 | 92.3 |
| MNZ-011 | 472467.67 | 4986438.44 | 42.8 | 157 | -70 | 179 |
| MNZ-012 | 472492.13 | 4986422.43 | 43.95 | 150 | -50 | 165 |
| MNZ-013 | 472593.28 | 4986232.83 | 51.07 | 158 | -75 | 80 |
| MNZ-014 | 472460.65 | 4986399.3 | 45.53 | 152 | -60 | 147.5 |
| MNZ-015 | 472403.74 | 4986408.57 | 45.69 | 154 | -65 | 143 |
| MNZ-016 | 472334.97 | 4986387.29 | 44.59 | 146 | -65 | 161.8 |
| MNZ-017 | 472317.75 | 4986327.62 | 46.19 | 140 | -75 | 187 |
| MNZ-018 | 472435.54 | 4986153.22 | 51.11 | 150 | -62 | 101 |
| MNZ-019 | 472248 | 4986285.53 | 42 | 160 | -81 | 164 |
| MNZ-020 | 472347.33 | 4986078.11 | 52.03 | 151 | -80 | 65 |
| MNZ-021 | 472173.21 | 4986281.68 | 37.36 | 152 | -66 | 155 |
| MNZ-022 | 472077.24 | 4986272.6 | 20.88 | 150 | -70 | 135 |
| MNZ-023 | 472207.9 | 4986094.9 | 46.49 | 148 | -80 | 74 |
| MNZ-024 | 472238.97 | 4986038.08 | 47.46 | 134 | -87 | 68 |
| MNZ-025 | 472310.88 | 4985911.89 | 46.89 | 150 | -87 | 43.2 |
| MNZ-026 | 472087.89 | 4986245.72 | 26.58 | 150 | -52 | 136 |
| MNZ-027 | 472135.85 | 4986130.58 | 40.68 | 150 | -60 | 84 |
| MNZ-028 | 472044.77 | 4986205.24 | 20.97 | 338 | -79 | 140 |
| MNZ-029 | 472047.95 | 4986148.28 | 27.68 | 152 | -51 | 95 |
Table 10-3: 2011 Drill Collar Summary
| MNZ-030 | 472099.7 | 4986061.13 | 38.52 | 163 | -86 | 74.4 |
|---|---|---|---|---|---|---|
| MNZ-031 | 472044.76 | 4986202.24 | 20.97 | 237 | -65 | 136 |
| MNZ-032 | 472125.32 | 4985935.07 | 53.32 | 323 | -79 | 116 |
| MNZ-033 | 472078.81 | 4985964.98 | 48.72 | 217 | -76 | 143 |
| MNZ-034 | 471955.78 | 4986084.56 | 31.66 | 150 | -83 | 106 |
| MNZ-035 | 471937.9 | 4986048.18 | 33.99 | 147 | -65 | 122.7 |
| MNZ-036 | 471954.85 | 4986081.72 | 31.36 | 276 | -70 | 164 |
| MNZ-037 | 473401.79 | 4986905.02 | 18.47 | 145 | -86 | 191 |
| MNZ-038 | 473488.02 | 4986897.65 | 19.42 | 126 | -64 | 133.9 |
| MNZ-0039 | 473667.1 | 4986733.54 | 30.92 | 170 | -87 | 53 |
Source: MineTech, 2012
10.4 Getty Zone
Drilling on the Getty Zone is described in Cullen et al (2011), and the reader is directed to this report for further details.
10.5 Gypsum
In December 2020, fifty-nine (59) gypsum samples were taken from historic core in 6 drillholes located onsite. The samples were sent to the Dalhousie Minerals Engineering Center for processing. These holes combined with 99 pre-existing gypsum assays from the historic data base resulted in having 158 samples, from 20 different holes, to model the mineralized gypsum intervals. All holes used to model the gypsum intervals are listed in table 10-5.
| Hole ID | MineGrid Easting |
MineGrid Northing |
Elev. (m) | EOH (m) | Zone | |
|---|---|---|---|---|---|---|
| MNZ-001 | 8407.37 | 7060.45 | 23.80 | 165.1 | MZ | |
| MNZ-009 | 8148.68 | 6847.71 | 45.01 | 167.0 | MZ | |
| MNZ-016 | 7906.22 | 6821.54 | 44.59 | 161.8 | MZ | |
| MNZ-026 | 7662.24 | 6675.93 | 26.58 | 136.0 | MZ | |
| MNZ-028 | 7619.83 | 6633.68 | 20.97 | 140.0 | MZ | |
| MNZ-037 | 8963.83 | 7359.38 | 18.47 | 191.0 | MZ | |
| S975 | 8527.30 | 6915.00 | 28.20 | 134.0 | MZ | |
| S976 | 8527.30 | 6915.00 | 28.20 | 104.0 | MZ | |
| S977 | 10009.00 | 7666.00 | 25.00 | 103.0 | NE | |
| S978 | 10040.00 | 7733.00 | 27.00 | 107.0 | NE | |
| S979 | 8577.70 | 7153.90 | 18.20 | 98.0 | MZ | |
| S982 | 9985.00 | 7726.00 | 29.00 | 137.0 | NE | |
| S983 | 10023.00 | 7758.00 | 28.00 | 130.6 | NE | |
| S984 | 9408.40 | 7612.20 | 21.00 | 98.0 | NE | |
| S985 | 9380.30 | 7652.90 | 21.00 | 92.0 | NE | |
| S986 | 9526.20 | 7638.10 | 25.00 | 68.0 | NE | |
| S988 | 8187.00 | 6742.10 | 45.00 | 95.0 | MZ | |
| S989 | 8151.00 | 6768.40 | 46.00 | 98.0 | MZ | |
| S990 | 7941.40 | 6683.70 | 47.00 | 103.0 | MZ | |
| S991 | 7964.00 | 6651.00 | 50.00 | 95.9 | MZ |
Table 10-4: DDH's Used to Model Gypsum
11 Preparation, Analyses, and Security
11.1 Gypsum
11.1.1 Site Procedures
Samples were taken from core stored in the Scotia Mine Core Shack. Drill core was selected strategically based on the location of the hole within the outlined pit area.
The selected drill core was cut and sampled by ScoZinc staff. Three metre samples of gypsum drill core were bagged as were regular QA/QC blank samples. The samples were half the core cut longitudinally with a diamond bladed rock saw. One half of the sample was placed back in the core box for storage, and the other half was halved again with the rock saw into a quarter. One of the quarters was placed back into the core box for storage and the other was bagged and sent away for assay in Halifax.
11.1.2 Laboratory Procedures
Samples were assayed at Minerals Engineering Centre, at Dalhousie University, for preparation and analysis. The Minerals Engineering Centre is independent of the issuer. Gypsum Chloride analysis description was supplied by the Minerals Engineering Centre, Dalhousie University.:
Gypsum sample preparation is described below:
"At the Minerals Engineering Centre:
"Samples were air dried at less than 45°C prior to preparation.
"Samples are crushed with a lab jaw crusher to produce a minus 10.0 mm sample.
"The crushed samples are the split with riffle splitter to produce a 1000 grams samples which are then pulverized with a ring and puck pulveriser to approximately 100% passing 100 mesh (~0.15mm).
"Gypsum samples were pulverized for approximately 45-60 seconds in order to preserve combined crystalline water in the samples. Equipment is cleaned with jets of air and silica sand between samples.
"Gypsum Oxide analysis described by the Minerals Engineering Centre include Al2O3, BaO, CaO, Cr2O5, Fe2O3, K2O, MgO, MnO, Na2O, P2O5, SiO2, SrO, TiO2, V2O5, and ZrO2.
"Samples (0.05 to 0.5g) are mixed with a flux of lithium metaborate and lithium tetraborate (2.000g). The mix is fused in platinum crucibles at 1050ºC using a Claisse M4 fusion fluxer. The fusion is quenched and dissolved in 10% nitric acid in a 150ml Teflon beaker. The solution is made up to 250ml in a volumetric flask. Dilutions may be required for analysis of some elements. The elements are determined by ICP OES. Reference samples from CANMET and other recognized agencies are analyzed with the samples to ensure that the fusions, digestions, and ICP OES analysis are complete and accurate.
"Loss on Ignition (LOI) is performed using porcelain crucibles and a muffle furnace. A 0.5000 to 1.0000 gram sample is weighed into the porcelain crucible and heated to 1000 ºC for one hour. The weight loss is calculated and reported as % LOI.
"Gypsum/Anhydrite is calculated mathematically using the water/LOI and major oxides results." (MEC 2021)
A total of 169 samples were assayed at the Minerals Engineering Centre of which 159 were ScoZinc Gypsum assays, 5 were blanks (placed by ScoZinc), 2 were gypsum standards provided by The Minerals Engineering Centre, and 3 were duplicates performed by the Minerals Engineering Centre. The duplicates showed excellent repeatability and the standards were accurate.
Note: Item 11 from here on is the same as the most recent NI 43-101 Technical Report by Carew, et al, 2020
11.2 Sample Preparation and Analyses
11.2.1 Getty Zone (pre‐2008)
Sample preparation, analysis and security measures for the Getty Zone were described in Cullen et al (2011). In part, Cullen et al remark that:
"Reports documenting the Getty and Esso drilling programs in the Getty zone area do not provide detailed descriptions of sample preparation methodologies, analytical procedures or security considerations. However, both Getty and Esso were major, reputable exploration companies carrying out exploration programs in various settings at that time. More specifically, Esso was also in the process of defining reserves at the adjacent Main Zone mine at the time and appears to have employed the same operating protocols for Getty drilling as were applied at the adjacent development property. Mercator is of the opinion that, while not specifically detailed in historic reporting, procedures employed by both Getty and Esso for sample preparation, record keeping, chemical analysis, and security, would have met industry standards of the day. This assertion is supported by review of original drill logs and supporting data, physical review of archived core and through recognition that both companies completed resource estimate and preliminary development assessments based on the same historic drilling results." (Cullen et al, 2011, section 12.1)
11.2.2 Main Zone (pre‐2008)
There is no written record regarding the sampling method employed during the early exploration years (i.e.: pre‐ 1970's) in the Scotia Mine area.
The exploration approach and sample collection procedures employed by the more recent exploration efforts reflects thorough sampling methodology and documentation procedures. Exploration activity was carried out in a professional manner by a team of local, experienced geologists and technicians supervised by Esso's, Seabright's, Westminer's, Savage's, and ScoZinc's professional staff. The work has been well organised throughout their exploration efforts and more recently computer facilities were available to generate reports and prepare maps, etc. from the vast database.
The assay data and other parameters for all core drilling programs and underground work were entered into a computerised database using Microsoft Excel and resource estimate generating software programs. The quality control and validation of the coded data included steps to ensure that the assay intervals and the sample locations were correct. To ensure accuracy of the database, all assays were coded and the data entry system automatically checked for interval overlaps. The coded assays were also printed and a visual inspection was completed for comparison with the original (logged) data sheets. The sample locations were validated with appropriate plotting and visual checks against the original sections and plans.
Core drilling was carried out using North American service providers with the collection of BQ and NQ core. The portions of core to be analysed were either split or sawed into two sections with one half submitted for analysis, the other half remaining in the core tray. All sampling procedures were carried out on site.
Sampled core lengths were determined visually. All drill holes were logged, noting lithology, structure, alteration and mineralisation. Core recovery was generally greater than 90%. Early in the exploration program, the samples were sent via air cargo to several analytical laboratories; however, after the construction of the mill facility, the internal laboratory was used.
Core samples from Savage's 1997 drilling program and ScoZinc's 2004 drilling program were submitted to the Minerals Engineering Centre of Dalhousie University (formerly Technical University of Nova Scotia) in Halifax. The laboratory is independent of Savage, ScoZinc and Selwyn. The laboratory is not International Standard Organisation (ISO) accredited.
According to the Minerals Engineering Centre, the core sample preparation procedure was as follows: the samples were dried, and then crushed in one or more jaw crushers, depending on the original size, to under one‐quarter inch. The sample was then split in a Jones riffle to a mass of 150‐200 grams. The sample was then pulverised using a ring and puck pulveriser to 80% minus 200 mesh (75 microns). Then it was put into either a bag or a vial. Rejects were kept for six months.
The sample analysis procedure consisted of the following: one-gram sample lots were digested with hydrochloric‐nitric‐hydrofluoric‐perchloric acids. Elements were determined by Flame Atomic Absorption with detection limit of 1 ppm. Arsenic was determined by atomic absorption/hydride generation method.
Reference standards from CANMET were routinely used as internal checks on the accuracy of the analysis.
11.2.3 Scotia Mine Deposits (2008)
Cullen (2011) provided the following description for the sampling methods that were used for the 2008 drilling program (Scotia Mine Deposits).
11.2.3.1 Sample Security and Chain of Custody
In accordance with the sample protocol established by Mercator for the 2008 drilling program, all drill core was delivered from the drill site to the secure and private core logging facility at Acadian's Scotia Mine by either Logan Drilling Limited staff or Mercator field staff. Drill core logging was carried out by a Mercator geologist who also marked core for sampling and supervised core splitting by a technician using a rock saw. Sample tag numbers from a three-tag sample book system were used for the program, with one tag showing corresponding down hole sample interval information placed in the sampled core boxes at appropriate locations, one tag lacking down hole interval information placed in the core sample bag for shipment to the laboratory, and the third tag with sample interval information retained in the master sample book for future reference and database entry purposes. After sampling, core boxes were closed and placed in storage at the Scotia Mine site. Sealed sample bags were placed in an ordered sequence prior to insertion of quality control samples, preparation of sample shipment documentation, checking, and placement in plastic buckets for shipment by commercial courier to Eastern Analytical Limited ("Eastern"), a recognized commercial laboratory located in Springdale Newfoundland. A check pulp sample split was prepared at Eastern for every 25th submitted sample and these were labelled, placed in a sealed envelope and returned to Mercator. After insertion of certified standard and blank samples, all check samples were sent to ALS Chemex in Sudbury, ON for independent analysis of zinc and lead levels. All other prepared pulps and coarse reject material was stored at Eastern until the end of the program, at which time they were shipped back to Scotia Mine for secure archival storage.
11.2.4 Laboratory Procedures
Core Sample Preparation
Core samples received by Eastern were organized and labelled and then placed in drying ovens until completely dry. Dried samples were crushed in a Rhino Jaw Crusher to consist of approximately 75% minus 10 Mesh material. The crushed sample was riffle split until 250 to 300 grams of material was separated and the remainder of the sample was bagged and stored as coarse reject. The 250 – 300 gram split was pulverized using a ring mill to consist of approximately 98% minus 150 Mesh material. All samples underwent ICP analysis, for which a 0.50g portion of the pulverized material was required. Those samples containing greater than 2,200 ppm of zinc or lead were then processed using ore grade analysis for which 0.20g of pulverized material was required. Laboratory sample preparation equipment was thoroughly cleaned between samples in accordance with standard laboratory practise.
Check sample splits of pulverised core were submitted to the ALS Chemex laboratory facility in Sudbury, Ontario as part of the project quality control and assurance protocol. This material was prepared in approximately 100-gram bagged splits by Eastern and returned to Mercator for subsequent submission to ALS Chemex. Since the received split material had already been pulverised, further preparation was limited to homogenization and splitting of a 0.4g portion for subsequent analysis.
11.2.5 Core Sample Analysis
Eastern Analytical procedures outlined below pertain to all core samples from the 2008 drill program.
ICP Analysis: A 0.50-gram sample is digested with 2ml HNO3 in a 95o C water bath for ½ hour, after which 1ml HCL is added and the sample is returned to the water bath for an additional ½ hour. After cooling, samples are diluted to 10ml with deionized water, stirred and let stand for 1 hour to allow precipitate to settle.
For ore grade analysis base metals (lead, zinc, copper), a 0.20g sample is digested in a beaker with 10ml of nitric acid and 5ml of hydrochloric acid for 45 minutes. Samples are then transferred to 100ml volumetric flasks and analyzed on the Atomic Absorption Spectro‐Photometer (AA). The lower detection limit is 0.01% and the upper detection limit is >2,200 ppm lead or zinc.
For silver, a 1,000 mg sample is digested in a 500ml beaker with 10ml of hydrochloric acid and 10ml of nitric acid with the cover left on for 1 hour. Covers are then removed, and the liquid is allowed to evaporate leaving a moist paste. 25ml of hydrochloric acid and 25ml of deionised water are then added and the solution is gently heated and swirled to dissolve the solids. The cooled material is transferred to 100ml volumetric flask and is analyzed using AA. The lower detection limit is 0.01oz/t of silver with no upper detection limit.
A prepared sample is digested in 75% aqua regia for 120 minutes. After cooling, the resulting solution is diluted to volume (100 ml) with de‐ionized water, mixed and then analyzed by inductively coupled plasma ‐ atomic emission spectrometry or by atomic absorption spectrometry.
11.2.6 Main Zone (2011)
11.2.6.1 Site Procedures
All drill core was logged, cut and sampled by ScoZinc staff at the ScoZinc core shack, ScoZinc mine complex. Sampling of mineralized core from the Gays River Formation and adjacent units involved breaking the mineralized range into 20‐150 cm samples, inserting regular QA/QC duplicate, blank and standard samples as per company protocol, and halving each sample longitudinally with a diamond bladed rock saw. One half of the sample was placed back in the core box for storage, and the other half was bagged and sent away for assay in Vancouver.
11.2.6.2 Laboratory Procedures
Samples were assayed at Acme Analytical Laboratories in Vancouver ("Acme") for preparation and analysis. The Acme laboratory in Vancouver is certified ISO 9001 2008 compliant for the provision of assays and geochemical assays. Acme is independent of the issuer.
Samples were weighed, analyzed using four‐acid digestion multi‐element ICP‐ES (method 7TD), and tested for specific gravity (method G8SG).
The general sample preparation method used by Acme for rock and drill core is described as follows:
Rock and Drill Core crushed to 80% passing 10 mesh (2 mm), homogenized, riffle split (250g, 500g, or 1,000g subsample) and pulverized to 85% passing 200 mesh (75 microns). Crusher and pulveriser are cleaned by brush and compressed air between routine samples. Granite/ Quartz wash scours equipment after high‐grade samples, between changes in rock colour and at end of each file. Granite/ Quartz is crushed and pulverized as first sample in sequence and carried through to analysis.
Method 7TD is described by Acme as follows:
0.5g sample split is digested to complete dryness with an acid solution of H2O‐HF‐HClO4‐HNO3. 50% HCl is added to the residue and heated using a mixing hot block. After cooling the solutions are made up to volume with dilute HCl in class A volumetric flasks. Sample split of 0.1g may be necessary for very high‐grade samples to accommodate analysis up to 100% upper limit.
Method G8SG is described by Acme as follows:
G812 Specific Gravity Pulp, SG: A split of dry pulp is weighed to a class A volumetric flask. Flask and pulp are weighed precisely on a top‐loading balance. Measure and record the weight then calculate for specific gravity.
G813 Specific Gravity Core, SG: Analysis can be conducted on whole samples of rock or core in irregular shape. Specific gravity is determined by measuring the displacement of water. A sample is dried at 105°C to remove all moisture then allowed to cool. The sample of the rock or drill core is first weighed in air then submerged in a container of water. Measure the mass of immersed sample and record the weight then calculate for specific gravity. Sample can also be coated with a thin layer of hot wax so that any soluble material in the core or rock is not in contact with the water.
11.2.6.3 Quality Control Samples
Of the 722 samples sent to Acme, 51 were standards, 58 were duplicates, 54 were blanks, for a total of 163 QA/ QC samples. The remaining 559 were regular assays.
Of the blanks, all but one were at the lower detection limit for lead (0.01%) while a single sample was above the lower detection limit, with a value of 0.02% lead. Similarly, all but three of the blanks were at the lower detection limit for zinc (0.005%) while three samples were above the lower detection limit, with values of 0.01%, 0.02% and 0.04%.
Of the duplicates, 38 of the 58 had a difference in lead at or below the detection limit. For the remaining samples, the average difference was 0.24% lead; 9 samples had a difference at or above 0.20% lead, with the greatest difference being 0.91% lead.
24 of the 58 duplicates had a difference in zinc at or below the detection limit. For the remaining samples, the average difference was 0.19% zinc; 9 samples had a difference at or above 0.20% zinc, with the greatest difference being 0.95% zinc.
Two types of standard were used – Standard F (28 used) and Standard G (23 used). Both were created by WCM Sales Ltd. Standard F has a mean value of 1.240% lead and 2.000% zinc, while Standard G has a mean value of 6.680% lead and 3.780% zinc, both with a tolerance of +/‐ 2 standard deviations.
The table below summarizes the results:
| Standard | Expected Value | Average Tested Value |
Minimum Tested Value |
Maximum Tested Value |
|---|---|---|---|---|
| Standard F – Lead | 1.240% | 1.21% | 1.14% | 1.28% |
| Standard F – Zinc | 2.000% | 2.13% | 2.02% | 2.22% |
| Standard G – Lead | 6.680% | 6.55% | 6.20% | 7.11% |
| Standard G – Zinc | 3.780% | 3.91% | 3.76% | 4.06% |
Table 11-1: 2011 Sampling Standards
Source: MineTech, 2012
Results from the check samples are within acceptable limits.
11.2.6.4 Umpire Assays
Split pulps of 135 samples were re‐analysed at the ALS Minerals laboratory in Vancouver ("ALS"). ALS Minerals is a division of ALS Ltd., and is independent of the issuer and is certified to the ISO/IEC 17025:2005 by the Standards Council of Canada (SCC).
The comparison found that the vast majority of the split pulps are within a +/‐15% tolerance. After correcting for the lower detection limit, two zinc samples containing less than 0.1% zinc and one lead sample containing more than 0.1% lead had a difference of more than 15% between the Acme and ALS assay results. Overall, the results are acceptable and serve to confirm the results of the wider body of Acme lab samples.
12 Data Verification
Note: Item 12 has no change from Previous NI43-101 Technical Report by Carew, et al, 2020
12.1 Main Zone
SRK has reviewed the sampling results and verified that the sample types and density are adequate for estimating mineral resources. The sampling results are representative of the style of mineralization. The available information and sample density allow a reliable estimate to be made of the size, tonnage and grade of the mineralization in accordance with the level of confidence established by the Mineral Resource categories in the CIM Standards.
12.1.1 Database Validation
A sample of 59 drill holes (4.3%) was selected for database validation. The collar locations, downhole survey data, geological logs and assay data in the database were compared against the original, written logs.
ScoZinc provided scanned original drill logs in Adobe (.pdf) format. An up‐to‐date copy of the electronic database of all drill hole information was also provided. An additional data file of drill hole coordinates was supplied, as many of the original drill logs did not have co‐ordinates.
The 59 holes selected (Table 12-1) were predominately located within areas with the highest economic potential, but the selection process also strived to provide good coverage for the whole deposit. This amounted to 4.3% of the more than 1,400 holes drilled on the property.
Printouts were made of the relevant sections of each of the holes and also of the assay data of the corresponding assay intervals. The assays were printed on the reverse of the drill logs. Co‐ordinates on the log and database were manually compared.
The data in the Excel database and original drill logs were manually compared. They were found to be, for the most part, comparable. Many of the original drill logs, both underground and surface, did not have collar co‐ ordinates or downhole survey data. Another database was located that contained the required information. It is more than likely that the holes were surveyed, and the information filed in a separate location from the original logs.
| S61 | S352 | S613 | S882 | U047 | U206 |
|---|---|---|---|---|---|
| S69 | S390 | S634 | S938 | U057 | U217 |
| S71 | S404 | S648 | S939 | U061 | U218 |
| S85 | S423 | S663 | S943 | U073 | U246 |
| S94 | S431 | S690 | S956 | U087 | U259 |
| S110 | S466 | S703 | S975 | U093 | U290 |
| S183 | S473 | S705 | S976 | U106 | U297 |
| S220 | S555 | S726 | S980 | U129 | U321 |
| S251 | S568 | S843 | U003 | U148 | U337 |
| S268 | S574 | S857 | U008 | U174 |
Table 12-1: Holes that Were Verified During the Database Validation
The following holes were found to have discrepancies between the original data from the drill logs and the final database:
S 69
Data base 73.76 – 75.59 lead 0.01% Original Log 73.76 – 75.59 lead 0.32%.
S 110
Assay data for database match that on original log. However, a hand‐written correction on the log shows reduced lead and zinc values.
S 663
Minor sample depth errors – not significant.
S 703
Assays on original log for interval 89.0 – 99.83 metres not shown. These were likely assayed at a later date.
S 726
Assay section on original log 77.72 – 83.82 m (6.1m) used on database. Original log interval was corrected by hand at a later date to 2 ft (0.61m).
U 129
Sample from 115' – 125' (10') misread as 115' – 128' (13'). Written entry on original log looks like 128'.
U 218
Azimuth on database shows 235 degrees, which is consistent with other angle holes with the same co‐ ordinates. However, a listing in another database shows an azimuth of 180 degrees. It is more than likely that the database listing is correct.
12.1.2 Data Validation Conclusion
With the exception of Hole S 110 and S 726 where significant assay intervals and values were involved, the remainder of the holes do not represent any factor that would change the status of the deposit. In general, the data transfer from the original logs was of high quality and the database was considered a valid representation of the mineral deposit.
12.1.3 Verification Sampling
The Scotia Mine property was visited by Mr. Reg Comeau of ACA Howe on June 17 and June 21 and on September 22 and September 26, 2004, in order to become familiar with the area and to conduct verification sampling on the property. Split, random, core samples were inspected and sampled from the site on the second visit from the 2004 drilling campaign in the area of the proposed low grade open-pit in the central portion of the deposit as well as the higher grade zone in the Northeast zone. A second set of core samples from the 1997 drilling campaign were later collected by Mr. Doug Roy.
Samples from 1997 and 2004 drilling campaigns were collected, packaged and independently shipped by Reg Comeau. All samples were taken from the remaining half core samples in the core boxes and were sawed in half reflecting a quarter core sample. The remaining quarter core was left in the core tray. The samples were packaged and shipped to ACA Howe's office in Toronto, then shipped to and analyzed by SGS Toronto. The comparison of assay results is shown in Table 12-2.
The comparison of analytical results between SGS and the original 1997 samples and the samples from the 2004 drilling program (analyzed at Minerals Engineering Centre of Dalhousie University) was excellent.
SRK is satisfied that the assay data base for the property is sound and sufficient for the purpose of estimating mineral resources.
| Hole # | From (m) | To (m) | Interval (m) |
Original Assay Zn (%) Pb (%) |
Howe Sampling Zn (%) Pb (%) |
|||||
|---|---|---|---|---|---|---|---|---|---|---|
| From Pit Area | ||||||||||
| S968 | 2.7 | 4.7 | 2 | 3.38 | 0.29 | 3.62 | 0.14 | |||
| S969 | 8 | 10 | 2 | 2.15 | 0 | 2.22 | 0 | |||
| S971 | 2.9 | 4.9 | 2 | 4.63 | 0 | 3.91 | 0 | |||
| S972 | 14.3 | 16.3 | 2 | 1.86 | 0.18 | 2.06 | 0.17 | |||
| S973 | 74 | 75 | 1 | 11.9 | 14.98 | 14.18 | 17.25 | |||
| S974 | 66.8 | 68 | 2 | 2.46 | 2.22 | 2.59 | 1.95 | |||
| S976 | 98.1 | 98.45 | 0.35 | 7.66 | 0.23 | 7.19 | 0.17 | |||
| Northeast Zone | ||||||||||
| S977 | 96 | 96.4 | 0.4 | 6.77 | 0.01 | 9.47 | 0.01 | |||
| S982 | 133.3 | 133.6 | 0.3 | 0.84 | 0.32 | 0.84 | 0.18 |
Table 12-2: Results of Verification Sampling (2004 Drilling Program by ScoZinc)
Source: MineTech, 2012
Table 12-3: 1997 Drilling Program by Westminer
| Hole # | From (m) | To (m) | Interval (m) |
Original Assay Zn (%) Pb (%) |
Howe Sampling Zn (%) Pb (%) |
||||
|---|---|---|---|---|---|---|---|---|---|
| From Pit Area | |||||||||
| 18.4 | 19.9 | 1.5 | 2.82 | 0.01 | 3.16 | <0.01 | |||
| S926 | 19.9 | 21.4 | 1.5 | 3.27 | 0.01 | 2.86 | <0.01 | ||
| 12.1 | 13.6 | 1.5 | 1.4 | 0.01 | 1.47 | 0.01 | |||
| S933 | 13.6 | 14.9 | 1.3 | 2.78 | 0.01 | 2.45 | <0.01 | ||
| S936 | 8.5 | 9.8 | 1.3 | 3.73 | 0.01 | 4.2 | <0.01 | ||
| 11 | 12.2 | 1.2 | 1.02 | 0.01 | 0.98 | <0.01 | |||
| Northeast Zone | |||||||||
| 60.75 | 62 | 1.25 | 7.56 | 2.63 | 6.95 | 2.76 | |||
| S943 | 62 | 63 | 1 | 3.16 | 5.7 | 2.78 | 3.3 | ||
| S950 | 36 | 37.15 | 1.15 | 5.2 | 3.02 | 3.99 | 2.19 | ||
| 37.15 | 38.25 | 1.1 | 17.37 | 1.07 | 15.54 | 0.67 | |||
| S953 | 91.8 | 92.65 | 0.85 | 4.41 | 7.34 | 3.97 | 7.47 |
12.2 Historical Data Verifications
12.2.1 Getty Zone
Data verification measures for the Getty Zone were described in Cullen et al (2011):
"Review by Mercator of all government assessment reports and internal Acadian files available from the Scotia Mine site established that typed lithologic logs with complete assay records from the Getty drilling era were available. However, original sample record books, laboratory reports and other associated information were not found. The digital drill hole database used for the Westminer's 1992 resource estimate was also obtained from Acadian and validated against the original hard copy drill log and assay record entries. Checking of digital records included manual inspection of individual database lithocode entries against source hard copy drill logs as well as use of automated validation routines that detect specific data entry logical errors associated with sample records, drill hole lithocode intervals, collar tables and down‐hole survey tables. Drill hole intervals were also checked for sample interval and assay value validity against the original drill logs. Database entries were found to be of consistently acceptable quality but minor lithocode and assay entry corrections were made by Mercator. These were incorporated to create the validated and functional drilling database used in the resource estimate. As noted earlier, original assays certificates were not found for any of the historic drilling programs and no records of the laboratories to which samples were submitted for analysis, or methods of analysis, were documented in any of the historic drilling reports reviewed for the resource estimate".
"As part of the validation process, Mercator staff visited the NSDNR Core Library in Stellarton, Nova Scotia to review and sample core from the archived Getty drill holes. Nineteen holes where examined but only one hole GGR‐212 was re‐logged in detail and ten hole were re‐sampled and analysed for purposes of quality control and quality assurance. These provided additional verification of historical assays and logging results. Results of this and related programs are presented below under separate headings." (Cullen et al, 2011, section 13.1).
"Combined results of the Getty drill hole re‐sampling and twin hole programs by Acadian generally support the earlier conclusion of Cullen et al. (2008), based on a smaller data set, that validated historic drilling information represented in Acadian's Getty Zone database is of acceptable quality for resource estimation purposes." (Cullen et al, 2011, section 13.2.4)
13 Mineral Processing and Metallurgical Test Work
Note: Item 13 has no change from Previous NI43-101 Technical Report by Carew, et al, 2020
13.1 Introduction
Several sources of data have been collected in order to quantify the metallurgical response of ores from the ore deposits of the Scotia Mine project. The study focused on historical test work and operating data. This was to determine if enough information exists to support restarting the existing mill, along with the design of comminution, flotation, or dewatering equipment. After review of the available data, it has been determined that enough information exists to support a PFS level study. The following reports and documents have been used to develop this review:
- Acadian Gold Corp., Resource, Reserve and Feasibility Report July 13, 2006
- SGS Comminution Test Report No. 11730-001 November 26, 2007
- Acadian Historical Production Data from 2008, 2009
- Selwyn Resources Ltd.' ScoZinc Mine; Preliminary Economic Assessment Update, December 2012
- ALS KM3677 Metallurgical Report, April 29, 2013
- FFP Systems Inc., Concentrate Filtration Tests Report, January 30, 2018
- ALS KM5548 Comminution Report, February 1, 2018
13.2 Sample Description
Several test work campaigns have been included in the test work review. Each campaign was performed with a unique set of samples. SGS Comminution test work samples were collected from operations and received by SGS Lakefield in August 2007. Samples used for ALS KM3677 metallurgical test work were collected from coarse crushed rock samples received by ALS on January 11th, 2013. Samples used for the ALS KM5548 Comminution Report were collected from drill core samples. Samples were split and the half core was provided to ALS for testing. ALS received the samples for testing on January 2nd, 2018.
13.3 Mineralogy
As part of the ALS KM3677 test work, mineralogical testing was performed on a master composite. Particle Mineral Analysis ("PMA") was performed to determine the mineral content of the sample. The results are shown in the table overleaf.
| Mineral | Mineral Content | ||
|---|---|---|---|
| Galena | 2.0 | ||
| Sphalerite | 3.2 | ||
| Pyrite | 0.3 | ||
| Dolomite | 55.4 | ||
| Calcite | 21.3 | ||
| Copper Sulphides | 0.1 | ||
| Quartz | 7.7 | ||
| Felspars | 3.3 | ||
| Muscovite | 4.2 | ||
| Chlorite | 0.8 | ||
| Others | 1.8 |
Table 13-1: Master Composite Mineral Content
13.4 Review
The ScoZinc mine is a Mississippi Valley Type ("MVT") lead zinc deposit. The sulphides are hosted primarily in carbonate with some replacement of silica. There are several very well known MVT mines (Pine Point and Nanisivik in Canada, Tara Mines in Ireland, the Balmat Mine in New York State, USA). MVT deposits are unique in their homogenous nature. The lead zinc mineralization is continuous and largely predictable. Obtaining representative samples is very straightforward as a result. Pyrite is a minor mineral which does not require significant suppression to produce high quality lead and zinc concentrates. Despite this operation being constructed in the 1970's, there is limited metallurgical data available on past operations or current metallurgical testing. Operational data is available from 2008 and 2009 and this period is also briefly discussed in the 2012 Selwyn Report.
13.5 Operational Data
Operational data from the most recent operational run has been reviewed to set a baseline for the existing mill equipment. From 2007 to 2009 Acadian Mining operated the mill, using the existing equipment to produce lead and zinc concentrates. A summary of the tonnages, and grades can be seen in the table overleaf.
| Baseline Item | Unit | Variable |
|---|---|---|
| Start Date | - | June 2007 |
| End Date | - | March 2009 |
| Milled Tonnes | - | 1,128,564 |
| Average Feed Rate | TPD | 1,841 |
| Average Lead Head Grade | % Pb | 0.94 |
| Average Zinc Head Grade | % Zn | 2.50 |
| Average Lead Recovery | % | 83 |
| Average Zinc Recovery | % | 81 |
| Lead Concentrate Grade | % Pb | 68 |
| Zinc Concentrate Grade | % Zn | 56 |
| Lead Concentrate Production | TPD | 21 |
| Zinc Concentrate Production | TPD | 66 |
Table 13-2: Historical Operational Data
13.6 Comminution Testing
Comminution test work was completed on eight samples which were combined into three composite samples used for testing. JKTeck SMC test was completed and can be seen below in the table below (see Table 13-3). Bond Ball mill work index tests were also completed and can be seen in the table below (see Table 13-4).
Table 13-3: SMC Test Results
| Composite | DWi | Axb | S.G. | SAG Circuit Specific Energy (SCSE) |
|---|---|---|---|---|
| High Grade | 4.12 | 74.1 | 3.04 | 8.00 |
| Low Grade | 4.58 | 58.9 | 2.70 | 8.34 |
| HW-FW Composite | 4.67 | 54.9 | 2.56 | 8.47 |
| Table 13-4: Bond Ball Mill Work Index Test Results |
|---|
| ---------------------------------------------------- |
| Composite | F80 (µm) | P80 (µm) | BWi (kWh/tonne) |
|---|---|---|---|
| High Grade | 2,716 | 88 | 8.7 |
| Low Grade | 2,770 | 88 | 9.4 |
| HW-FW Composite | 3,111 | 86 | 13.8 |
13.7 Flotation Testing
The most recent flotation test work includes locked cycle tests. There tests were performed from a composite sample produced predominantly from drill hole intervals from Phase 1 of the current mine plan, with limited intervals from Phase 2. Head grades for the composite sample used for the tests were 1.83% lead and 2.45% zinc. The tests were able to produce high quality lead and zinc concentrates with a lead concentrate grade of 69% lead and a zinc concentrate grade of 59% zinc. Achieved recoveries were 94% lead and 87% zinc. The lead head grade from this test program is higher than is contained in the current forecast mine schedule. Additionally, the test work recoveries are higher than were achieved in the last production run in 2008 and 2009.
The original plant flowsheet included concentrate regrind for zinc rougher concentrate but does not appear to have been operated during the last production run. The 2013 ALS flotation testing program evaluated regrind for both lead and zinc rougher concentrates. The results showed no benefit for regrinding the lead rougher concentrate, but zinc final concentrate grades improved from regrinding the zinc rougher concentrate to k80 = 36 µm from 44% to 61% with a loss in recovery of 2%. The locked cycle test included a zinc regrind stage.
The test work reagent scheme was typical of lead zinc flotation circuits. Zinc sulfate and cyanide were used as sphalerite depressants before lead flotation. Ethyl xanthate was used as the lead collector. Copper sulphate was then used as the sphalerite activator before zinc flotation. SIPX was used as the zinc circuit collector. MIBC was used in both circuits, with W34 also used in the zinc cleaner. Lime was used as the pH modifier in both circuits.
The 2008 and 2009 operating data show lead and zinc recoveries are relatively insensitive to head grades either through inherent mineralogy or limitations of the existing flotation equipment. Figure 13-1 shows historical zinc recovery as a function of head grade and Figure 13-2 shows historical lead recovery as a function of head grade.
The combination of the most recent test work and the historical production data provides sufficient information to support PFS level flotation design.

Figure 13-1: Zinc Recovery as a Function of Head Grade (2008 Production Data)

Figure 13-2: Lead Recovery as a Function of Head Grade (2008 Production Data)
The proposed ScoZinc life of mine production plan for the first 5 years of the mine life is shown in Table 13-5. Although the 2013 ALS flotation testing program was based on a sample with high head grades, the continuity and consistency of the mineralization allows for use of the available operating data for recovery estimates.
| Year | Total Tonnes (t) | Avg Pb Grade (%) | Avg Zn Grade (%) |
|---|---|---|---|
| 1 | 970 500 | 0.61 | 2.31 |
| 2 | 985 500 | 0.86 | 2.27 |
| 3 | 985 500 | 0.66 | 2.10 |
| 4 | 988 200 | 0.80 | 2.09 |
| 5 | 985 500 | 1.16 | 2.35 |
Table 13-5: Proposed ScoZinc Mine Production Plan (first 5 years)
The 2012 PEA offers some relevant data for concentrate grades and recoveries as it includes some of the last plant production statistics from 2008. Recommended grade and recoveries for inclusion in the Process Design Criteria are:
- 86% Zinc recovery and 57% Zn concentrate grade
- 88% Lead recovery and 70% Pb concentrate grade
These concentrate grades and recoveries are at the upper end of the production data shown in Figure 13-1 and Figure 13-2 above.
These recoveries are considered achievable after a suitable ramp up period with consistent ore production at the grades in the mine plan. During the ramp up period, recoveries will be in the order of 80% for lead and zinc based on the historical data.
13.8 Concentrate Solids Liquids Separation Testing
No historical solids liquids separation test results are available from the previous operations. Filtration tests were performed in 2018 by Fox Fluid Power ("FFP"), located in Mississauga, Ontario Canada. The tests show lead and zinc concentrates can be dewatered with membrane type plate and frame filter presses to low moisture contents of approximately 8% and 10% moisture for lead and zinc concentrate, respectively. The report though does not include any engineering data to technically evaluate the results.
FFP provided an initial proposal based on low slurry density feed and an updated proposal based on thickened concentrate feed. The equipment selection is based on a 60-minute cycle time including 25 minutes of air drying. The calculated filtration duties for both concentrates is around 2 kg/h/m2, which is extremely low. Published data for lead and zinc pressure filtration shows cycle times of 7 to 10 minutes with filtration duties in the range of 300 to 600 kg/h/m2 for clean concentrates. Published data for the Red Dog Pb-Zn mine shows operating filter duties of around 250 kg/h/m2 for a complex zinc concentrate.
The plant currently has no concentrate filtration equipment. The original plant equipment included vacuum disk filters and kilns to dry the concentrates. This equipment configuration is now obsolete and is now typically replaced by pressure filters that produce concentrates at moisture levels suitable for transport.
FFP has provided an equipment proposal based on their test results. Membrane plate and frame filtration is likely not required and a simple plate and frame filter press is sufficient. With availability of concentrate sample, additional testing is recommended either with another vendor or with an independent laboratory such as SGS Lakefield Research or Pocock Industrial.
13.9 Predicted Metallurgical Results
The test work and operational results were analysed to develop recovery models for both lead and zinc based on head grades. The model results are based on a grind of 80% passing 110 µm. Historic data used for the recovery curves include the following filters in order to represent steady state operation:
- Daily tonnage below 1,750 tonnes per day were excluded from the data set
- Lead feed grade below 0.40% and above 1.93% were excluded from the dataset
- Zinc feed grade below 2.04% and above 2.88% were excluded from the dataset
- Days with zinc and lead recovery below 65% and 55% respectively, were excluded
The resulting dataset was then used to develop grade recovery curves which would be used for estimating monthly average recoveries of both lead and zinc. These curves and their representative datasets can be seen below in the two figures below. See Figure 13-3 and Figure 13-4 overleaf.
Zinc concentrate from the locked cycle tests was found to contain cadmium with concentrations as high as 2,866 g/tonne.

Figure 13-3: Lead Recovery Model for Cash Flow Analysis


13.10 Conclusions
The available metallurgical testing and historical production data is sufficient to support the PFS in terms of comminution design and flotation design.
Given the homogeneous nature of the MVT deposit, historical plant recovery data is suitable for recovery modelling for both concentrates.
Operation of the zinc rougher concentrate re-grind mill is recommended to provide higher grade zinc final concentrate, or alternatively a high and low grade separation of the concentrate slurry to two separate ball mills (currently in place).
No historical concentrate dewatering data from previous operations is available, as the operation utilized highly inefficient rotary dryers (heated by oil burning furnaces) to dewater the concentrate.
The concentrate filter proposal from FFP is based on extremely low filter duties, such that a small filter press could be used to better match concentrate production levels.
13.11 Recommendations
Ausenco recommends that FFP provide additional information on how their equipment proposal was derived to understand the very low filter duties.
Perform additional concentrate filtration tests on available concentrate samples with another vendor or with an independent laboratory.
Plan further metallurgical testing to support feasibility studies for the proposed plant expansion before purchasing equipment. Samples must be selected to represent future production by pit phase. This should include further investigating potential cadmium contamination.
14 Mineral Resource Estimates
14.1 Gypsum
Gypsum resources were estimated using the outlined gypsum /anhydrite geology constrained by the optimized pitshell outlined for the base metal mining. Drill holes were chosen to be representative of the gypsum over the geographic area planned for open pit mining.
14.1.1 Gypsum Resource Estimation
Fifty-nine samples from 13 previously drilled holes were sampled and assayed and added to the database. The estimate was prepared using GEOVIA GEMS 6.8.2., A total of 139 assays were included in the modeling the gypsum mineralization.
A 3D solid (wireframe) of the gypsum that is continuous across the Main and North East zones was created. No compositing was applied to the Gypsum assays as all the assays were 3m in length and deemed unnecessary. An insitu density of 2.2 tonnes per cubic metre was used for the gypsum.
Gypsum waste rock constrained inside this pit shell was considered for conversion to Gypsum mineral resources. No Gypsum outside this pit shell was included or considered in the calculation of the Gypsum resource, nor did it have any influence on the size and shape of the pit shell.
High-grade capping was not applied to the Gypsum assay data prior to compositing to 1.5m composites generated within the GRFM solid, as underground and open pit production history indicates that high grade outliers exist as real ore zones with reasonable continuity. A high-grade restriction was, however, applied during interpolation to constrain the influence of these samples, with thresholds for Zinc and Lead established on a per zone basis.
Overall Gypsum tonnage was reduced by 10% as a contingency to account for karst Gypsum topography near the top of the Gypsum lithology unit.
The grade model Gypsum resource estimation was calculated from drill hole data using Inverse Distance interpolation methods in a GEMS percent block model using blocks measuring 10 m x 10 m x 5 m in size.
The gypsum solid was created using the lithology and gypsum assay tables from 298 holes in the main drill hole data base. Where assay data was present, it took precedence in determining the gypsum interval. The solid extends from the Getty South area to the North East area. No gypsum solid was modelled for the Getty area in this MRE update. A 3D view of the gypsum domain with drill hole spacing can be seen in Figure 14-1. A sectional view of the gypsum domain with drill hole spacing can be seen in figure 14-2.
No significant outliers were identified within the data.
14.1.2 Gypsum Block Grades
Block grades were estimated for gypsum percent (Gyp%) using inverse distance weighting ("IDW"). The interpolation process utilized 3.0m composites tagged with the Gypsum rock type code to enable the use of boundaries. The interpolations were done in three passes, with progressively larger search distances and progressively relaxed requirements in terms of minimum number of samples and maximum number of
samples per drill hole, and with protection of blocks estimated in earlier passes. The estimation parameters by zone and pass for gypsum are tabulated in the table below.
14.1.3 Compositing of Gypsum Sample
The raw gypsum assays are 3m in length with the exception of a few samples. Therefore a composite length of 3m was chosen as it provided a good representation of data within a single gypsum interval.
| Pass Mineral |
Zone | Search Type | Estimation | Sample Support | Search Neighborhood (Az/Dip in Deg, Distance in m) |
||||||||
|---|---|---|---|---|---|---|---|---|---|---|---|---|---|
| Type | Min | Max | Max Hole |
Az (P) |
Dip (P) |
Az (I) |
Dist (X) |
Dist (Y) |
Dist (Z) |
||||
| 1 | Gyp | Main/NE | Octant | ID | 2 | 20 | 2 | 0 | 0 | 0 | 50 | 50 | 50 |
| 2 | Gyp | Main/NE | Rectangular | ID | 2 | 20 | - | 0 | 0 | 0 | 150 | 150 | 150 |
| 3 | Gyp | Main/NE | Ellipsoidal | ID | 2 | 20 | - | 0 | 0 | 0 | 1000 | 1000 | 1000 |
Table 14-1: Gypsum Resource Estimation Parameters


Figure 14-2: Section view of gypsum domain
14.2 Base Metals
Note: Item 14 from here on has no change from Previous NI 43-101 Technical Report by Carew, et al, 2020
14.2.1 Introduction
Based on data provided by the Company, SRK completed a geologic and grade estimation block model for the project for evaluation purposes, using GEMS modeling software (Version 6.8.2). The data used in the resource model estimation include RC and core drill hole data, topographic surface data, and material density.
14.2.2 Resource Estimation Procedures
The resource estimation procedure followed the general flow listed below for Lead & Zinc:
- Exploratory Data Analysis (EDA)
- Capping Analysis
- Compositing
- Variography
- Block Model Coding (Grade shells and geological domains)
- Grade Estimation
- Classification, based on drill hole spacing
- Resource Pit Optimization
- Resource Statement
The resource estimation procedure followed the general flow listed below for Gypsum:
- Exploratory Data Analysis (EDA)
- Block Model Coding (Grade shells and geological domains)
- Grade Estimation
- Classification, based on drill hole spacing
- Resource Statement
14.3 Resource Database
14.3.1 Density
Prior to 2007-2008, there was no record of any systematic whole-rock SG measurements being taken. A formula for specific gravity based on zinc and lead grades was, therefore, used for the mineralized zones. This formula, which was also used by Savage Resources for their 1998 resource estimate, was:
SG = 1/(Pb%/(86.6x7.6) + Zn% /(67.0x4.0) + (1 – Pb% /86.6 – Zn% /67.0)/2.7)
Selwyn undertook SG measurements on core from the 2011 drilling program, with 559 determinations in all and 250 determinations on intervals above the mineralized threshold of 0.5% zinc equivalent. On average the formula overestimated the SG by 0.4%, with a standard deviation of 3%. This difference is not considered to be material, and the formula-estimated values have been retained for the current estimate. Densities applied to the non-mineralized formations are tabulated in Table 14-7.
| Rock Type | 3 Density (t/m ) |
|---|---|
| Overburden | 2.00 |
| Trench | 2.00 |
| Carroll's Corner Evaporites (waste < 80% Gypsum) |
2.65 |
| *Gypsum ( >80% Gypsum) | 2.20 |
| Goldenville Quartzite | 2.65 |
Table 14-2: Density – Non-Mineralized Materials
*Gypsum >80% has been assigned a default density value of 2.2 and is not calculated using the above described method. Source: ScoZinc, 2019
14.3.2 Topography
Topographic data was sourced from the Province of Nova Scotia GIS gateway (GeoNOVA) in the form of Digital Terrain Model (DEM) data based on 2014 LIDAR surveys. SRK extracted contour data at 2 m intervals for the creation of a triangulated topographic bounding surface. Contours in the vicinity of the existing pit lake were modified to reflect:
- The excavation at the end of open-pit mining, using blasthole data and survey pick-ups where available
- Subsequent backfill with overburden/trench material
14.4 Geological and Grade Shell (Mineralization) Modelling
Although the adjacent Getty, Main and North-East zones have been modelled as separate deposits/block models in previous studies, the mineralization is considered to be continuous through the Gays River Formation (GRFM) that hosts all three zones. Various methods and cut-offs were utilized in historical studies, and the current modeling is designed to provide a unified, more cohesive approach based on the GRFM as a whole.
The GRFM has been modelled as a continuous 3D solid across the property, following a general geological trend at Azimuth 060º. Drillhole intersections with the footwall (lower) and hanging wall (upper) contacts were identified from geological logging, with both GRFM and footwall breccia intersections being considered. Numerous intersections of the breccia have been found to be mineralized. Drill holes that intersected the underlying Goldenville quartzites without intersecting the GRFM were assigned a minimum intersection length of 0.5m for control purposes. Triangulated (wireframe) upper and lower surfaces were created using a twostep process:
Creation of a mesh of 3D gridded points using a Laplace gridding interpolation method, from which only interpolated grid points (from cells that did not contain any source data) were retained.
Triangulation using a combination of the source data (drill hole intersects) and interpolated grid data to create final surfaces.
Following corrections for minor overlaps, the surfaces were stitched together to create a single, validated 3D solid (wireframe) of the GRF/ Breccia host volume. A perspective view is illustrated in Figure 14-3, and a sectional view in the Getty Zone is illustrated in Figure 14-4.

Figure 14-3: GRFM Solid – Perspective View, Looking ESE
Source: SRK, 2019


14.5 Exploratory Data Analysis
Exploratory data analysis was carried out to characterize the grade distribution within the modeled GRFM mineralized solid, by zone. Boxplots for zinc and lead assay data coded within the GRFM solid are illustrated in Figure 14-5 and Figure 14-6, and summary statistics are presented in Table 14-3.

Figure 14-5: Boxplot – GRFM Zinc Assays

Figure 14-6: Boxplot – GRFM Lead Assays
| Domain | Count | Min | Max | Mean | Variance | St. Dev | CV | ||
|---|---|---|---|---|---|---|---|---|---|
| Zn (%) | |||||||||
| Getty | 3992.00 | 0.00 | 30.10 | 0.81 | 2.04 | 1.43 | 1.76 | ||
| North East | 991.00 | 0.00 | 67.06 | 4.00 | 55.10 | 7.42 | 1.86 | ||
| Main | 8617.00 | 0.00 | 62.10 | 3.08 | 39.13 | 6.26 | 2.03 | ||
| Pb% | |||||||||
| Getty | 3992.00 | 0.00 | 55.90 | 0.58 | 3.89 | 1.97 | 3.38 | ||
| North East | 991.00 | 0.00 | 47.20 | 2.08 | 28.07 | 5.30 | 2.54 | ||
| Main | 8617.00 | 0.00 | 79.50 | 1.72 | 34.75 | 5.90 | 3.43 | ||
| Gyp% | |||||||||
| Main+NE | 139 | 81.93 | 97.19 | 92.5 | 13.8 | 3.72 | 0.04 |
Source: SRK, 2019
As evidenced by the relatively high coefficient of variation ("CV") values, the zinc and lead assay data within the mineralized zone exhibit a high degree of variability, and the Getty zone has a markedly lower grade relative to the Main and NE zones. The low ("CV") value for Gyp% shows a very low degree of variability within the gypsum domain.
14.6 Evaluation of Outliers
High-grade capping was not applied to the assay data prior to compositing to 1.5m composites generated within the GRFM solid. Historical underground and open-pit mining have established/confirmed the continuity of higher-grade zones within the deposit, mainly along the hanging wall contact. Capping was therefore not considered to be appropriate in this case. A high-grade restriction was, however, applied during interpolation to limit the influence of these samples, with thresholds established on a per zone basis for zinc and lead.
14.7 Compositing
Zinc and lead assay values were composited into 1.5m composites within the GRFM solid/domain, broken at the domain contacts as required. The 1.5m composite length was selected to retain a degree of the assay sample variability for estimation purposes. Residual intervals that occur at domain contacts were retained if ≥0.6m in length (40% of nominal composite length). Missing zinc and lead assays values within composite intervals were assigned a default value calculated as the mean of the low-grade population, by zone. In the author's opinion the use of a default value is supported primarily by production reconciliation data from historical open-pit mining, in addition to examination of drill core/chips and logging data. Historical sampling tended to be restricted to higher-grade (7% plus Zn) zones of interest for underground mining, but examination of core/chips and logs have established the pervasive presence of lower grade sulphide mineralization in unsampled intervals, Reconciliation data from historical open-pit mining exhibits a consistent positive reconciliation against blasthole data in volumes where holes with unsampled intersects occur. Lognormal probability plots for zinc and lead composites were examined to determine thresholds to define low-grade components, and calculation of the corresponding means. The minimums, threshold values and corresponding means are tabulated in Table 14-4.
| Metal | Zone | Min (%) |
Threshold (%) | Mean (%) |
|---|---|---|---|---|
| Getty | 0.1 | 0.5 | 0.2 | |
| Zn | North-East | 0.1 | 0.4 | 0.23 |
| Main | 0.1 | 0.4 | 0.23 | |
| Pb | Getty | 0.1 | 0.3 | 0.18 |
| North-East | 0.1 | 0.3 | 0.17 | |
| Main | 0.1 | 0.6 | 0.25 |
Table 14-4: Default Values by Zone
Source: SRK, 2019
Composite intervals were tagged with the GRFM domain code for interpolation purposes. Summary statistics for the composites are tabulated in Table 14-5 overleaf.
| Domain | Count | Min | Max | Mean | Variance | St. Dev | CV | |||
|---|---|---|---|---|---|---|---|---|---|---|
| Zn (%) | ||||||||||
| Getty | 4031 | 0.00 | 12.05 | 0.75 | 1.27 | 1.13 | 1.50 | |||
| North East |
727 | 0.00 | 53.66 | 3.17 | 28.22 | 5.31 | 1.68 | |||
| Main | 7781 | 0.00 | 57.80 | 2.62 | 23.42 | 4.84 | 1.84 | |||
| Pb% | ||||||||||
| Getty | 4031 | 0.00 | 21.16 | 0.43 | 1.33 | 1.15 | 2.71 | |||
| North East |
727 | 0.00 | 45.80 | 1.66 | 16.17 | 4.02 | 2.43 | |||
| Main | 7781 | 0.00 | 77.22 | 1.35 | 17.69 | 4.21 | 3.13 |
Table 14-5: Composites Summary Statistics
Source: SRK, 2019
14.8 Variography
The spatial continuity of composites within the GRFM zones was investigated through variographic analysis for zinc (primary metal) using the SAGE 2001™ variography package. The GRFM composite coordinates were first transformed into a modified model space to account for the variability in orientation of the host formation. This transformation is referred to as 'unwrinkling' and is described in Section 14.9. Down-the-hole correlograms were calculated to determine appropriate nugget values, in addition to 3D directional correlograms for use in variogram modeling. The correlogram measures the correlation coefficient between two sets of data, comprising values at the heads and values at the tails of vectors with similar direction and magnitude, and has been found to provide a stable estimate of spatial continuity. For ease of modelling, the correlogram value is subtracted from one and is presented in a similar graphical form to the variogram. In this
report the correlograms presented this way are referred to as variograms. A typical directional variogram is illustrated in Figure 14.7 and fitted variogram parameters for zinc by zone are tabulated in Table 14-6.


Source: SRK, 2019
| Az/Dip (Deg.) | Range (m) | |||||||||
|---|---|---|---|---|---|---|---|---|---|---|
| Zone | Nugget | Type | Sill | X | Y | Z | X | Y | Z | |
| Getty 0.2 |
EXP | 0.647 | 130/23 | 33/17 | 269/61 | 135 | 40 | 72 | ||
| EXP | 0.153 | 120/75 | 297/15 | 207/-1 | 520 | 388 | 897 | |||
| NE 0.754 |
EXP | 0.207 | 19/20 | 296/18 | 245/63 | 74 | 72 | 71 | ||
| EXP | 0.048 | 122/-12 | 36/16 | 176/69 | 69 | 63 | 78 | |||
| Main 0.3 |
EXP | 0.584 | 77/7 | 348/-5 | 294/81 | 20 | 92 | 39 | ||
| SPH | 0.116 | 66/-2 | 336/2 | 103/87 | 1035 | 68 | 172 |
Table 14-6: Variogram Parameters by Zone – Zinc
14.8.1 Gypsum
No variography was completed for the gypsum as there were not enough gypsum assays present in the data base to determine spatial continuity accurately.
14.9 Block Model and Grade Estimation
Given the variable geometry of the GRFM formation in both lateral and vertical axes, the GEMS Unwrinkle tool was utilized to assist grade modeling. Variographic analyses of spatial continuity and the various block estimation methods based on weighted distance interpolation, such as kriging or inverse distance, assume that the location of the relevant sample data reflects the mineralizing or depositional process, e.g. along a paleoshoreline in this case. The distortion of this relationship introduced by geometric variation can be addressed in several ways, e.g. by the definition of several block model domains, each reflecting the local geometry of sections of the deposit. This approach can, however, result in a less cohesive grade model, often with obvious discontinuities at the domain boundaries. The Unwrinkle tool addresses variable geometry by 'flattening' the deposit and data into a second, regular space in which a more appropriate spatial relationship is preserved. Variography and grade modeling (block model) is done in this second space using transformed data. The estimated grade model information is then back transformed into the original space, typically by assigning back transformed block grades (centroids) to a second (primary) block model defined in this space
The space to be unwrinkled is represented by triangulated surfaces and/or solids, and midpoints are developed from intersections with the modeled solids/surfaces. By moving the midpoints to a constant level, the space associated with the solids/surfaces is flattened/straightened out. The thickness, or distance between the two intersections, is also calculated and a Variable Thickness approach preserves this thickness, with its value typically changing with location. The handling of the midpoint and the thickness determines the transformation for the data point, with the new point offset from the specified level by an amount determined by its offset from its midpoint and the treatment of the thickness. In the Variable thickness case, the position of the data points relative to its associated midpoint, and the position of the data point relative to both surfaces is preserved.
A primary (normal space) percentage, or partial, block model was defined in GEOVIA GEMSTM to cover the volume of interest, with a rotation of 30º applied, to align the model east axis with the overall trend of the deposit (Azimuth 060º). A percentage block model in GEMS can accommodate multiple material types per block and stores corresponding percentages. A block size of 10x10x5 m was selected based on drill hole spacing, likely bench height for large scale open-pit mining, and for comparison purposes with previous models. The primary control for estimation is rock type, based on coding of a block model rock type attribute using the GRFM (3D geological solid) in conjunction with the topography surface and the underground excavation solid where applicable to account for excavations. Overlapping solids are assigned a precedence order in assigning the appropriate block percentages.
14.9.1 Block Model Geometry
The block model geometry for the primary (normal space) and secondary (transformed) is tabulated in Table 14-7 and Table 14-8.
| Coordinate | Origin | Block Size (m) | # Blocks | Extents (m) |
|---|---|---|---|---|
| Easting (m) | 6747.37 | 10 | 420 | 4,200 |
| Northing (m) | 5176.79 | 10 | 200 | 2,000 |
| Elevation (m) | 600.00* | 5 | 45 | 225 |
Table 14-7: Primary Block Model Geometry
Source: SRK, 2019
Table 14-8: Secondary Block Model Geometry
| Coordinate | Origin | Block Size (m) | # Blocks | Extents (m) |
|---|---|---|---|---|
| Easting (m) | 6747.37 | 10 | 420 | 4,200 |
| Northing (m) | 5176.79 | 10 | 200 | 2,000 |
| Elevation (m) | -70.00* | 1.5 | 40 | 60 |
Source: SRK, 2019
Notes: * Maximum elevation, i.e. top of top block. Model east axis is rotated 30º to align with Azimuth 060º
14.9.2 Block Model Estimation
Block grades were estimated in the unwrinkled space by zone for zinc (%) and lead (%) using ordinary kriging ("OK") and inverse distance weighting ("IDW") respectively. The interpolation process utilized 1.5m composites tagged with the GRFM rock type code to enable the use of boundaries. The interpolations were done in three passes, with progressively larger search distances and progressively relaxed requirements in terms of minimum number of samples and maximum number of samples per drill hole, and with protection of blocks estimated in earlier passes. The estimation parameters by zone and pass are tabulated in Table 14-9 overleaf.
| Sample Support | Search Neighborhood (Az/Dip in Deg, Distance in m) |
HG Restriction | ||||||||||||||
|---|---|---|---|---|---|---|---|---|---|---|---|---|---|---|---|---|
| Pass | Metal | Zone | Type | Min | Max | Max Hole |
Az (P) |
Dip (P) |
Az (I) |
Dist (X) |
Dist (Y) |
Dist (Z) |
HG% | Dist (X) |
Dist (Y) |
Dist (Z) |
| Getty | OK | 3 | 12 | 2 | 130 | 0 | 0 | 30 | 30 | 1 | - | - | - | - | ||
| Zn | Main | OK | 3 | 12 | 2 | 348 | 0 | 0 | 15 | 15 | 1 | 14 | 5 | 5 | 1 | |
| NE | OK | 3 | 12 | 2 | 0 | 0 | 0 | 20 | 20 | 1 | 18 | 5 | 5 | 1 | ||
| 1 | Getty | IDW | 3 | 12 | 2 | 130 | 0 | 0 | 30 | 30 | 1 | - | - | - | - | |
| Pb | Main | IDW | 3 | 12 | 2 | 348 | 0 | 0 | 15 | 15 | 1 | 19 | 5 | 5 | 1 | |
| NE | IDW | 3 | 12 | 2 | 0 | 0 | 0 | 20 | 20 | 1 | 12 | 5 | 5 | 1 | ||
| Getty | OK | 2 | 12 | 1 | 130 | 0 | 0 | 60 | 60 | 1 | - | - | - | - | ||
| Zn | Main | OK | 2 | 12 | 1 | 348 | 0 | 0 | 30 | 30 | 1 | 14 5 5 18 5 5 - - - 19 5 5 12 5 5 |
1 | |||
| NE | OK | 2 | 12 | 1 | 0 | 0 | 0 | 40 | 40 | 1 | 1 | |||||
| 2 | Getty | IDW | 2 | 12 | 1 | 130 | 0 | 0 | 60 | 60 | 1 | - | ||||
| Pb | Main | IDW | 2 | 12 | 1 | 348 | 0 | 0 | 30 | 30 | 1 | 1 | ||||
| NE | OK | 2 | 15 | 1 | 0 | 0 | 0 | 40 | 40 | 1 | 1 | |||||
| Getty | OK | 1 | 12 | - | 130 | 0 | 0 | 90 | 90 | 1 | - | - | - | - | ||
| Zn | Main | OK | 1 | 12 | - | 348 | 0 | 0 | 60 | 60 | 1 | 14 | 5 | 5 | 1 | |
| 3 | NE | OK | 1 | 12 | - | 0 | 0 | 0 | 60 | 60 | 1 | 18 | 5 | 5 | 1 | |
| Getty | IDW | 1 | 12 | - | 130 | 0 | 0 | 90 | 90 | 1 | - | - | - | - | ||
| Pb | Main | IDW | 1 | 12 | - | 348 | 0 | 0 | 60 | 60 | 1 19 5 1 12 5 |
5 | 1 | |||
| NE | OK | 1 | 15 | - | 0 | 0 | 0 | 60 | 60 | 5 | 1 |
Table 14-9: Estimation Parameters
A block discretization of 5 x 5 x 3 was used with Ordinary Kriging estimation. The High Grade (HG) restriction value is a threshold value (%). The restricted search ranges are applied to samples with values exceeding this value, effectively limiting their influence to the block that they fall into. The threshold values were determined by examination of omni-directional indicator variograms, by zone, generated at the 75, 80, 90, 95, 97,5 and 99% percentile values, to determine a grade threshold above which the indicator variogram visibly degrades, which is an indication of a suitable threshold value.
Following block grade estimation in the secondary model space the block grades were then back transformed into normal space and assigned to the normal space model by block averaging.
14.10 Model Validation
Model validation was approached through visual and statistical methods. Visual comparison was done on sections and in plan for each area of the deposit. Statistical comparison was addressed using swath plots.
14.10.1 Visual Comparison
A visual inspection of the model in plan and section confirmed that grades were well correlated between the blocks and the composite data in each area. Example images showing block grades vs composite grades are provided below in Figure 14-8 to Figure 14-11. Estimated block grades relative to topography and the underground workings are provided in Figure 14-13 and Figure 14-14 respectively.

Figure 14-8: Plan View of Zn and Pb Block Grades and Cross-Section Locations for Main, Getty and Northeast Zones


Source: SRK, 2019
Figure 14-11: Northeast Zone Cross-Section Comparing Assay Composite Grades to Estimated Block Grades for both Zn and Pb (Section Looking South-West)

14.10.2 Gypsum
Gypsum sample grades displayed a very low variability. A visual inspection of the gypsum model in plan and section confirmed that grades were well correlated between the blocks and the composite data in each area.


Figure 14-13: North East Cross Section Comparing Assay Grade with Block Model Grades for Gypsum (Gyp%)
A numerical validation was also completed for the gypsum. A weighted average grade estimation was calculated using the drill hole assays within the gypsum domain. The gypsum grade calculated using the weighted average method was 90.7% compared to 91.8% calculated by inverse distance interpolation. The difference in grade between the two methods is 1.2% which is extremely close.
14.10.3 Swath Plots
A swath plot is a graphical display of the grade distribution derived from a series of bands, or swaths, generated in several directions through the deposit. Using the swath plot, grade variations from the block model estimate are compared to the distribution derived from the assay sample composite data used in the estimation process.
On a local scale, the profile obtained from the assay composite data typically displays a more variable profile than that obtained from the block model estimate. This reflects the smoothed nature of the block model estimate which is an outcome of the estimation process. However, the overall grade trend displayed in the swath plot should be similar between the block model estimate and underlying data.
Swath plots generated along east-west and north-south directions are provided in Figure 14-14 and Figure 14-15 for Zn and Pb. The swath plots were rotated to align with the rotation angle of the block model, using swath widths of 20m for both east-west and north-south orientations.

Figure 14-14: Easting Swath Plot for Zn and Pb
Source: SRK, 2019

Figure 14-15: Northing Swath Plot for Zn and Pb
Based on the swath plots, there is a reasonable correlation between the block model and underlying data. The degree of smoothing in the block model estimate is evident in the peaks and valleys shown in some swath plots; however, this comparison shows reasonable agreement between the data sets in terms of overall grade distribution as a function of easting, and northing, especially where there are high tonnages (as shown by the block counts on the plots shown in grey).
Source: SRK, 2019
14.11 Mineral Resource Classification
Mineral resources were classified into Measured, Indicated and Inferred categories based on CIM Definition Standards in accordance with NI 43-101 reporting guidelines. The initial classification criteria consider a combination of geometric criteria (based on overall drillhole spacing), and estimation quality criteria.
- Measured blocks require a minimum of three holes within 20m radii, nominally corresponding to a maximum drillhole spacing of 28m. The mean distance to the nearest three holes is 12.5 metres
- Indicated blocks require a minimum of three holes within 50m radii, with a nominal maximum spacing of 70metres. The mean distance to the nearest three holes is 30metres
- Inferred all other blocks estimated in the mineralized zone
The initial classification was adjusted to account for the estimation of blocks in GRFM volumes with drill holes with unsampled intervals. Affected blocks were identified by means of a specific interpolation using composite data coded for missing data, and the blocks were re-classified as Inferred blocks on this basis.
14.11.1 Gypsum
Gypsum mineral resources were classified into Measured, Indicated and Inferred categories based on CIM Definition Standards in accordance with NI 43-101 reporting guidelines. The initial classification criteria consider a combination of geometric criteria (based on overall drillhole spacing), and estimation quality criteria.
- Measured blocks require a minimum of two holes within 50m radii.
- Indicated blocks require a minimum of two holes within 150m radii.
- Inferred all other blocks estimated in the mineralized zone
14.12 Mineral Resource Statement
The resources are reported with respect to cut-off values calculated using the assumed processing costs and recoveries, and metal prices. The resource is also constrained by an optimized (WhittleTM) resource pit, in order to demonstrate that the defined resources have reasonable prospects of eventual economic extraction, which is a CIM Definition Standards criterion. All classification categories (Measured, Indicated and Inferred) were considered in the resource pit optimization.
14.12.1 Resource Pit Optimization parameters
The resource pit optimization parameters are tabulated in Table 14-10, and a 3D isometric view of the resource pit is illustrated in Figure 14-16.
| Parameter | Value | Unit |
|---|---|---|
| Mining Cost | Varies | C\$/t Mined |
| NE Zone Ore | 3.27 | C\$/t Mined |
| Main Zone Ore | 3.09 | C\$/t Mined |
| Getty Zone Ore | 3.27 | C\$/t Mined |
| Getty S Zone Ore | 3.27 | C\$/t Mined |
| Gypsum | 2.52 | C\$/t Mined |
| Quartzite | 2.30 | C\$/t Mined |
| Carbonate | 3.09 | C\$/t Mined |
| Overburden/Trench | 1.74 | C\$/t Mined |
| Processing Cost (including G&A) | 19.11 | C\$/t Processed |
| Zinc Recovery | 86 | % |
| Lead Recovery | 93 | % |
| Zinc Price | 1.35 | US\$/lb |
| Lead Price | 1.14 | US\$/lb |
| Zn Offsite Costs | 0.19 | US\$/lb |
| Pb Offsite Costs | 0.11 | US\$/lb |
| Royalty | 2 | % |
| Exchange Rate | 1.30 | C\$/US\$ |
| Slope Angle Rock | 45 | Degrees |
| Slope Angle Overburden | 22 | Degrees |
Table 14-10: Resource Pit Optimization Parameters
Source: ScoZinc/ SRK, 2019

Figure 14-16: 3D Isometric View of the Resource Pit and Block Model (Zn% Grade Shown)
14.12.2 Mineral Resource Statement
The Mineral Resource Statement and explanatory notes are presented in Table 14-11 below.
| Classification | Zone | Tonnage | Zn | Pb | ZnEq | Gypsum Tonnage |
Gypsum |
|---|---|---|---|---|---|---|---|
| (kt) | (%) | (%) | (%) | kt) | (%) | ||
| Getty | 60 | 1.38 | 1.25 | 2.58 | 0 | 0 | |
| Measured | Main | 4,130 | 2.57 | 1.30 | 3.81 | 1,310 | 93.0 |
| (M) | North East | 130 | 3.18 | 1.88 | 4.98 | 220 | 91.9 |
| Total | 4,320 | 2.57 | 1.32 | 3.83 | 1530 | 92.8 | |
| Getty | 8,090 | 1.24 | 0.81 | 2.02 | 0 | 0 | |
| Getty South | 840 | 1.58 | 0.25 | 1.82 | 0 | 0 | |
| Indicated | Main | 9,870 | 1.92 | 1.01 | 2.89 | 2,500 | 92.7 |
| (I) | North East | 2,330 | 2.88 | 1.15 | 3.98 | 1150 | 88.7 |
| Total | 21,130 | 1.75 | 0.92 | 2.64 | 3650 | 91.4 | |
| Getty | 8,150 | 1.24 | 0.82 | 2.03 | 0 | 0 | |
| Getty South | 840 | 1.58 | 0.25 | 1.82 | 0 | 0 | |
| M & I | Main | 14,000 | 2.11 | 1.09 | 3.16 | 3,810 | 92.8 |
| North East | 2,460 | 2.89 | 1.19 | 4.04 | 1370 | 89.2 | |
| Total | 25,450 | 1.89 | 0.99 | 2.84 | 5180 | 91.8 | |
| Getty | 950 | 1.35 | 0.54 | 1.87 | 0 | 0 | |
| Getty South | 770 | 1.53 | 0.25 | 1.77 | 0 | 0 | |
| Inferred | Main | 2,980 | 1.49 | 0.79 | 2.25 | 250 | 92.2 |
| North East | 310 | 2.01 | 0.74 | 2.72 | 540 | 90.7 | |
| Total | 5,010 | 1.50 | 0.66 | 2.13 | 790 | 91.2 |
| Table 14-11: Scotia Mine Resource Statement, Feb 31st, 2021 – SRK Consulting (U.S.), Inc. MineTech | |
|---|---|
| International Ltd. |
Mineral Resources are not Mineral Reserves and do not have demonstrated economic viability. There is no certainty that any part of the Mineral Resources estimated will be converted into Mineral Reserves;
Determination of reasonable prospects of eventual economic extraction was based on assumed prices for zinc of US\$1.35/lb, and for lead of US\$1.14/lb, a Zn recovery of 86% and a Pb recovery of 93%, mining and processing costs varying by zone, and pit slopes of 45 degrees in rock and 22 degrees in overburden (see table 3);
Near surface resources are reported based on a Zinc equivalent (ZnEq) grade of 0.90% and a gypsum grade of 80%. The ZnEq grade incorporates Zn and Pb sales costs of US\$0.19/lb and US\$0.11/lb respectively, and a 2% royalty fee; and
• Numbers in the table have been rounded to reflect the accuracy of the estimate and may not sum due to rounding
14.12.3 Resource Sensitivity Analysis
A resource sensitivity table within the resource pit shell (US\$1.35/lb Zn, US\$1.14/lb Pb) is provided in Table 14-12 overleaf.
| Cut-off ZnEq (%) |
Tonnage (kt) | ZnEq (%) | Zn (%) | Pb (%) |
|---|---|---|---|---|
| 2 | 15,400 | 4.01 | 2.56 | 1.51 |
| 1.9 | 16,400 | 3.89 | 2.49 | 1.45 |
| 1.8 | 17,500 | 3.76 | 2.42 | 1.39 |
| 1.7 | 18,700 | 3.63 | 2.36 | 1.33 |
| 1.6 | 20,000 | 3.5 | 2.28 | 1.27 |
| 1.5 | 21,400 | 3.38 | 2.21 | 1.21 |
| 1.4 | 22,700 | 3.26 | 2.14 | 1.16 |
| 1.3 | 24,100 | 3.15 | 2.08 | 1.11 |
| 1.2 | 25,700 | 3.03 | 2.01 | 1.06 |
| 1.1 | 27,300 | 2.92 | 1.95 | 1.02 |
| 1 | 28,900 | 2.82 | 1.89 | 0.97 |
| 0.9 | 30,600 | 2.72 | 1.82 | 0.93 |
| 0.8 | 31,900 | 2.64 | 1.78 | 0.9 |
| 0.7 | 32,700 | 2.59 | 1.75 | 0.88 |
Table 14-12: Resource Sensitivity within the Resource Pit Shell
15 Mineral Reserve Estimate
Note: Item 15 has no change from Previous NI43-101 Technical Report by Carew, et al, 2020
15.1 Mineral Reserve Estimate
15.1.1 Introduction
As defined by the Canadian Institute of Mining, Metallurgy and Petroleum within the CIM Definition Standards on Mineral Resources and Mineral Reserves as adopted by CIM Council on 10th May 2014, the definition of a Mineral Reserve is as follows:
"A Mineral Reserve is the economically mineable part of a Measured and/or Indicated Mineral Resource. It includes diluting materials and allowances for losses, which may occur when the material is mined or extracted and is defined by studies at Preliminary Feasibility or Feasibility level as appropriate that includes application of Modifying Factors. Such studies demonstrate that, at the time of reporting, extraction could be reasonably justified."
CIM guidelines require that only material categorized as Measured or Indicated Resources be considered for potential Mineral Reserves.
15.2 Mineral Reserve Estimation
All Mine design and scheduling work has been completed to a level of detail and confidence appropriate for a pre-feasibility study ("PFS") using a Mineral Resource model generated by SRK on 14th December 2019. All mining at Scotia Mine will be achieved by conventional open pit mining methods.
15.2.1 Orebody Description
The Scotia Mine deposit is hosted within the Gay's River formation ("GRFM") of the larger Windsor Group. The depositional environment of the Scotia Mine is consistent along the strike of the deposit. There are no other geological constraints that contribute to defining the orebody.
The orebody is divided into three distinct zones by surface constraints as shown in Figure 15-2. The surface constraints are the Gays River and Highway 224.

Figure 15-2: Orebody with Surface Constraints

15.3 Cut-Off Grade
Cut-off grade ("COG") was determined during the selection of the optimized pit shell. Zinc Equivalent ("ZnEq") was the variable used for determining the COG.
Table 15-1 provides the parameters used for calculating ZnEq during the optimization process.
| Variable | Unit | Value applied |
|---|---|---|
| Price of Zinc | USD/Pound | 1.35 |
| Price of Lead | USD/Pound | 1.14 |
| Recovery of Zinc | Percentage (%) | 86 |
| Recovery of Lead | Percentage (%) | 93 |
| Selling cost of Zinc | USD/Pound | 0.19 |
| Selling cost of Lead | USD/Pound | 0.11 |
| Conversion of Pounds to Tonnes (metric) | Pounds/Tonne | 2,204.6 |
| Table 15-1: Optimization Inputs for Zinc-Equivalent Calculation | ||
|---|---|---|
| -- | -- | ----------------------------------------------------------------- |
ZnEq% grade was calculated using the following equation:
ZnEq grade = Zn grade + Pb grade x (Realized Lead Price x Lead Recovery) (Realized Zinc Price x Zinc Recovery)
Realized Pb price is 1.14 x 0.98 – 0.11 = 1.01
Realized Zn price is 1.35 x 0.98 – 0.19 = 1.13
ZnEq grade = Zn grade + Pb grade x 1.01 x 0.93 1.13 x 0.86
ZnEq grade = Zn grade + Pb grade x 0.97
The COG determined by the pit optimization was 0.9% ZnEq grade. However, a COG of 1.5% ZnEq grade was chosen considering the following:
-
- Quantity of waste generated over the life of mine
-
- Strip ratio impact during the initial stages of mining
-
- Quantity of tailings generated
-
- Minimum and maximum production rates
-
- Minimum and maximum processing rates and recoveries
-
- Surface constraints (Gays River, Highway 224, waste dump optimal footprint)
-
- Cash flow constraints
-
- Investment payback period
15.4 Mining Dilution and Recovery
Geovia GEMS was used to create the pit designs and construct the resource block model. Volumes calculated in GEMS are done using weighted volume percent of each block, where a block can have multiple rock types represented as volume percent adding to 100%. The block model was transferred to Geovia Minesched to perform the life of mine ("LOM") scheduling.
In order to transfer the block model to Minesched it had to be converted to a whole block model where each block can only contain one material type. Minesched is only capable of working with whole block models. During the conversion process the original GEMS resource model was diluted by 12 percent at a grade of 0.4% ZnEq. A mining recovery of 92% was also applied which, when compared to previous open pit operations at Scotia Mine, is conservative.
15.5 Mineral Reserves
The Scotia Mine Mineral Reserve Estimates are classified as either Proven Reserves or Probable Reserves and are provided Table 15-2. Total Mineral Reserves are 13,653,761 tonnes with a Zinc Equivalent grade of 3.09 percent.
| Mineral Zone | Classification | Tonnage (t) |
Zinc Grade (%) |
Lead Grade (%) |
Zinc Equivalent Grade (%) |
|---|---|---|---|---|---|
| Scotia Mine | Proven | 3,366,999 | 2.46 | 1.21 | 3.62 |
| Scotia Mine | Probable | 10,286,762 | 1.88 | 1.07 | 2.91 |
| Scotia Mine | Total | 13,653,761 | 2.02 | 1.10 | 3.09 |
Table 15-2: Scotia Mine Mineral Reserve Estimates
Notes: 2020 Mineral Reserves are as of 01 May 2020 and based on a design cut-off grade of 1.5% ZnEq grade. Cut-off grades are based on a Zinc metal price of US\$1.10/lb, recovery of 89%, a Lead metal price of US\$0.95/lb, and mining recovery of 92%. Average unplanned dilution and mining recovery factors of 12% and 92%, respectively, are assumed.
15.6 Conversion of Mineral Resources to Mineral Reserves
The conversion of Measured and Indicated Mineral Resources to Proven and Probable Mineral Reserves is shown for the Scotia Mine deposit in Table 15-3.
| Scotia Mine | Mineral Resources | Mineral Reserves | Conversion Factor1 | ||||||
|---|---|---|---|---|---|---|---|---|---|
| Measured | Indicated | Total | Proven | Probable | Total | Measured/ | Indicated/ | Total | |
| Proven | Probable | ||||||||
| Tonnage (Mt) | 21.13 | 4.32 | 25.45 | 10.29 | 3.37 | 13.65 | 49 | 78 | 54 |
| Zinc Grade (%) | 2.57 | 1.75 | 1.89 | 2.46 | 1.88 | 2.02 | 75 | 52 | 57 |
| Lead Grade (%) | 1.32 | 0.92 | 0.99 | 1.21 | 1.07 | 1.10 | 71 | 57 | 60 |
Table 15-3: Conversion of Mineral Resources to Mineral Reserves
Note 1: Metal conversion factors reflect total metal content.
16 Mining Methods
Note: Item 16 has no change from Previous NI43-101 Technical Report by Carew, et al, 2020
16.1 Introduction
The Scotia Mine deposit covers a total strike length of approximately 4 kilometers, with some surface constraints in between, and a vertical distance of approximately 120 meters. All mining is from open-pit operations with an expected mine life of approximately 14 years. Mining operations will be conducted utilizing 4 shifts, 12 hours each shift, covering 24 hours per day. The 4 shifts will be on a 4 day on, 4 day off, 4 night on, 4 night off rotation.
The Scotia Mine mineral resources will be extracted using conventional load and haul (truck & shovel) mining methods as determined by optimized pit designs and life-of-mine schedules. Mining operations will be completed using an owner/operator of excavators, loaders, haul trucks and ancillary support equipment as well as some rental equipment. Equipment requirements have been determined based upon required production rates and haulage cycles.
The open pits will be mined on 5-metre-high benches with double benching being utilized on the lower benches which are primarily comprised of fair to good quality. Drilling and blasting is only required for 40 percent of the total material mined over the life of mine plan, which accounts for all of the hard rock to be mined from the pits. The remaining 60 percent is largely comprised of overburden and has been proved to be free digging material based on past operations and will not require blasting. Drilling and blasting will be performed using contract services.
Geotechnical and hydrological studies have determined that pit dewatering is necessary for maximizing pit wall stability, improving mining operations, and minimizing water ground flow from the nearby Gays River. A series of drainage wells are spaced along the perimeter of the main pits, with water pumped either to the mill for use as clean process water, or to sediment control dams located on the mine site for controlled discharge.
16.2 Mine Design
16.2.1 Pit Optimization
A series of pit economic optimizations were generated utilizing Whittle Optimization software to define the optimal pit sizes and their configurations. Both constrained and unconstrained optimizations were completed based on a preliminary economic model and current commodity and operating costs to ascertain the optimal pit configurations considering all available reasonable factors. The optimized pit shell selection was based on the following criteria:
- Revenue
- Cut-off grade
- Strip ratio (amount of waste generated)
Surface contraints (river, roads, current site infrastructure)
Using the selected optimal shell, an ultimate pit design was created using GEMS software. The inputs to the pit optimization are shown in Table 16-1. The optimized pit shell selected for creating the ultimate pit design is shown in Figure 16-1.
| Mining Costs | \$2.06/t |
|---|---|
| Mining Recovery | 95% |
| Mining Dilution | 5% |
| Pit Slope OB | 24 deg |
| Pit Slope Carb/QTZ | 55 deg |
| Pit Slope Evaporite |
51 deg |
| Processing Cost (incl G&A) | \$13.2/t |
| Zn Recovery | 89.0% |
| Pb Recovery | 92.0% |
| Zn Price | US\$1.10/lb |
| Pb Price | US\$0.95/lb |
| Discount Rate | 5% |
| Mining Limit | 13.5 MTPA |
| Processing Limit | 1.0 MTPA |
| Zn Offsite Costs | US\$0.16/lb |
| Pb Offsite Costs | US\$0.10/lb |
| Royalties | 2% |
Table 16-1: Pit Optimization Parameters used for Mine Planning
| Figure 16-1: Constrained Optimized Pit Shell | |||
|---|---|---|---|
| ---------------------------------------------- | -- | -- | -- |

16.3 Geotechnical Considerations
A geotechnical study in February 2020 by Terrain Geoscience Inc. determined the pit wall design criteria to be applied for designing the open pits. The study determined a range of slopes were available based upon saturated, partly saturated, and un-saturated pit faces.
The design parameters were improved if unsaturated pit faces received secondary support via high-tensil mesh and soil anchor bolting. These open pit slope design recommendations are based upon the geological, structural, geomechanical, and hydrogeological data available at the time of writing and presented herein. This design assumes that controlled blasting, fully drained conditions, on-going geotechnical monitoring, and on-going hydrogeological data collection will be completed throughout the life of the mine.
Groundwater pressure (i.e. porewater pressure) is also an important part of open pit slope stability. Groundwater pressures act as buoyant forces directly opposing stabilizing forces in a pit slope. Controlling groundwater levels at the site is considered key to maintaining safe and economic pit slopes in both the overburden and bedrock at the Scotia Mine site. To achieve this overburden depressurization, a series of 60 pumping wells will be placed around the perimeter of the Scotia mine open pits.
During the pit design process, allowance was made for incorporating truck access ramps, final ore zone access and general efficiencies in mine operations and sequencing. Generally, slopes were considerably shallower in final overburden faces. Table 16-2 summarizes the geotechnical pit slope parameters used in this study. Figure 16-2 shows the pit slope design profile.
| Overburden | |
|---|---|
| Bench Height | 5 m |
| Berm Width | 4 m |
| Batter Face Angle (BFA) | 35 deg |
| Inter Ramp Angle (IRA) | 24 deg |
| Overall Slope Angle (OSA) | 25 deg |
| Hard Rock (double benching) | |
| Bench Height | 10 m |
| Berm Width | 5 m |
| Batter Face Angle (BFA) | 70 deg |
| Inter Ramp Angle (IRA) | 49 deg |
| Overall Slope Angle (OSA) | 51 deg |
| Hard Rock (single benching) | |
| Bench Height | 5 m |
| Berm Width | 4 m |
| Batter Face Angle (BFA) | 70 deg |
| Inter Ramp Angle (IRA) | 49 deg |
| Overall Slope Angle (OSA) | 51 deg |
Table 16-2: Geotechnical Pit Slope Parameters

Figure 16-2: Pit Slope Design Details
There are two areas in the pit design where, if the above slope criteria are utilized, the pit would encroach upon the 30m buffer zone along the Gays River. To compensate for this the overall slope angles (OSA) used in overburden for these areas will be steepened from 25 degrees to 29 degrees and a slope stability mesh, with soil anchor bolting, will be installed to increase the strength of the slope and prevent instability. These areas can be seen in Figure 16-3.
In addition to the open pit design recommendations, Terrane provided waste dump geotechnical recommendations as well, see Table 16-3. The waste dump design was guided by the British Columbia Mine Waste Rock Pile Research Committee, Mined Rock and Overburden Piles Investigation and Design Manual Interim Guidelines (1991). See Figure 16-3 for a schematic of the waste dump profile
| Waste Dump | Variable |
|---|---|
| Bench Height | 5 m |
| Berm Width | 4 m |
| Batter Face Angle (BFAº) | 35º |
| Overall Slope Angle (OSAº) | 25º |
Table 16-3: Geotechnical Waste Dump Parameters


Ultimate Pit Design
Using the optimized pit shell, geotechnical design criteria, and surface constraints an ultimate pit design was created with ramps and benches. See Figure 16-18. In addition to the pit slope parameters shown in Section 16-2, the rest of the basis for the ultimate pit design is shown in Table 16-4.
| Table 16-4: Design Basis for Ultimate Pit Design | ||
|---|---|---|
| -------------------------------------------------- | -- | -- |
| Primary Loaders/Haulers | 120T Excavator/40T Truck/60T Truck |
|---|---|
| Two-Way Haul Road Width | 21.5 m |
| One-Way Haul Road Width | 10 m |
| Haul Road Grade | 10% |
| Haul Road Grade (Bottom 4 Benches) | 12% |
| Switchback Inside Turn Radius | 7.5 m |
| Flat Switchbacks | Yes |
| Minimum Mining Width | 30 m |
All, wheeled, one-way haul road traffic with be limited to Komatsu HM 400 trucks and light duty vehicles and all one-way haul roads have been designed as such. Two-way haul road traffic has been designed to accommodate all wheeled vehicles onsite. A 5-metre retreat mining cut will be implemented on final benches with the minimum mining width of 30m or greater. A series of end of period surfaces ("EOP") for each year
were generated to show the progress of the mine throughout the LOM. They can be seen in Figures 16-4 to 16- 17.

Figure 16-4: EOP Surface Year 1
Figure 16-5: EOP Surface Year 2


Figure 16-7: EOP Surface Year 4


Figure 16-9: EOP Surface Year 6


Figure 16-11: EOP Surface Year 8


Figure 16-12: EOP Surface Year 9
Figure 16-13: EOP Surface Year 10

Figure 16-14: EOP Surface Year 11

Figure 16-15: EOP Surface Year 12

Figure 16-16: EOP Surface Year 13

Figure 16-17: EOP Surface Year 14


Figure 16-18: Ultimate Pit Design & Dump Design
16.4 Phased Pit Designs
The ultimate pit design was broken down into 6 phases to optimize development sequences and production requirements. These phases and their sequencing can be seen in Figure 16-19 and Table 16-6 respectively. Ore and waste tonnages, as well as Zn and Pb grades, provided by each open pit phase, are listed in Table 16-5. Waste has been subdivided into overburden, gypsum, and carbonate waste rock. Inferred resource material inside the ultimate pit design has been included as carbonate waste rock and totals approximately 1,450,000 tonnes at 1.5% Zn, 0.7% Pb.
| Pit Phase | Ore (kt) | Zn% | Pb% | Ovb (kt) | Gyp (kt) | Mag (kt) | Carb (kt) |
|---|---|---|---|---|---|---|---|
| MZ PH1 | 3,667 | 2.28 | 1.11 | 17,458 | 7,622 | 1,525 | 2,704 |
| MZ PH2 | 2,121 | 2.30 | 0.76 | 13,536 | 4,655 | 634 | 1,586 |
| MZ PH3 | 1,937 | 2.25 | 1.19 | 17,562 | 7,811 | 818 | 2,416 |
| MZ PH4 | 1,349 | 1.56 | 1.48 | 11,726 | 514 | 60 | 3,095 |
| NE Phase | 1,024 | 2.60 | 1.22 | 7,360 | 6,325 | 1,027 | 490 |
| Getty Phase | 3,556 | 1.49 | 1.08 | 22,483 | 3,925 | 545 | 3,680 |
| Total | 13,654 | 2.03 | 1.10 | 90,125 | 30,852 | 4,609 | 13,971 |
Table 16-5: Tonnage and Grade by Pit Phase
Table 16-6: Phased Pit Sequencing
| Pit Phase | Y1 | Y2 | Y3 | Y4 | Y5 | Y6 | Y7 | Y8 | Y9 | Y10 | Y11 | Y12 | Y13 | Y14 |
|---|---|---|---|---|---|---|---|---|---|---|---|---|---|---|
| MZ PH1 | ||||||||||||||
| MZ PH2 | ||||||||||||||
| MZ PH3 | ||||||||||||||
| MZ PH4 | ||||||||||||||
| NE Phase | ||||||||||||||
| Getty Phase |
Figure 16-19: Phased Pit Sequencing

16.5 Gypsum Assessment
Prior to 2004 there had been no work done as far as gypsum assaying at Scotia Mine as historic drilling focused primarily on Lead and Zinc. While most of the gypsum core was saved, it was improperly stored and most of the gypsum weathered away. Therefore, there was no way to go back and assay the historic holes for Gypsum quality. Drill hole logging was done on all core and good records were kept, however, there were several different drilling programs throughout the years with different geologists performing the logging. This leads to uncertainty as far as consistency of the historic logs (i.e. were the same assumptions used, did the logger call gypsum anhydrite).
In 2004, fourteen vertical holes were drilled with the sole purpose of evaluating the Gypsum quality at Scotia Mine (See Table 16-7). Eight of the holes are located on the North side of the river away from the current LOM pit design, and seven of the holes are located in and around the current LOM pit design. From these holes the average Gypsum thickness was determined to be 31 meters with thicknesses ranging from 9 – 85 meters. The Gypsum is covered by 16 to 61 metres of overburden, averaging 38 metres. From the fourteen holes sixty-nine (69) samples were collected. The length weighted average grade was 93% gypsum. Only seven of these holes are of interest as they fall within the current LOM pit design. The assay results of these holes are provided in the table below.
| Hole ID | Grade of Hole (%) | Thickness (m) | ||||||
|---|---|---|---|---|---|---|---|---|
| S975 | 91 | 44 | ||||||
| S976 | 94 | 25 | ||||||
| S979 | 91 30 |
|||||||
| S988 | 91 | 34 | ||||||
| S989 | 91 | 26 | ||||||
| S990 | 92 | |||||||
| S991 | 95 | 39 |
Table 16-7: 2004 Gypsum Assay Results Within LOM Pit
In 2011, a gypsum resource study was undertaken by looking at the lithology data from the historic logs. From this data an upper and lower horizon of Gypsum was defined, and a Gypsum solid was created using Geovia GEMS software. The total tonnage of Gypsum that was defined as a possible resource was 18,300,000 tonnes. From this total resource tonnage, it was determined that 1,400,000 tonnes could be mined from the 2011 LOM pit. From the Scotia Mine restart study, a total of 5,100,000 tonnes of evaporate (Gypsum + Anhydrite) was planned to be mined from the LOM pit (Note: this tonnage was calculated from the 2011 resource block model, not the drill holes). This results in an Anhydrite:Gypsum ratio of approximately 3.5:1 within the LOM pit. During previous open pit mining operations, Gypsum and Anhydrite was hauled to the dump as waste. Some Gypsum was also used as road base material for temporary roads.
The current PFS LOM pit has approximately 31,000,000 tonnes of evaporite (gypsum + anhydrite) scheduled to be extracted. At the previously calculated 3.5:1 Anhydrite: Gypsum ratio that would equate to approximately 9,000,000 tonnes of commercial grade gypsum contained in the current LOM pit. In 2020 the government of Nova Scotia started a study to evaluate the provinces gypsum resources. Scotia Mine was identified as an area of high potential due to the large gypsum resource and established infrastructure. The fully government funded study will evaluate and estimate the current gypsum resource at Scotia Mine and the potential of Gypsum marketability. ScoZinc will stockpile gypsum separately in the waste dump to ensure it is available should a market be found. An area has been demarcated for stockpiling Gypsum in the future should the need arise (see Figure 16-20).

Figure 16-20: Gypsum Stockpile Locations
Figure 16-21 below shows a typical cross section of the pit with gypsum horizon intersections.

Figure 16-21: Typical Cross Section Showing Gypsum Intersection with Pit
16.6 Waste Management
Waste removed from the open pits will consist of four materials: overburden, gypsum, Meguma basement rock, and carbonate waste rock. Waste storage will consist of a combination of backfilling the mined pits and stockpiling in the waste dump. The waste dump, as seen in Figure 16-22, will consist primarily of overburden. Mineralized carbonate waste will be stockpiled in the waste dump separately for possible future use later should economics and commodity prices improve.
Gypsum will also be segregated within the waste dump when possible in the event the company decides to try and market the gypsum. All Meguma waste will be processed as road rock and placed on the haul roads. As the pits are developed and mined to completion they will be utilized as backfill locations.
The design criteria for the waste dump is listed in Table 16-8.
| Waste Dump | |
|---|---|
| Dump Capacity | 40M m3 |
| Bench Height | 5 m |
| Berm Width | 4 m |
| Batter Face Angle (BFA) | 35 degrees |
| Overall Slope Angle (OSA) | 25 degrees |
| Dump Height | 88 m |
| Haul Road Width | 21.5 m |
| Haul Road Grade | 8% |
| Swell Factor Overburden | 1.4 |
| Swell Factor Rock | 1.3 |
Table 16-8: Waste Dump Design Criteria
The volume required for onsite waste storage versus the amount of waste storage available can be seen in Table 16-9.
| Waste Storage Required | 87M m3 |
|---|---|
| Waste Dump Capacity | 40M m3 |
| Pit Backfill Capacity | 48.1M m3 |
| MZPH1 + Current Pit | 18.6M m3 |
| MZPH2 | 9.3M m3 |
| MZPH3 | 12.9M m3 |
| MZPH4 | 7.4M m3 |
| Total Waste Storage Capacity | 88M m3 |
Table 16-9: Waste Storage Capacity Vs Waste Storage Required

Figure 16-22: Waste Dump Design
The waste movement sequence, along with origin and destination, can be seen in Table 16-10.
| Waste Storage Location | Y1 | Y2 | Y3 | Y4 | Y5 | Y6 | Y7 | Y8 | Y9 | Y10 | Y11 | Y12 | Y13 | Y14 |
|---|---|---|---|---|---|---|---|---|---|---|---|---|---|---|
| To Main Dump | ||||||||||||||
| From MZ PH2 | ||||||||||||||
| From MZ PH1 | ||||||||||||||
| From MZ PH3 | ||||||||||||||
| From MZ PH4 | ||||||||||||||
| To MZ PH2 Pit (Backfill) | ||||||||||||||
| From MZ PH1 | ||||||||||||||
| From MZ PH4 | ||||||||||||||
| To MZ PH1 Pit (Backfill) | ||||||||||||||
| From MZ PH4 | ||||||||||||||
| From MZ PH3 | ||||||||||||||
| From Getty | ||||||||||||||
| From NE | ||||||||||||||
| To MZ PH3 Pit (Backfill) | ||||||||||||||
| From Getty | ||||||||||||||
| From NE | ||||||||||||||
| To MZ PH4 Pit (Backfill) | ||||||||||||||
| From NE |
Table 16-10: Waste Movement Sequence
16.7 Life-of-Mine Production Schedule
Using the Ultimate Pit Designs and the pit phase sequencing, a Life-Of-Mine ("LOM") mining schedule was developed by month and is based on operating 24 hours/day, 365 days/year. Geovia MINESCHED software was used considering the following criteria:
- Daily mine production rates
- Grades
- Multiple mining fronts
- Targeted mill grades and tonnages
- Mining fleet capacities
- Ore stockpile balance management
- Waste dump location and management
- Highway and road crossings
- Proximity to the Gays River
- Operating Expenditure
Table 16-11 presents a summary of the diluted annual mined production tonnages scheduled over the Life-Of-Mine totalling approximately 14 years. The LOM production schedule is based on providing a mill feed of approximately 1,000,000 tonnes per annum at an average zinc equivalent grade of 3.00%. Table 16-6 provides an illustration for how the mining operations will sequence through the pit phases.
16.7.1 Mining Dilution & Recovery
Mining dilution is waste rock that is mined with the ore and cannot be separated out prior to transport to the mill. The dilution can be planned, which is waste included in the design to make it practical and efficient, or unplanned which is waste mined due to overbreak (mining outside the plan limits) or sloughing from the back and walls due to geotechnical reasons.
Mining recovery is the recovery of the mineral resources included in the mine plan and does not apply to those mineral resources already excluded as being outside the mine plan. Recovery losses result from resources left behind during excavation, and ore that does not meet specified economic criteria.
Mining dilution and recovery and how it is calculated and applied to this project is described in Section 15.2.3.
| Table 16-11: Diluted LOM Mine Production Schedule | |
|---|---|
| --------------------------------------------------- | -- |
| MINING | |||||||||||||||||
|---|---|---|---|---|---|---|---|---|---|---|---|---|---|---|---|---|---|
| Material Mined | Year -1 | Year 1 | Year 2 | Year 3 | Year 4 | Year 5 | Year 6 | Year 7 | Year 8 | Year 9 | Year 10 | Year 11 | Year 12 | Year 13 | Year 14 | TOTAL | |
| SHG Ore | tonnes | 1,464 | 6,249 | 0 | 1,146 | 8,855 | 10,437 | 13,698 | 1,454 | 8,761 | 5,719 | 7,460 | 1,448 | 8,828 | 0 | 0 | 75,519 |
| Zn% | grade | 5.26 | 3.91 | 0.00 | 11.69 | 12.17 | 9.75 | 6.31 | 2.27 | 3.56 | 4.54 | 1.05 | 6.48 | 6.46 | 0.00 | 0.00 | 6.31 |
| Pb% | grade | 0.00 | 10.00 | 0.00 | 8.57 | 8.84 | 6.13 | 5.57 | 8.34 | 8.61 | 6.70 | 12.58 | 4.91 | 7.21 | 0.00 | 0.00 | 7.84 |
| HG Ore | tonnes | 20,577 | 187,952 | 195,185 | 94,076 | 153,577 | 257,980 | 405,561 | 163,323 | 265,020 | 203,483 | 137,156 | 202,986 | 217,106 | 64,693 | 154,551 | 2,723,227 |
| Zn% | grade | 3.48 | 3.98 | 3.36 | 3.33 | 3.59 | 3.49 | 3.35 | 2.61 | 3.18 | 3.08 | 2.56 | 3.41 | 3.87 | 2.61 | 2.43 | 3.28 |
| Pb% | grade | 0.00 | 1.44 | 1.88 | 1.57 | 1.75 | 2.06 | 2.42 | 2.61 | 2.41 | 2.87 | 3.26 | 2.06 | 2.05 | 2.24 | 2.92 | 2.26 |
| MG Ore | tonnes | 98,887 | 498,649 | 570,902 | 512,584 | 571,976 | 390,314 | 588,654 | 504,904 | 468,701 | 506,900 | 519,024 | 381,874 | 519,728 | 536,699 | 402,066 | 7,071,863 |
| Zn% | grade | 2.43 | 2.23 | 2.08 | 2.16 | 2.02 | 2.09 | 1.96 | 1.87 | 1.93 | 1.69 | 1.70 | 1.93 | 1.65 | 1.42 | 1.67 | 1.89 |
| Pb% | grade | 0.00 | 0.53 | 0.73 | 0.61 | 0.83 | 0.92 | 0.93 | 0.93 | 0.97 | 1.18 | 1.00 | 1.03 | 1.04 | 1.23 | 1.20 | 0.92 |
| LG Ore | tonnes | 61,642 | 264,664 | 257,202 | 370,274 | 344,475 | 117,166 | 265,572 | 187,026 | 276,669 | 308,778 | 353,397 | 144,648 | 272,616 | 391,320 | 167,704 | 3,783,153 |
| Zn% | grade | 1.63 | 1.48 | 1.48 | 1.49 | 1.35 | 1.28 | 1.34 | 1.25 | 1.25 | 1.30 | 1.25 | 1.25 | 1.15 | 0.96 | 1.07 | 1.29 |
| Pb% | grade | 0.00 | 0.27 | 0.29 | 0.26 | 0.40 | 0.50 | 0.42 | 0.54 | 0.50 | 0.46 | 0.50 | 0.49 | 0.61 | 0.81 | 0.67 | 0.47 |
| Total Ore | tonnes | 182,570 | 957,515 | 1,023,289 | 978,080 | 1,078,883 | 775,897 | 1,273,484 | 856,706 | 1,019,150 | 1,024,880 | 1,017,038 | 730,956 | 1,018,279 | 992,712 | 724,321 | 13,653,761 |
| Zn% | grade | 2.30 | 2.38 | 2.18 | 2.03 | 2.11 | 2.54 | 2.32 | 1.88 | 2.09 | 1.86 | 1.66 | 2.22 | 2.03 | 1.32 | 1.69 | 2.03 |
| Pb% | grade | 0.00 | 0.70 | 0.84 | 0.58 | 0.89 | 1.30 | 1.35 | 1.17 | 1.28 | 1.33 | 1.22 | 1.22 | 1.20 | 1.13 | 1.45 | 1.10 |
| Overburden | tonnes | 4,055,012 10,422,451 | 8,994,179 11,022,075 | 8,846,942 | 7,832,946 | 5,448,424 | 6,757,227 | 6,104,887 | 4,869,946 | 5,587,802 | 3,451,941 | 3,533,442 | 2,706,248 | 490,752 | 90,124,277 | ||
| Gypsum | tonnes | 207,378 | 1,699,040 | 2,732,543 | 164,119 | 1,623,181 | 2,835,011 | 3,400,032 | 2,971,662 | 3,014,604 | 1,936,094 | 1,992,826 | 2,899,818 | 1,887,474 | 1,082,202 | 2,406,352 | 30,852,336 |
| Carbonate | tonnes | 347,826 | 988,672 | 774,064 | 1,520,388 | 1,692,535 | 455,919 | 919,940 | 1,431,601 | 1,199,939 | 730,244 | 996,972 | 261,185 | 653,599 | 1,513,192 | 485,090 | 13,971,167 |
| Meguma | tonnes | 0 | 167,321 | 437,925 | 222,506 | 252,457 | 327,725 | 699,620 | 296,398 | 311,419 | 313,366 | 167,170 | 686,100 | 182,472 | 34,646 | 510,559 | 4,609,685 |
| Total Mine Production | tonnes | 4,792,786 14,235,000 13,962,000 13,907,169 13,494,000 12,227,500 11,741,500 12,313,594 11,650,000 | 8,874,529 | 9,761,808 | 8,030,000 | 7,275,267 | 6,329,000 | 4,617,075 153,211,226 | |||||||||
| Total Ore | tonnes | 182,570 | 957,515 | 1,023,289 | 978,080 | 1,078,883 | 775,897 | 1,273,484 | 856,706 | 1,019,150 | 1,024,880 | 1,017,038 | 730,956 | 1,018,279 | 992,712 | 724,321 | 13,653,761 |
| Total Waste | tonnes | 4,610,216 13,277,485 12,938,711 12,929,089 12,415,116 11,451,602 10,468,016 11,456,888 10,630,849 | 7,849,649 | 8,744,771 | 7,299,044 | 6,256,988 | 5,336,288 | 3,892,754 139,557,465 | |||||||||
| Total Strip Ratio | ratio | 25.25 | 13.87 | 12.64 | 13.22 | 11.51 | 14.76 | 8.22 | 13.37 | 10.43 | 7.66 | 8.60 | 9.99 | 6.14 | 5.38 | 5.37 | 10.22 |
16.8 Ore Stockpile Management
Ore stockpile management will play a key role in grade control at Scotia Mine. It is important to keep a healthy ore stockpile to ensure that the head grades in the mill remain consistent. When the Zn head grade is consistent, and on target, it gives the mill the best chance to operate at its optimal design throughput and recovery. Therefore, when creating the LOM production schedule, a large emphasis was put into keeping the Zn head grade consistent. In order to achieve this, ore stockpiles for specific grade ranges were utilized as seen in Table 16-12.
| Ore Stockpile | Grade Range (ZnEq%) |
|---|---|
| Low Grade | 1.5 – 2.0 |
| Medium Grade | 2.0 – 4.0 |
| High Grade | 4.0 – 10.0 |
| Super High Grade | >10.0 |
The average head grade for the mill over the LOM is approximately 2.0% Zn and 1.0% Pb. The head grade of the mill feed as well as the mill throughput rate is shown in Figure 16-23.


The average size of the total ore stockpile for the LOM is approximately 180,000 tonnes. The largest the total ore stockpile gets during the LOM is 430,000 tonnes. The smallest the total ore stockpile gets during the LOM is 30,000 tonnes. The ore stockpile balance by month for the LOM is shown in Figure 16-24.

Figure 16-24: Ore Stockpile Balances per Month
In order to accommodate the size of the ore stockpile, a ROM ore stockpile area will be demarcated next to the mill as shown in Figure 16-25.

Figure 16-25: ROM Ore Stockpile Area
16.9 Mining Equipment Fleet
The open pit mining operations will be performed as owner/operator. All mining equipment will be leased or obtained under a rental purchase option ("RPO"). Multiple local equipment suppliers were asked to provide budgetary pricing for lease/rental/RPO as well as a 30,000 hour maintenance repair cost agreement ("MARC") on various pieces of equipment. For the purposes of this study ScoZinc has chosen to use the budgetary pricing provided by Komatsu Equipment. The quantity and type of equipment needed has been selected based on the production schedule requirements. There is a three month ramp up period as seen in Table 16-13. The peak production rate reaches 39,000 tonnes/day and gradually decreases over the LOM to approximately 17,000 tonnes/day.
A 30,000 hour MARC between Komatsu and ScoZinc will also be utilized on all equipment purchased to cover the maintenance costs. After the 30,000 hours expires on each piece of equipment ScoZinc will hire its own maintenance personnel to maintain the equipment. The MARC will cover all maintenance expenses related to normal wear and tear except for tires and other consumables such as fuel, lubes, DEF etc. Support equipment to the main mining fleet will include a grader, loader, boom truck, pickup trucks, service vehicles, water truck etc. Fuel will be delivered to site by a fuel supplier. The suppliers fuel truck will delver fuel directly to the tracked machines (Dozers, Excavators) in the mine daily as well as fill the main fuel tanks onsite. Table 16-14 shows the heavy equipment fleet requirements for the operation. Figure 16-26 shows the mine production rates required to achieve the LOM production schedule.

Figure 16-26: Mine Production Rate per Month
| Table 16-13: Mine Production Ramp Up Schedule | |
|---|---|
| Month | Tonnes Per Day |
|---|---|
| Month -5 | 16,000 |
| Month -4 | 25,000 |
| Month -3 | 39,000 |
| Month -4 | 39,000 |
| Table 16-14: Mining Heavy Equipment Fleet Requirements | ||
|---|---|---|
| -------------------------------------------------------- | -- | -- |
| Number of Units | ||||||
|---|---|---|---|---|---|---|
| Equipment | Capital | Operations | ||||
| Komatsu PC1250LC Excavator | 0 | 2 | ||||
| Komatsu PC490 Excavator w/Hydraulic Hammer | 0 | 1 | ||||
| CAT320 Excavator | 1 | 0 | ||||
| Komatsu HD605 Rigid Frame Haul Truck | 0 | 4 | ||||
| Komatsu HM400 Articulated Haul Truck | 0 | 5 | ||||
| Komatsu WA600 Wheel Loader | 0 | 2 | ||||
| Komatsu WA500 Wheel Loader | 0 | 1 | ||||
| Komatsu D155AX Dozer | 0 | 2 | ||||
| CAT16M Grader | 1 | 0 | ||||
| Komatsu HM400-5 Water Truck | 0 | 1 |
16.10 Drilling & Blasting
Drilling and Blasting activities at Scotia Mine will be done by a local contractor. Drilling will be performed using standard hydraulic drills. Holes will be drilled 4.5 – 5.5 inches in diameter using square and staggered drill patterns where applicable. Controlled blasting practices will be utilized on final bench walls. Blasting will be done in 5-metre bench lifts where possible. Due to the presence of underground workings throughout the Main Zone of the ultimate pit, it will be necessary in some instances, due to safety considerations, to blast 10 metre and muck material in 5-metre lifts. The underground workings have been surveyed and modelled and, from past open pit operations, have proven to be extremely accurate. Figure 16-27 shows the location of the underground workings network within the Main Zone of the Life of Mine pit design.
Figure 16-27: 3D View of Underground Workings Network Within the Main Zone Pit
16.11 Open Pit Dewatering & Hydrology
The historic operations have, at times, been disrupted by water inflow into the workings. These groundwater issues, in conjunction with weak metal prices, required the historic underground operation to be placed on care and maintenance on at least three separate occasions (J.D. Mollard & Associates, 1991). Dramatic increases in groundwater inflow into the underground workings occurred during large storm/Gays River flooding events. Increased inflow was attributed to karst sinkholes, located adjacent to the river and which are normally dry, serving as a direct conduit into the underlying bedrock stratigraphy (Martec, 1991). Most of the hydrogeological work completed on the Scotia Mine property has been directed at the historical underground workings and their connection to surface water. To date, Golder (1991) provided the most comprehensive site study of the overburden hydrogeological conditions. The site can be broadly sub-divided into two hydrogeological domains: overburden and bedrock. Both domains are considered connected via sinkholes; therefore, the bedrock domain is linked to both surface water and overburden aquifers.
The overburden domain has not been assessed to the same level of detail as the bedrock domain. There are six primary overburden horizons on the site. These horizons can be classified into a series of aquifers and aquitards. The sandy units (i.e. Upper and Lower Sand) are permeable and water-bearing. In contrast, the clayey soils are low permeability and can act as aquitard horizons; these include the Upper and Lower Lacustrine Clay, the Red Till, and the Lower Till. It is possible that the overburden hydro stratigraphic succession could result in a series of perched water tables (Golder, 1991).
The Red Till is the most common clayey overburden horizon at the site and accordingly, is considered the principal aquitard controlling surface water infiltration. Historically, ground water levels have been lowered at the site up to 100 metres below the current Gays River elevation (~515 m A.S.L). However, this effort focused solely on controlling bedrock inflow into underground workings and did not address water levels in the overburden.
During the 2008 open pit operating period, through a combination of pit perimeter wells and in pit pumping at an average rate of approximately 5,900 US gallons per minute, the amount of water was maintained at acceptable operating levels. ScoZinc plans to improve upon this by utilizing the 60 geotechnical depressurizing wells, as seen in Figure 16.2.28, in conjunction with in-pit pumping to dewater the overburden horizon. The bedrock horizon will be dewatered using the existing deep well infrastructure in conjunction with in-pit temporary wells that access the underground workings. Horizontal wells will also be utilized in the karst gypsum to deal with the localized trapped water and will be allowed to drain into strategically placed in pit sumps which will then be pumped to the tailings facility. All in pit water will be pumped to the tailings facility. Water from the 60 depressurizing wells will be discharged into the Gays River, however some of this water will be used as processing water in the mill. A similar setup will be utilized in the North East and Getty pits.


16.12 Mining Workforce
16.12.1 Mining Operations
The mining operation is planned to be developed and operated by ScoZinc personnel. Initial development of the project will take 5 months. The mining operation will operate 24 hour/day, 7 days/week. All heavy equipment operators and maintenance personnel will work 12 hour/day shifts on a 4 day on, 4 day off, 4 night on, 4 night off schedule. All mining admin staff will work a 5-day work week.
ScoZinc will be responsible for all technical services including geology, mine planning, surveying and supervision of the mining personnel for scope of work and assurance that all mining standards and safety procedures are being diligently adhered to.
ScoZinc will provide all the workforce, equipment and facilities required for the development of the project and LOM resource production. The mining workforce to be provided includes heavy equipment operators (HEO's), supervisors, on-site safety supervisor, first aid attendant, training services and other support staff. Contractors will be used as required for Drill and Blast and other specialty work. The mining operation will ramp up to full production over the course of three months with maximum production starting in month four. Mining personnel will be added in accordance with the schedule.
The workforce required for mining over the LOM from start of project to end of production is shown in Table 16-15 below.
| Category | Personnel |
|---|---|
| Mine Manager | 1 |
| Mine Superintendent | 1 |
| Chief Mine Engineer | 1 |
| Mobile Maintenance Supervisor | 1 |
| Mobile Maintenance Mechanic | 16 |
| Geologist/GIS Tech | 1 |
| Surveyor | 1 |
| Heavy Equipment Operators ("HEO") | 51 |
| Shift Supervisors | 4 |
| HEO Trainer | 1 |
| Utility/General Laborers | 4 |
| Samplers | 2 |
| Total | 68 |
Table 16-15: Mining Workforce During Peak Operation
16.13 Mining Mobile Maintenance
As mentioned in section 16.2.9, equipment will initially be leased from a local supplier. As a result, a 30,000 hour Maintenance and Repair Agreement (MARC) between the equipment supplier and ScoZinc will be utilized. This will require only minimal ScoZinc mobile maintenance staff in the first three years of the LOM as the equipment supplier will be proving the maintenance staffing under the maintenance agreement. ScoZinc will keep maintenance staff on in the first three years as there will be mining equipment onsite that will not fall under the MARC. The current maintenance shop, which is too small to house the proposed fleet, in conjunction with current storage tent will be utilized for critical spares storage as well as light vehicle maintenance. Maintenance work on heavy equipment will be performed outside in the maintenance laydown area (see Figure 16-29). This set up will be used during the first two years of the LOM, after which a maintenance building will be erected to accommodate the loaders, dozers, trucks, and support equipment (as seen in Figure 16-29). Maintenance performed on the larger excavators will continue to be outside in the maintenance laydown area.
Table 16-16 shows the Mine Maintenance and Site Services workforce during peak operation.
| Category | Personnel |
|---|---|
| Mobile Maintenance Supervisor | 1 |
| General Foreman | 1 |
| Mechanics | 16 |
| Electrician | 1 |
| Plumber | 1 |
| General laborers | 4 |
| Total | 24 |
| Table 16-16: Mine Maintenance & Site Services Workforce During Peak Operation | |
|---|---|

Figure 16-29: Mine Infrastructure Layout
17 Recovery Methods
Note: Item 17 has no change from Previous NI43-101 Technical Report by Carew, et al, 2020
17.1 Overall Process Design
The provided testwork was analysed and several options of process routes were addressed in the initial stages of the pre-feasibility study. Based on the analysis, a process route was chosen as the best suited for the testwork results and subsequent economic analysis for the material. The unit operations selected are typical for this industry.
Per the mining production schedule, as the blended low-grade ore will be fed to the mill in the Life of Mine (LOM) which is 14 years. The project will utilise a more capital cost-effective mill design, including a grind of 110 µm at 2,700 t/d.
Key process design criteria are listed below:
- Max throughput of 2,700 t/d or 0.98 Mt/a
- Lead head grade of 1.1% and zinc head grade of 2.39%
- Crushing plant availability of 60%
- Grinding and Flotation plant availability of 92%
- Dewatering and concentrate handling availability of 85%
17.2 Mill Process Plant Description
The Process design is comprised of the following circuits:
- Primary, secondary and tertiary crushing circuit
- Fine ore bin to buffer throughput to the grinding circuit
- Rod mill with trommel screen followed by 2 ball mills with cyclone classification (1 of the ball mills is the former regrind mill)
- Pb and Zn flotation circuit
- Pb and Zn dewatering circuit
- Tailings discharge to tailings management facility
- Concentrate handling
17.2.1 Plant Design Criteria
Key process design criteria for the mill during Phase 1 are listed in Table 17-1 (overleaf).
Figure 17-1: Processing Plant

17.2.2 Stockpiling & Crushing
The crushing circuit is designed for an annual operating time of 5,256 hour per annum or 60% availability.
Material is hauled from the mine to stockpiles. Provision for dumping on the ROM pad for blending and rehandling into the mobile jaw crusher feed hopper is provided. Material from the mobile jaw crusher (P80: - 70mm) is crushed further by new secondary cone crusher (P80: -40mm. The secondary crusher product then feeds a new sizing screen (6'x12' double deck). The oversize from the new sizing screen feeds and existing cone crusher (formally existing secondary crusher) to produce a product P80 of -14.5mm.
The crushed material is conveyed to an existing fine ore bin that provides approximately 10 hours of live storage. Given the milling operation is designed for an annual operating time of 8,059 hours per annum or 92% availability, this will result in excess crushed material production when the crusher is operational. The excess crushed material will allow routine crusher maintenance to be carried out without interrupting feed to the mill.
The fine ore bin discharge area is equipped with 2 upgraded belt feeders to regulate feed at 122 t/h onto the rod mill feed conveyor.
The material handling and crushing circuit includes the following key equipment:
- Mobile Jaw Crusher
- New Secondary Cone Crusher
- New Sizing Screen
- Upgraded Conveyor Belt Drives & Pullies
- Existing refurbished Tertiary Crusher (Formally the secondary crusher)
| Design Parameter | Units | Value |
|---|---|---|
| Plant Throughput | t/d | 2,700 |
| Zn Head Grade – Design |
% | 2.0 |
| Pb Head Grade - Design |
% | 1.0 |
| Crushing Plant Availability | % | 60 |
| Mill Availability | % | 92 |
| SMC Breakage | Axb | 74.1 |
| Bond Ball Mill Work Index (BWi) | kWh/t | 8.7 |
| Bond Abrasion Index (Ai) | g | 0.63 |
| Primary Crusher | Sandvik Mobile Jaw QJ331 | |
| Ore Specific Gravity | - | 2.68 |
| Angle of Repose | degrees | 37 |
| Moisture Content | % | 4.0 |
| Rod Mill Dimensions | 2.44 m' dia. X 3.66 m' | |
| Rod Mill Installed Power | kW | 300 |
| Rod Mill Discharge Density | % w/w | 70 |
| Rod Mill Rod Charge | % v/v | 45 |
| Ball Mill Dimensions | 3.35 m dia. X 4.57 | |
| Ball Mill Installed Power | kW | 670 |
| Ball Mill Discharge Density | % w/w | 70 |
| Ball Mill Ball Charge | % v/v | 40 |
| Ball Mill (Formally Regrind Mill) Dimensions | 2.13 m dia. X 3.35 m | |
| Ball Mill (Formally Regrind Mill) Installed Power | kW | 187 |
| Ball Mill (Formally Regrind Mill) Discharge Density | % w/w | 70 |
| Ball Mill (Formally Regrind Mill) Ball Charge | % v/v | 40 |
| Primary Grind size (P80) Classification |
µm | 110 |
| Pb Concentrate Production | t/d | 1.5 |
| Zn Concentrate Production | t/d | 4.6 |
| Reagents | ||
| Zinc Sulphate | g/t | 1100 |
| Sodium Cyanide | g/t | 210 |
| Potassium Ethyl Xanthate (PEX) | g/t | 12 |
| Sodium Isopropyl Xanthate (SIPX) | g/t | 21 |
| Methyl Isobutyl Carbinol (MIBC) | g/t | 166 |
Table 17-1: Key Milling Plant Process Design Criteria
| Design Parameter | Units | Value |
|---|---|---|
| Copper Sulphate | g/t | 500 |
| Quick Lime | g/t | 150 |
| Flocculant (Lead Concentrate Thickener) | g/t | 20 |
| Flocculant (Zinc Concentrate Thickener) | g/t | 30 |
17.2.3 Grinding Circuit
The grinding circuit consists of a rod mill followed by two ball mills in closed circuit with a new cyclone pack. The circuit is sized based on a cyclone overflow 80% passing size (P80) of 110 µm. The rod mill slurry discharges through a trommel screen into the cyclone feed pumpbox.
The ball mills are fed by the cyclone underflow. The cyclone underflow launder is split to feed the two different sized ball mills. The ball mill discharges through a trommel and the oversize is screened out and discharged to a scats chute. Trommel undersize discharges into the cyclone feed pumpbox.
The former regrind mill discharges through a trommel and the oversize is screened out and discharged to a scats chute. Trommel undersize is pumped to the cyclone feed pumpbox.
Water is added to the cyclone feed pumpbox to obtain the appropriate density prior to pumping to the cyclones. Cyclone overflow gravitates to a new cyclone OF feed tank and then pumped to the Pb conditioner tank.
The grinding circuit includes the following key equipment:
- Existing 300 kW rod mill
- Existing 670 kW ball mill
- Existing 197 kW ball mill
- New cyclone feed pumpbox
- New Hydrocyclones
17.2.4 Flotation Circuit
The flotation circuit begins with the agitated Pb conditioner tank which overflows into the Pb rougher flotation cells. The Pb rougher flotation concentrate feeds the Pb 1st cleaner and the Pb rougher tails feeds the Pb scavenger flotation cells. 3rd cleaner concentrate feed the final Pb concentrate pump box which feeds the Pb thickener.
The Pb scavenger concentrate and Pb cleaner tails feeds back to the Pb rougher flotation cells. The Pb scavenger tails are pumped to the Zn conditioner tanks.
The Zn conditioner tanks feed the new Zn rougher (Jameson Cell). The Zn rougher concentrate feeds the Zn 1st cleaner flotation cells and the Zn rougher tails feeds the Zn scavenger floatation circuit (former Zn rougher floatation circuit).
The Zn scavenger concentrate feeds back into the Zn rougher feed (Jameson cell) and the Zn scavenger tails together with the Zn scavenger cleaner and 2nd cleaner tails feeds the final tails pump box which goes to tailing storage facility ("TSF").
The Zn 1st cleaner flotation cells concentrate feeds the 2nd, 3rd, 4th, and 5th Zn cleaner flotation cells. The concentrate from the 5th cleaner feeds the Zn final concentrate pump box which feeds the Pb thickener.
The flotation circuit includes the following key equipment:
- Existing Pb conditioner tank
- Existing Pb rougher flotation cells
- Existing Pb rougher scavenger cells
- Existing Pb 1st, 2nd, and 3rd cleaner cells
- Existing Zn conditioner tanks
- New Jameson rougher cell
- Existing Zn 1st, 2nd, 3rd rougher scavenger (former Zn rougher cells)
- Existing Zn 1st, 2nd, 3rd, 4th and 5th cleaner cells
17.2.5 Dewatering Circuit
The Pb and Zn concentrate feed the Pb and Zn thickeners, respectively. The thickener underflow feed the respective concentrate surge tanks before the feeding the concentrate filter presses.
The filter presses are supplied with a dedicated compressor and receiver. The filter presses also require effluent management tanks and clean water tank for filter cycle flow management.
The Dewatering circuit includes the following key equipment:
- Existing Pb thickener
- Existing Zn thickener
- New Pb filter press
- New Zn filter press
17.2.6 Concentrate Handling Circuit
The dried cake from the Zn and Pb filters will fall onto existing Zn and Pb stockpile feed conveyors respectively. The Zn and Pb concentrate from the existing stockpile feed conveyors will feed into a 10-ton surge bins. These bins allow for contingency on concentrate handing delays (supplied by ScoZinc). The 10-ton surge bins will feed onto telescopic feed conveyors that will feed into lined concentrate 20ft containers. The concentrate containers will be replaced once filled with concentrate and taken to a container storage area for weighing and shipping.
The concentrate handling circuit includes the following key equipment (for both Pb and for Zn):
- 10-ton surge bins
- Telescopic conveyors
17.2.7 Tailings
Tailings are pumped from the tailings pumpbox to the TSF. The main equipment in this area includes:
- Existing pumpbox
- New tailings pumps
- New tailings discharge pipeline
17.2.8 Flowsheet and Layout Drawings
An overall process flow diagram showing the unit operations in the selected process flowsheet is presented in Figure 17-2.
Plans and sections of the proposed plant areas where changes have been made are provided in figure 17-3 to Figure 17-6 shows the existing reagent flow sheet.
The changes made indicated in the figures below are as follows:
Figure 17-3 shows all changes made to existing mill in relation to existing infrastructure. Namely:
- o Crusher area changes and additions
- o Screening area changes and additions
- o Flotation area additional Jameson Cell location
- o Dewatering area additions
- o Concentrate handling additions.
Figure 17-4 shows new secondary crusher position on existing mill feed bin and new chutes to existing screen feed conveyor
Figure 17-5 shows new double deck screen
Figure 17-6 new filter presses and telescopic conveyors


Source: Ausenco, 2020.
Figure 17-3: Overall Plant Layout

Figure 17-4: Crushing Area Section

Source: Ausenco, 2020.

Figure 17-5: Sizing Screen Area Section
Source: Ausenco, 2020.


Source: Ausenco, 2020.

Figure 17-7: Reagent Flow Sheet
17.3 Life of Mine Concentrate Production
The Scotia Mine has a total throughput of approximately 1 million tonnes per year for all but the last year of its mine life. See Figure 17-7 below. This equates to an average throughput rate of 2,700 tonnes per day at average life of mine grades of 2.03% Zn and 1.10% Pb.

Figure 17-8: Annual Ore Processed


Two types of concentrate are produced over the mine life from the carbonate hosted orebody. Average concentrate tonnages per year are approximately 33,000 tonnes for Zinc and 10,000 tonnes for Lead over the life of the mine. The figure below shows the projected volumes of the two concentrates each year that will be produced at the Scotia Mine over the Life of Mine.

Figure 17-10: Forecast LOM Concentrate Production
In terms of concentrate production, payable metal and recoveries, the following two figures provide the annual production profiles for either of the Zinc and Lead concentrates.

Figure 17-11: Zinc Concentrate Production
Figure 17-12: Lead Concentrate Production

17.4 Reagent Handling & Storage
Each set of compatible reagents mixing, and storage systems are existing and located within curbed containment areas to prevent incompatible reagents from mixing. See Figure 17-7 for reagent mixing and dosing system layout. Header tanks are fed via surge tanks containing mixed reagents in solution with water. Appropriate ventilation is available as there is an existing exhaust fan, eyewash stations need to be checked. Sumps and sump pumps are provided for spillage control.
The following reagents are required for the process:
- Hydrated lime
- Sodium cyanide
- Zinc sulphate
- Copper sulphate
- Flocculants
- Sodium Isopropyl Xanthate
- Potassium Ethyl Xanthate
- MIBC
17.4.1 Hydrated Lime
Hydrated lime is delivered in bags, which are lifted using a frame and hoist into the hydrated lime bag breaker on top of the mixing/storage tank. The solid reagent discharges into the tank and is slurried in process water to achieve the required dosing concentration. The slurried hydrated lime is pumped through a ring main with distribution points in leaching and cyanide destruction.
17.4.2 Sodium Cyanide
Sodium cyanide ("NaCN") is delivered to site in secured boxes containing the reagent bags. Bags are lifted using a frame and hoist into the sodium cyanide bag breaker on top of the tank. The solid reagent discharges into the tank and is dissolved in water to achieve the required dosing concentration.
After the mixing period is complete, cyanide solution is transferred to the cyanide storage tank using a transfer pump. Sodium cyanide is delivered to the flotation concentrate leach circuit, flotation tailings leach circuit, intensive leach circuit and elution circuit with dedicated dosing pumps. An extraction fan is provided over the sodium cyanide bag breaker/mixing tank to remove reagent dust that may be generated during reagent addition/mixing.
17.4.3 Zinc Sulphate
Zinc sulphate pentahydrate is delivered in solid crystal form in small bags and stored in the warehouse. Process water is added to the agitated zinc sulphate mixing tank. A pallet of bags is lifted using a frame and hoist, and periodically a single bag is placed on the zinc sulphate bag breaker on top of the tank. The solid reagent falls into the tank and is dissolved in water to achieve the required dosing concentration.
Zinc sulphate solution is transferred by gravity to the zinc sulphate storage tank, which has a stacked arrangement with the mixing tank. An extraction fan is provided over the zinc sulphate bag breaker/mixing tank to remove reagent dust that may be generated during reagent addition/mixing.
17.4.4 Copper Sulphate
Copper sulphate pentahydrate is delivered in solid crystal form in small bags and stored in the warehouse. Process water is added to the agitated copper sulphate mixing tank. A pallet of bags is lifted using a frame and hoist, and periodically a single bag is placed on the copper sulphate bag breaker on top of the tank. The solid reagent falls into the tank and is dissolved in water to achieve the required dosing concentration.
Copper sulphate solution is transferred by gravity to the copper sulphate storage tank, which has a stacked arrangement with the mixing tank. An extraction fan is provided over the copper sulphate bag breaker/mixing tank to remove reagent dust that may be generated during reagent addition/mixing.
17.4.5 Sodium Isopropyl Xanthate
Sodium Isopropyl Xanthate ("SIPX") is delivered in bulk bags. Process water is added to the agitated SIPX mixing tank. Bags are lifted into the bag breaker on top of the mixing tank. The solid reagent falls into the tank and is dissolved in water to achieve the required concentration. After the mixing period is complete, SIPX solution is transferred to the SMBS storage tank using the SMBS transfer pump. The SMBS mixing area is ventilated using the SMBS area roof fan.
17.4.6 Flocculant
Powdered flocculant is delivered to site in bulk bags and stored in the warehouse. A self-contained mixing and dosing system is installed, including a flocculant storage hopper, flocculant blower, flocculant wetting head, flocculant mixing tank, and flocculant transfer pump. Powdered flocculant is loaded into the flocculant storage hopper using the flocculant hoist. Dry flocculant is pneumatically transferred into the wetting head, where it is contacted with water.
Flocculant solution, at 0.50% w/v, is agitated in the flocculant mixing tank for a pre-set period. After a pre-set time, the flocculant is transferred to the flocculant storage tank using the flocculant transfer pump. Flocculant is dosed to the various high rate thickeners using variable speed helical rotor style pumps. Flocculant is further diluted just prior to the addition point.
17.4.7 Frother
Frother ("MIBC") is delivered as a liquid in IBCs and stored in the warehouse until required. A permanent bulk box is installed to provide storage capacity local to the flotation area. MIBC is used as-received and without dilution. Diaphragm-style dosing pumps deliver the reagent to the required locations within the flotation circuit. A top-up of the permanent bulk boxes is carried out manually as required.
17.4.8 Potassium Amyl Xanthate
Potassium Amyl Xanthate ("PAX") is delivered in granular powder form in bags and stored in the warehouse. Raw water is added to the agitated PAX mixing tank. Bags are lifted using a frame and hoist into the PAX bag breaker on top of the tank. The solid reagent falls into the tank and is dissolved in water to achieve the required dosing concentration. PAX solution is transferred by gravity to the PAX storage tank, which has a stacked arrangement with the mixing tank.
The mixing tank is ventilated using the PAX tank fan to remove any carbon disulphide gas. PAX is delivered to the flotation circuit using the PAX dosing pump. Actuated control valves provide the required PAX flowrates at several locations around the flotation circuit.
17.5 Services & Utilities
17.5.1 Process/ Instrument Air
High-pressure air at 700 kPa is produced by existing compressors to meet existing plant requirements. The highpressure air supply is dried and used to satisfy both plant air and instrument air demand. Dried air is distributed via the air receivers located throughout the plant. (Reference: Kilborn drawing 300-17-5).
17.5.2 Low Pressure Air
Low-pressure air for flotation is supplied by existing air blowers.
17.6 Water Supply
17.6.1 Raw Water Supply System
Raw water is supplied to an existing process water storage tank. Raw water is used for all purposes requiring clean water with low dissolved solids and low salt content, primarily as follows:
- Gland water for pumps
- Reagent make-up
-
Raw water is treated and stored in the potable water storage tank for use in safety showers and other similar applications:
-
o Fire water for use in the sprinkler and hydrant system
- o Cooling water for mill motors and mill lubrication systems (closed loop)
17.6.2 Process Water Supply System
TSF decant return water meets the main process water requirements. Raw water from Gays pump station and or mining operations provides any additional make-up water requirements.
17.6.3 Gland Water
One dedicated gland water pump is fed from the freshwater tank to supply gland water to all slurry pump applications in the plant.
18 Project Infrastructure
Note: Item 18 has no change from Previous NI43-101 Technical Report by Carew, et al, 2020
The Scotia Mine is conveniently located 33 kilometres from Halifax's International Stanfield Airport (YHZ) in Nova Scotia with excellent infrastructure in place including processing facilities, waste dumps, a tailings pond, grid-power, all-season port access, and all-season highways. Building infrastructure in place has an actual area of approximately 131,585 square feet.
Halifax is the provincial capital of Nova Scotia (Canada) and, in combination with surrounding communities, forms a major center of population, government, business, education, industry, and transportation services. The mine site is 62 kilometres northeast of Halifax city centre and is directly accessible from the paved provincial Highway #277 or #224. The property area is rural and has been extensively developed for agricultural purposes in the past.
As the Scotia Mine is fully permitted for operations, relatively minor upgrades and improvements to the processing facilities enable the operation to commence commercial production within a relatively short time frame of months.

Figure 18-1: Site Aerial photo (2017)
The mine site infrastructure is well established, as it has been on high level care & maintenance since 2009.
ScoZinc intends to expand the existing operations with the additions of a ROM based primary crusher, container handling yard, mobile fleet fuel bay and additional workshop, and a natural gas power station. Some of these opportunities require permitting, and have not been included in the pre-feasibility study.

Figure 18-2: Proposed site layout mining additions (plan view)
Figure 18-3: Proposed site layout processing additions (plan view)

18.1 Scotia Mine Workforce
Due to the Scotia Mine's location, ScoZinc expects to directly and in-directly engage a high-quality labour force, with as many locally sourced personnel as possible. Personnel are currently and predominantly sourced from the Halifax Regional Municipality and neighbouring townships within Nova Scotia. Mine site accommodation is not required for the workforce.
The Scotia Mine expects to offer a shift-worker changeover bus service between the mine and two publicly designated parking points located at Fall River (Park Ride and Ride) and Milford (Bayberry Drive Parking). Both locations are on dual lane all-season highways 102/224 and 118, respectively. Management believes that such a service will improve the safety, convenience and cost of certain workers commuting after relatively long shift hours.
ScoZinc also owns a 3-bedroom fully furnished guest house on one of its exploration prospects adjacent to the mine. Management intends to utilize the guest house for certain short-stay visitors and guests to reduce costs of visits.
18.2 Electrical Power Systems
A permanent 25 kV three-phase electrical power line is provided to the mine site by Nova Scotia Power from the Elmsdale substation using the Nova Scotia provincial grid. Power poles are located along the perimeter of the Scotia Mine, which then cross the Gays River to the Mine Lease. From the entry point at Gays River, a number of power lines branch off to three separate transformers.
This system has provided consistent power to the Scotia Mine electrical transformers and electrical distribution network across site to the mill, all site buildings, security lighting, plus water pumping stations and dewatering pumps.
The current system consists of the following equipment:
- One large 8,000 kVA transformer sub-station for mill
- Six large transformers ranging from 1,500 kVA to 2,000 kVa
- Six small transformers ranging from 30kVA to 45 kVa
- Over 4.5 kilometres of powerlines and power poles
- CAT Power trailered emergency generator
The electrical network of three-phase powerlines and power poles are in good condition. As a portion of the network will be relocated to account for the main pit expansion during the pre-production phase, replacement of any unserviceable components has been estimated in the capital expenditure.
To de-risk historical operating issues with the 8,000 kVA transformer overheating and future reliability, it will be replaced with a refurbished late-model unit of similar capacity. The existing transformer will be delegated as a backup unit. The Motor Control Centre of the plant will also be upgraded with any new switches and breakers as necessary. The Motor Control Centre for the primary crusher was installed in 2008 and has only been used for trial crushing, and is considered to be in good working condition.
The other transformers and substations on site are in good or excellent working condition. See Figure 18-5.

Figure 18-4: 8,000 kVA transformer
Figure 18-5: Mine dewatering transformer and substation

Although the existing site electrical system has been proven under operational levels, ScoZinc intends to upgrade certain aspects of the system with the following:
- Additional back up transformer to the 8,000 kVA transformer used at the Mill
- Upgraded backup generator
- Photo-voltaic (PV) Solar Systems for Administration and support buildings
- Re-routing of the powerline for pit development needs
Load-sharing and load-shedding protocols will be a part of electrical system operating procedures. The Electrical Load to operate the Mill has an installed power of 2.7 MW. Site installed power is approximately 750 kilowatts, although this may be increased to up to 1.5 MW with the addition of pit dewatering wells in the mining operations. A single line diagram of the current installed power system is provided below.

Figure 18-6: Existing Electrical System Single-Line Diagrams
18.3 Water
18.3.1 Water Treatment Plant
ScoZinc has a water treatment system which includes a pumping station at Gays River, an enclosed water treatment building with pumps, treatment tanks & filters, and water storage of up to 1098 m3 (290,000 gallons). Total building size is 132 m2 (1,422 square feet). The large water tank shown holds 986 m3 (240,000 gallons), including 680 m3 (180,000 gallon) fire water reserve for fire suppression, and the smaller tank 189 m3 (50,000 gallons) is used for site potable water requirements. The building and tanks are in good condition with only minor repairs required over time. The water treatment system will be replaced with new filter media. See figure below.

Figure 18-7: Water treatment plant and water storage
18.3.2 Potable Water
Domestic water is currently pumped from the Gays River to a water treatment plant and 189 cubic metre (50,000 US gallon) storage tank. An intake system and pumping station is located near the mine entrance and provides up to 23,000 litres per day (320 gallons per minute) of fresh river water to the water treatment facility. The existing water treatment system will be upgraded with new filter media.
The pumping capacity is also sufficient to supply all the fire suppression requirement on the mine site. The building and pumps are in good condition, and the intake system will likely require some maintenance to remove sediment prior to use.
Drinking water is provided to personnel from external sources.

Figure 18-8: Pumping station at Gay's River
18.4 Site Water Management
The Scotia Mine has five main sources of water for the site, namely:
- Water pumping from the Gays River
- Water pumping from open-pit perimeter wells
- Water inflows to the open-pit operations
- Water pumping from old underground workings
- Rainfall water catchment
Water for fire suppression and general site water needs is sourced from the Gays River using the mine's existing 72,680 litres per hour (320 US gallons per minute) pumping station and water treatment plant. This Plant consists of mixing tanks, pumps, piping and control systems designed to treat up to 23,000 litres per day (4 gpm). ScoZinc has an existing water licence of up to 320 gallons per minute (23,000 litres per day). This pumping system is more than adequate for the life of the mine.
The majority of site water is provided for mineral processing and dust suppression operations by over 50 vertical wells of varying depths drilled on the perimeter of the open-pit mining operations. These wells are planned to intercept ground water before it enters the open-pit, thereby improving pit slope stability and mining operations, and also provide clean reliable water quality for mineral processing purposes. Although the majority of this well water is considered to be free of any contaminants, it will be pumped to a new reservoir located between the mill and the TSF. With a proposed capacity of 5,000 cubic metres (1.3 million gallons), any sediments will be settled out before pumping to the mill as process water. Excess water from the reservoir will be either drained to the tailings pond or to the settlement pond depending on the quality of the excess water. The Reservoir will be divided into two or more ponds allowing for sediment collection and removal as required.
Figure 18-9: Proposed New Reservoir location

Mine water (or surface water) sourced during mining operations is assumed to be contaminated with oil, mud and blasting residues, requiring that all water pumped from sumps in the open-pit operations to be transferred directly to the tailings pond for settlement. Any water wells located in the main pit which are designed to access the old underground workings (underground mine water) will be pumped to the tailings pond. Deep wells in the old underground workings were used in the past and were successful at keeping dry pit floors during much of the operating seasons.
Mineral process water (tailings) contains low concentrations of primarily zinc and lead metals plus residues from flotation chemicals. Tailings are discharged into an established and fully permitted large valley-style tailings storage facility where residues are settled. Water is further settled with via a devoted three-celled polishing pond, where most of the remaining dissolved zinc metals precipitate out of the water before it flows into a catchment pond for final settling. After the catchment pond, water flows through a controlled culvert to Harrison Creek. Scotia Mine rigorously tests and monitors all water discharge to the environment along this process. Water levels in the TSF, polishing pond and catchment ponds will fluctuate seasonally, increasing in the fall and spring months, and decreasing in the summer and winter months.

Figure 18-10: Tailings Pond
Figure 18-11: Polishing Pond

The mine also has another storm pond near the main administration building which ensures that any site water near workshops and buildings are controlled and monitored before discharging to the environment.
Figure 18-12: Storm Water Pond

Effluent discharge from the Scotia Mine is regulated by an existing Water Licence and effluent treatment systems that includes a number of underground holding and processing tanks for solid and liquid human waste. Solid effluent is disposed off site via contract transfer services. Liquid effluent is pumped to a large existing perforated pipe leach field on the mine site. The Scotia mine performs weekly sampling of all site effluent, and is confident the proven systems in place satisfactory for the life of mine.
All water, treated and untreated, will be released to the Gays River according to the water quality protocols provided in the mine's Environment Assessment and Industrial Approvals regulations. The Scotia Mine has a number of upstream and downstream monitoring points that it tests and independently assays to ensure appropriate controls are in place.
The site water management balance showing the site water supply and distribution is provided in the schematic plan as follows.

Figure 18-13: Scotia Mine site supply and distribution
18.5 Medical Facilities
The Scotia Mine has medical facilities on site, including a first aide treatment room and various emergency medical equipment. Basic medical support services will be provided on site during normal operations with a fulltime paramedic, supported by appropriately trained first aid warehouse personnel. These personnel will also be responsible for any site emergency response.
For additional medical services, personnel may be transported to the nearby regional hospitals by sealed highway. The mine is 25 kilometres (20 minutes by road) from the Musquodoboit Valley Memorial Hospital, and 52 kilometres (33 minutes by road) to the Cobequid Community Health Centre in Lower Sackville, Halifax. Both hospitals provide 24-hour emergency services.
18.6 Telecommunications
Telecommunications on site currently include a national phone service, mobile phone cellular cover, and a highspeed internet service. All existing services are reliable and have been proven under previous operating periods.
The mine currently has a facsimile line and several telephone lines to a fully operational digital phone PABX system. The telephone lines are currently provided by Bell-Atlantic at a nominal monthly cost for external and incoming communications, and the PABX system enables site wide calls between most rooms and offices across the mine site.
Mobile phone cellular coverage at the mine is excellent, with a number of providers offering mobile phone services in the area. The Scotia Mine uses a number of mobile phones for manage and site security services at regular provincial and national calling rates.
Internet access is currently in place with a national provider using a microwave link to a fiber-optic connection. A new fibre-optic service directly to site from the nearby fibre node is being planned to significantly upgrade the band-width on site and to enable the current IT network to be upgraded with additional high-speed modems and routers for fast offsite management and security monitoring.
A VHF radio system is also available across site for operations personnel, with a number of handsets available for use. This system is planned to be upgraded as necessary.
18.7 Administration building
The main Administration Building is of block-cavity steel-clad construction is 3,521 square feet in size. The entire building is fitted with electric heating and cooling systems. The Administration Building includes the following:
- Security offices
- Management offices
- Open workspaces & lunchroom
- Conference room
- Server room & vault
- Change rooms including bathrooms and showers
- File storage
- All utilities (power, water, light)
- WIFI, Internet, & LAN connected
- Security system
- Kantech access control system

Figure 18-14: Administration Building
18.8 Mine Services Building
Connected by enclosed walkway to the Administration Building, the Mine Services Building is of block-cavity steel-clad construction approximately 5,076 square feet in size. The building is provided with electric heating systems. This building is in excellent structural condition and provides operational and technical support to the mining operation, and contains:
- supervisory and technical offices
- open workspaces
- operations meeting room
- safety and training room
- conference meeting room
- environmental services room
- survey equipment room
- medical equipment room
- file storage
- All utilities (power, water, light)
- WIFI, Internet, & LAN connected
- Security systems
Figure 18-15: Mine Technical Services & Operations Building

18.9 Warehouse & Workshop
Connected to the Administration building, the Warehouse is of block-cavity steel-clad construction of 11,312 square feet in size. The Warehouse stores supplies and spare parts for the site services and the mill. The Warehouse contains an inventory of equipment & spares with an assessed value of over \$5 million.
The Warehouse building is in good structural condition and contains the following:
- Supervisory offices
- Warehouse storage rooms
- Receiving bay with electric roller door
- Electrical bay, MCC room and storage
- Plumbing bay and storage
- Tool equipment store
- Equipment and spare parts
- Open workspaces & lunchroom
- First aide room, and Safety and training room
- Mezzanine storage areas (x2)
- All utilities (power, water, light)
- Internet/LAN connected, Security systems
- HVAC
Figure 18-16: Warehouse & Workshop


18.10 Equipment and Spare Parts Asset Inventory
In addition to the existing infrastructure and processing equipment, ScoZinc owns an extensive amount of spare parts and equipment assets stored on the mine site buildings or in storage yards. The Scotia Mine's asset register lists over 600 categorized items and their quantities with a recently assessed combined value of \$5.3 million. The figures provide images of some examples of the items on the asset register presently on site.
Figure 18-18: Selected Processing Assets

Figure 18-19: Selected Processing Assets

Figure 18-20: Selected Processing Assets

Figure 18-21: Selected Warehouse Assets

Figure 18-22: Selected Maintenance Assets

Figure 18-23: Selected Maintenance Assets


Figure 18-24: Selected Mining Assets
18.11 Maintenance Garage
Connected to the Warehouse building, the Maintenance Garage is of block-cavity steel-clad construction of 4,858 square feet in size. The Maintenance Workshop provides repair and maintenance services for site services equipment, fixed equipment maintenance, dewatering equipment, plus mobile equipment maintenance services for various small to medium mobile equipment.
The building is in good structural condition and contains the following:
- Supervisor office
- 4 equipment access bays
- Tool room
- Electrical workshop
- Plumbing workshop
- Tire lube bay
- Overhead 10-tonne gantry crane
- Storage rooms
- Open workspaces and Lunchroom
- All utilities (power, water, light)
- Internet/LAN connected
- Heating
- Propane line for gas cutting
- Fire hydrants, Security systems
Figure 18-25: Maintenance Garage

Figure 18-26: Maintenance Garage (interior)

18.12 Core Preparation Building
Nearby the Mine Operations Building is a diamond drill core preparation shed complete with drill core storage racks and core cutting room for diamond drilling core preparation. The building is 1,029 square feet in size.
The building is in excellent condition and contains:
- Core storage racks
- open workspace
- Core logging area
- Core preparation area
- Core cutting area
- Power and light utilities
- Security systems
Figure 18-27: Core Preparation Building

18.13 Core Storage Building
Nearby the Core Storage Building is a large 29.5m x 16.7m (14,878 square feet) dome building used for drill core storage and the temporary storage of various site services equipment. The building is in good working condition and will be converted to an additional mobile equipment workshop.
A new drill core storage yard will be constructed at a nearby location.
Figure 18-28: Core Storage Building

Figure 18-29: Core Storage Building (interior)

18.14 Proposed Additional Mobile Fleet Workshops
The existing Dome Core Shack structure (on a concrete pad) will be utilized as a mobile fleet workshop and warehouse for medium to large mining equipment (Mobile Maintenance Workshop 1). The building currently has power and is well located to the mining equipment "GO-LINE" and other equipment support maintenance and supervisory needs. ScoZinc has planned that the mining equipment supplier will manage the maintenance of mobile mining equipment in this facility.
An additional parallel Dome structured workshop (Mobile Maintenance Workshop 2) will be built during the first year of operations to increase the number of covered bays for mobile equipment maintenance. Due to the mobile equipment scheduled maintenance hours in the first two years of operation, the demand on mobile equipment maintenance will be considerably less that in later years as the mining equipment ages and requires progressively more maintenance hours to maintain performance levels.
The containers that form the foundation of the Dome Structures also have the advantage for use as workspaces, lubrication supplies storage, maintenance offices, and equipment parts storage. Propane powered gas heaters will provide some comfort to maintenance personnel as necessary.
The Mobile Mining Fleet Workshops will be initially managed by the mining equipment supplier under a MARC service contract, and contain the following:
- spare parts storage inventory
- parts warehouse
- tool bay
- Utilities (power, propane, water)

Figure 18-30: Sample Dome Structure
18.15 Mill Processing Building
The existing Mill Building is a large 4-level 73,298 square foot building built of both cavity-filled concrete block and steel cladding. The building houses all the processing equipment and mill operations support offices. The building requires some minor upgrades to offices and some facilities, but contains the following:
- Supervisory and technical support offices
- Crushing, Grinding, Flotation, Concentrate filtering and loading equipment
- Sample preparation laboratory
- Metallurgical laboratory
- Motor Control Centers
- Steam Analyser System
- Grinding media and Reagent storage
- 4 levels of steel and concrete work decks
- Dust extraction units
- Storage rooms with roller door access
- Change rooms including bathrooms and showers
- Shift offices
- Open workspaces
- Lunchroom
- Medical room
- Safety and training room
- All utilities (power, water, light)
- WIFI, Internet, & LAN connected

Figure 18-31: Existing Mill Processing Building – South Side Exterior View
Figure 18-32: Existing Mill Processing Building – North Side Exterior View

Figure 18-33: Existing Mill Fine-Ore-Bin (Silo)

The Mill Processing Building will be expanded with the addition of the following proposed new equipment:
- ROM based primary crusher and conveying system
- Concentrate Container Handling building
- Concentrate Container Yard

Figure 18-34: Proposed Additions to Mill Process Building
Inside the Mill Processing Building, ScoZinc has the following:
- Motor Control Centre (8 Mega Watt system)
- Crushing Area including conveyors, chutes, cone crusher
- Grinding Area including Rod Mill, Ball Mills, Cyclones, pumps
- Flotation Area including Denver flotation tanks, pumps and reagents, and 3t overhead gantry crane
- Thickener Area including a large zinc thickener tank and lead thickener tank
- Concentrate drying area
- Concentrate loadout building
- Control rooms
- Offices
- Metallurgical laboratories (dry and wet)
- Sample preparation laboratory
- Maintenance and storage bays
- Overhead gantry cranes (10t and 3t)
Figure 18-35: Crushing Circuit

Figure 18-36: Grinding Circuit

Figure 18-37: Flotation Circuit

Figure 18-38: Zinc thickener tank


Figure 18-40: Concentrate Loadout Area

Figure 18-41: Control Room

Figure 18-42: Reagent tanks


Figure 18-43: Wet Metallurgical laboratory
Figure 18-44: Dry Metallurgical laboratory


Figure 18-45: Large Main Deck Maintenance Bay
Figure 18-46: Large Ground Floor Maintenance Bays

18.16 Tailings Storage Facility
The existing tailings storage facility ("TSF") consists of a valley filled tailings depository beach, a tailings dam causeway, tailings pond, decant tower to a large polishing pond.
The TSF is a valley-fill storage method, which poses a very low risk of failure. The completed tailings beach is also progressively encapsulated with mine rock as part of the main waste rock storage dump.
The TSF permitted design capacity is 10 million tonnes, of which only 2 million tonnes have been deposited in the past. The Scotia Mine processing operations will fill the remaining capacity of the TSF in year 8, after which ScoZinc intends to deposit the remainder of the tailings for the mine life in the mined out main pit. ScoZinc considers that such in-pit tailings disposal are a more effective and low risk method of tailings disposal, which also allows early reclamation works on the TSF from year 8 onwards.
ScoZinc intends to submits its plans for approval to the appropriate government agency once detailed engineering has been performed.

Figure 18-47: Tailings Storage Facility

Figure 18-48: Tailings Storage Facility Decant Tower
Figure 18-49: Tailings Storage Facility Causeway

18.17 Fuel Storage
The mine site currently has one 45,722 litre diesel fuel tank and one 4,546 litre gasoline fuel tank on site. This fuel farm will be utilized for mining operations and site services. The self containment systems for both tanks currently meet the Canadian Environmental regulations.
Imperial Oil have proposed to provide fuel to the mine site in conjunction with ESSO. ESSO will be providing fuel to ScoZinc's storage tanks, plus fuel directly to the Mobile mining fleet. ScoZinc will also utilize a lubrication truck to service certain heavy mobile equipment that does not regularly access the mobile equipment workshops.

Figure 18-50: Diesel Fuel Farm
18.18 Cold Warehouses & Storage Yard
The Scotia Mine has an unheated Warehouse and fenced storage yard, designed to store various supplies in a separate secured area. Processing reagents will be stored as needed in the warehouse, with the yard used primarily for the storage of electrical equipment such as cables and spare transformers.
The building is fitted with exhaust fans and is fully operational, although some surface corrosion to the exterior of the building and roof skylights requires some minor maintenance work. The building is 4,654 square feet in size.
ScoZinc also has an additional 3,600 square foot workshop which is use for light vehicle repairs and part storage.

Figure 18-51: Cold Warehouse and Storage Yard
18.19 Sewerage Treatment
The existing sewerage treatment plant consists of several steel-concrete and fibre-glass underground storage and processing tanks with both gravity fed and submersible pumping and control systems installed.
The system is currently in use and fully operational with check values and electronic level alarm systems.

Figure 18-52: Underground Sewerage Treatment System
Figure 18-53: Effluent Treatment System – Septic leach field

18.20 Garbage Disposal
Suitably trained members of the site work force will collect garbage from bins at the work sites and deal with it as follows:
- Food waste: dumped at designated location on site
- Combustible scrap: stored in designated containers for disposal by external contractors
- Non-combustible scrap: stored in designated areas for collection external recycling contractors
- Hazardous waste: stored in designated containers for disposal by external contractors
18.21 Mill Process Control Systems
ScoZinc has an extensive system of instrumentation and control technology in the mill, which was last upgraded in 2008. However, additional upgrades to the process control systems are planned both during the recommission processes and as ongoing modernization of the mill.
ScoZinc's general control system philosophy has been developed to include descriptions of the process, the existing process control equipment, the new process control equipment to be installed for a 2,700 t/d processing throughput.
18.22 Crushing Circuit
The run-of-mine ("ROM") ore is stockpiled at the plant site in 4 mineralized ore classes. The ore is fed by reardump haul truck or Front-End Loader ("FEL") onto a fixed grizzly immediately before a primary crusher bin and primary jaw crusher. The grizzly bars are designed to prevent rocks above 800 mm in size from reaching the jaw crusher. Direct dumping by haul truck is the predominate method of ore feed in order to lower re-handling costs and to ensure optimal head grades and throughputs are achieved. Any oversize ore will be ejected from the grizzly for secondary breakage using an excavator-mounted rock breaker. An electromagnet will remove the bulk of any ore feed which is contaminated by steel that is mined from the old underground mining areas in the main zone and southwestern extension.
From the primary crusher, ore size is reduced to at least 300 mm in size, after which a variable speed conveyor feeds the crushed material to a secondary conical crusher which reduces the passing size to 100 millimetres. Ore is then transferred via conveyors to a double deck vibrating screen, with 33 mm oversize reporting to a tertiary cone crusher. Undersize ore from the screen is conveyed directly to the 4,000 t concrete fine ore bin. The crushing circuit is designed to process to 3,000 tonnes per day.
Ore is drawn from the fine ore bin ("FOB") via two variable speed vibrating feed conveyors, and then transferred to the grinding circuit. The FOB will have new cut-off gates for maintenance purposes, and increased air canons, to control ore levels in the bin.
18.23 Grinding Circuit
The grinding circuit is comprised of a rod mill in open circuit and two ball mills in closed circuit with cyclones operating on two separate grade range slurry streams. Ore from the FOB is fed directly into the rod mill, which has a design throughput capacity of up to 2,800 t/d. All ore is wet ground in the grinding circuit, with the primary feed slurry pumped to a cyclone feed sump which also is fed with the discharge of the two ball mills. The rod mill feed weightometer is used to control the speed of the ore feeders on the fine ore bin to maintain the required feedrate. Water addition to the rod mill is ratio controlled to the feedrage
The cyclones classify the primary feed slurry to produce a P80 of 110 μm in the overflow. The coarse underflow flows to the two ball mills, operating in parallel, where it is reground before transferred to the flotation circuit. Water addition to the cyclone feed pumpboxes is adjusted to maintain the required slurry level and to maintain the cyclone feed density.
18.24 Flotation Circuit
The flotation circuit consists of two flotation methods designed to separate zinc and lead slurries, and then maximize the recovery of the individual zinc and lead slurries. ScoZinc will utilize a Jameson Cell to provide additional zinc separation efficiencies, thereby increasing the zinc recovery in the plant.
Lead Flotation
The lead flotation reagents are added to the primary cyclone overflow slurry which is then conditioned in an agitated conditioning tank. The overflow from the tank flows through a bank of lead rougher flotation cells where the lead concentrate is floated. The concentrate is then pumped to a bank of cleaner cells where a final Lead concentrate is floated. The tailings from the rougher flows to a scavenger bank where Lead concentrate is also floated. This concentrate is recycled to the feed of the rougher bank to be upgraded. The tailings from both the Lead scavenger and the Lead cleaner flotation slurries are pumped to the Zinc circuit.
Reagent addition rates are maintained at flowrates determined to provide the required addition rates. Metal grades from the on stream analyzer are used to adjust reagent rates to maintain concentrate grades and recoveries.
Froth levels in the flotation cells are measured manually. Air addition rates are adjusted manually to maintain desired froth depths and concentrate production. Slurry levels in the flotation cells are measured manually and manual dart valves are adjusted to maintain the required slurry levels.
Zinc Flotation
The slurries from the Lead tailings are conditioned in two conditioning tanks which are in series. The overflow from the last tank flows through the new Jameson cell zinc concentrate is floated. The former lzinc rougher cells now function in scavenger duty. The concentrate is then pumped to a series of cleaner cells where the final Zn concentrate is floated. The cleaning has 5 flotation stages and one cleaner/scavenger.
The tailings from the rougher flows to a scavenger bank where Zinc concentrate is floated. This concentrate is recycled to the Zinc conditioners. The tailings from the scavenger flow to a 2nd scavenger bank where the concentrate is recycled back to the feed of the 1st scavenger bank. The tailings from the 2nd scavenger are pumped to the tailings pond together with the tailings from the cleaner/scavenger.
Reagent addition rates are maintained at flowrates determined to provide the required addition rates. Metal grades from the on stream analyzer are used to adjust reagent rates to maintain concentrate grades and recoveries.
Froth levels in the flotation cells are measured manually. Air addition rates are adjusted manually to maintain desired froth depths and concentrate production. Slurry levels in the flotation cells are measured manually and manual dart valves are adjusted to maintain the required slurry levels.
18.24.1 Concentrate Dewatering Circuit
The final Zinc concentrate is pumped to a large Zinc thickener tank where the slurry is thickened to approximate 60% solids. The underflow is pumped to a surge tank which feeds a pressure filter. The filter press dewaters the concentrate to approximate 8% moisture. The filter cake drops into a Zinc concentrate surge bin and then conveyed directly into a line 20' shipping container. Each container is then sampled, weighed, and sealed for loading and transport to the concentrate buyer.
The final Lead concentrate is pumped to a Lead thickener where the slurry is thickened to approximate 70% solids. The underflow is pumped to a surge tank which feeds a pressure filter. The filter press dewaters the lead concentrate to approximately 6% moisture. The filter cake drops into a Lead concentrate surge bin and then conveyed directly into a line 20' shipping container. Each container is then sampled, weighed, and sealed for loading and transport to the concentrate buyer.
18.25 Concentrate Loading & Transport
After loaded concentrate container is sampled, weighed, and sealed, ScoZinc will manage a concentrate container handling facility using devoted container handlers to receive and prepare empty 20' shipping containers, and then position each container each container in the zinc or lead loading areas.
ScoZinc intends also transport the containers via road to the Fairview Container Terminal located in Halifax, or alternatively to a nearby Canadian National Railway siding located 11 kilometres from the Scotia mine gate.
18.26 Tailings
The tailings slurry from the flotation circuit are pumped to the tailings storage facility pond where the tailings are settled out using a beaching deposition method. The supernatant water is discharged to a polishing pond and monitored. Water discharged to the environment or pumped back to a process water reservoir if needed.
18.27 Power
ScoZinc has an 8 mega-Watt Motor Control Centre ("MCC") to distribution electrical power throughout the plant. It is expected that some of the MCC panels will need upgrading to ensure reliability during operations. Power to the MCC is provided by Nova Scotia's transmission and distribution system, which provides reliable grid-power to the Scotia Mine. ScoZinc also has a backup diesel generator for essential processing functions. Some of the MCC units contain soft-starter systems.


Courtesy of NS Power
18.28 Air
ScoZinc has a number of high-capacity air blowers used in the flotation circuit. Air compressors are also used in the mill for the dewatering circuit, general plant equipment and FOB canons, instrumentation and operational maintenance.
18.29 Water
Process water for the plant is primarily supplied via a process reservoir. The reservoir is designed to provide up to 5,000 litres of non-recycled water supplied from the mining operations pit perimeter wells. Additional water is available from the Polishing Pond. Fire suppression for the plant is provided by the Water Treatment plant, which sources its water from the Gays River.
18.30 Existing Control Systems
The existing plant control system consists of three conventional control panels:
- Crushing Circuit control panel located near the secondary/tertiary crushers;
- Grinding Circuit control panel located adjacent to the rod and ball mills; and
- Flotation Circuit control panel located in the central control room.
The control panels are equipped with conventional - and out-dated - alarm annunciators, panel mount indicators and controllers, start/stop push buttons that are hard wired into the MCC starters for the starting and stopping of the relevant drives, as well as drive 'running' indication lights.
18.31 Additional Control Systems & Upgrades
Additional plant control system panels will include:
- Primary Crushing Circuit control panel located near new primary crusher on the ROM
- Concentrate Dewatering Circuit control panel located adjacent to new filter presses
- Concentrate Load out Circuit control panel located Load out room
All new control panels will be fitted with conventional alarm annunciators, panel mount indicators and controllers, start/stop push buttons that are hard wired into the MCC starters for the starting and stopping of the relevant drives, as well as drive 'running' indication lights.
ScoZinc intends to progressively upgrade the primary control circuits with a Supervisory Control and Data Acquisition ("SCADA") control system.
18.32 Fire Detection and Fire Suppression Systems
ScoZinc has an industrial fire detection and suppression ring system installed on all buildings on site, including the mill processing building, warehouse, workshop and administration buildings. Fire truck access points are also located throughout the complex.
The existing main control panel is located in the Water Treatment Plant. Portable fire extinguishers are also distributed throughout site, as well as exit and evacuation signage and muster points.
Water for fire suppression is drawn from ScoZinc's Gay's River pumphouse to the water treatment facility. A water-ring mains is installed around the mill and buildings. The fire suppression system operates as a wet system powered by electricity, with a backup diesel generator. These systems are in a care & maintenance state, but would require minor maintenance and upgrades to become operational.
For the Mill's Motor Control Centre ("MCC"), an industrial Halon automatic fire suppression system. The system consists of a number Halon tanks and is relatively new and unused.
The fire detection and suppression facilities are presently as follows:
- Administration Building
- Technical Services and Operations Building
- Warehouse
- Site Workshop
- Mill motor control centres ("MCC")
Mill Building including offices, laboratories, crushing area, grinding area, flotation cells, concentrate filtration area, concentrate load out facility.
Water Treatment Plant
Portable handheld extinguishers (Carbon Dioxide & ABC Powder) are located throughout the buildings according to the type of extinguisher required for each location.
18.33 Explosives
An external explosives contractor will provide and manage all explosives stored on site with the use of a devoted magazine storage yard.
Much of the explosive products to be used on site for blasting activities will be delivered to site on a daily basis from the contractor's off-site storage area. ScoZinc's expects that no explosives will be stored on site as has been the practice in the past.
18.34 Mine Services
ScoZinc has a network of services providing support to the mining operation. Much of the existing services are in good condition and only require minor upgrades and adjustments. Such existing services include the following:
- Access ramps and roads
- Technical services to mining operations
- Power supply distribution to existing dewatering wells
- Water supply standpipes for dust suppression
- Communication systems throughout the site via VHF and mobile services
- Fuel dispensing bowsers for diesel and gasoline equipment
ScoZinc also intends to upgrade and modernize the following services:
- Power supply distribution to new pit perimeter dewatering wells
- Communication systems and signage
- Diesel fuel dispensing systems
- Access roads
- Future staging areas
- Additional work areas
Some minor road development will be required during normal pit mining sequences. Such development includes additional haulage roads, waste dump ramps, and stockpile areas.
Towards the end of the mine life, additional mining will require temporary river crossings and highway crossings. All construction costs have been included in the future operating costs of the operations development.
18.35 Site Emergency Services & Rescue
As all of ScoZinc's operations are on surface, emergency services and personnel rescue are configured to address normal open-pit emergency requirements. The Scotia Mine has currently established a First Aide facility and rescue equipment including:
- First Aide Treatment room
- First Aide equipment including stretchers, bandages and basic emergency equipment
- First Aide Kits throughout the site
ScoZinc's operational plan includes a minor improvement of the First Aide Facility with modern emergency equipment and a new ambulance.
A mine site safety awareness program is also planned for implementation across site, based on the "Safety First" best practices.
18.36 Mobile Mining Equipment
ScoZinc plans to purchase or lease-to-purchase its mobile mining equipment. A number of mining equipment suppliers are available in Nova Scotia, who have provided equipment proposals for the basis of executing the mine plan.
In addition, ScoZinc has a small existing fleet of site services equipment including lighting plants, mobile pumps, light vehicles and associated support equipment. Additional modern equipment needs have been included in both the capital and operating costs of the project for the life of mine.
The mobile equipment fleet required for the operation and maintenance of all the surface facility areas (including the access ways) is listed in Table 18-2.
| Number of Units | ||||||
|---|---|---|---|---|---|---|
| Equipment | Capital | Operations | ||||
| Komatsu PC1250LC Excavator | 0 | 2 | ||||
| Komatsu PC490 Excavator w/Hydraulic Hammer | 0 | 1 | ||||
| CAT320 Excavator | 1 | 0 | ||||
| Komatsu HD605 Rigid Frame Haul Truck | 0 | 4 | ||||
| Komatsu HM400 Articulated Haul Truck | 0 | 5 | ||||
| Komatsu WA600 Wheel Loader | 0 | 2 | ||||
| Komatsu WA500 Wheel Loader | 0 | 1 | ||||
| Komatsu D155AX Dozer | 0 | 2 | ||||
| CAT16M Grader | 1 | 0 | ||||
| Komatsu HM400-5 Water Truck | 0 | 1 |
Table 18-2: Mobile mining equipment Fleet Requirements
18.37 Water Management System
The main sources of water on site include the nearby Gays River, year-round precipitation (snow & rain), snow melt, mine pit water, and pit dewatering wells.
The Scotia Mine has a well established water storage & discharge system, which includes existing and operational storm water ponds, holding dams, a finishing pond, controlled weirs, drainage ditches, and a 18" HDPE pipe and pumping network in order to manage all sources of water on the mine site. The water storage & discharge system is currently in use and is fully operational.
Water from the Gays River water is drawn using ScoZinc pumping facilities via a 320 gallons per minute (1200 litres per minute) pump and an 8" supply line to the treatment and holding tanks on site. From these storage tanks, potable water is pumped to various locations on site including washrooms, lunchrooms, eye wash stations, and fire suppression purposes. Grey water is pumped to the sewerage treatment tanks and then to a leach field. Solid waste is collected in large concrete underground sewerage tanks and pumped out for disposal off site by contractor services on an as required basis.
Precipitation and water runoff is channelled on site with a range of drainage ditches to one of a number of storm water and settling ponds, the tailings dam and polishing pond. The size of the tailings pond and polishing pond offers a relatively long residence time for any solids to settle out. All water is monitored before and after discharging off site to the Gays River via a controlled weir from the polishing (or finishing) pond.
Mine pit water, which is assumed to be contaminated, will be pumped to the tailings pond for settlement.
Pit dewatering wells (non-contaminated water) located at the perimeter of the open pits will primarily pump water to the mill for use as clean processing water. Any excess water will be pumped to the tailings pond or settlement ponds.
Mill process tailings (contaminated) is pumped to the tailings pond for settlement. If there is a shortage of clean pit dewatering water, water from either ScoZinc's Gays River pumping station, or the Polishing Pond pumping station, is capable of pumping additional water to the mill. Water pumped back from the Polishing Pond is considered recycled water.
To minimize the potential for a 1-in-100 year spring flood of the main pit during excavation, a large berm wall armoured with rip-rap will be constructed between the Gays River and the pit limit where required. Although the Gays River has a normal low flow, with virtually no water flow in summer, this berm will significantly minimise the risk of pit flooding during early spring when the water levels are 1 or 2 metres higher for short periods of time.
ScoZinc is also aware that the Gays River is locally hydraulically connected to the deeper portions of the main pit, necessitating that water levels in the Gays River be monitored. The Scotia Mine's polishing pond weir has the ability to increase or decrease the amount of water in the Gays River to ensure that the river does not dry out as a consequence of mining operations dewatering activities. ScoZinc is also installing additional pit perimeter dewatering wells on the northern limits of the pits, which after settling and water monitoring, may be able to be discharged directly to the Gays River to assist in maintaining the minimum water flow rate as determined by ScoZinc's environmental approvals.

Figure 18-55: Water Supply and Distribution Systems Flow Sheet
Figure 18-56: Tailings Storage Pond

Figure 18-57: Polishing Pond

Figure 18-58: Discharge Weir

Figure 18-59: Storm Water Pond

18.38 Waste Storage Facilities
Waste rock from the open pits over the life of the mine will be continued to be stored on the mine site in waste storage facilities comprised of rock dumps and back fill dumps into mined out areas.
The waste rock storage facility (or Waste Dump) is located adjacent to the tailings pond, such that any runoff has a natural path to the tailings pond on the east side.

Figure 18-60: Waste Dump (2017)
The figures below show design views of the waste rock storage facilities (prior to rehabilitation).
Other than the one waste dump, all other waste rock is schedule to be progressively dumped back into the mine out areas of the open pits.
The waste dump is to be contoured and revegetated in accordance with the Environmental Rehabilitation (or Closure) plans approved by the Nova Scotia Department of Environment. ScoZinc has budgeted for progressive reclamation measures in is operational plans.

Figure 18-61: Waste Rock Storage - Waste Dump design
18.39 Laydown Areas
The Scotia Mine has ample space for laydown areas adjacent to the mill building and the proposed new mine workshop and mining equipment start (or "GO") line.
Figure 18-62: Laydown Area

Figure 18-63: Secondary Laydown Area (Proposed New Reservoir location)

18.40 Transportation
18.40.1 International Airport Access
The Scotia Mine is approximately 33 kilometres by sealed highway to the Halifax Stanfield International Airport ("YHZ"). The Stanfield airport typically offers non-stop flights to 21 cities in Canada plus flights to other European and US destinations.


18.40.2 Railway Access
The Scotia Mine is approximately 11 kilometres by sealed highway to the Canadian Main railway line at the nearby town of Milford, Nova Scotia. This mainline is in active by several users, including National Gypsum, which operates a large gypsum mine some 4 kilometres from ScoZinc.
The two sidings at Milford are currently in use by CN railway and a bulk materials company. ScoZinc would need to reach an agreement with either party to load concentrate containers using these conveniently located sidings on the main CN railway line.

Figure 18-66: Milford Railway Siding route from Scotia Mine
Figure 18-67: CN Milford Railway Siding

18.40.3 Highway Access Roads
ScoZinc has permanent all-season access via a highway network of sealed roads maintained by the Nova Scotia Provincial government.
Although certain portions of the highway network are restricted each year by spring weight limitations, several highways in the area are exempt from this restriction.
The Scotia Mine is located on an exempt highway, which allows for unrestricted year-round highway access. See figure below courtesy of the Nova Scotia Department of Transport and Infrastructure, showing that the Scotia Mine has unrestricted access (shown in green shaded roads).

Figure 18-68: Spring Weight Road Restrictions
18.40.4 Site Access Roads
From the mine gate at Highway 224, the mine access road is well built and in good condition for all season use. The road is maintained for speeds of up to 40 kph, including profiling and snow clearance as necessary.
ScoZinc maintains the road in winter with a conventional truck mounted plow to remove snow, but a ScoZinc grader will perform the duty during full-scale operations.
Figure 18-69: Mine Access Road

18.40.5 Bridge
ScoZinc has a dual-support pilon bridge at the mine gate to cross the Gays River. This two-way bridge is in good condition and was recently upgraded in 2019. ScoZinc may upgrade the bridge over the life of the mine, but considers the bridge currently capable of supporting the equipment to be brought to site for the mine's restart and all ongoing operations.
For very heavy loads, ScoZinc is considering a nearby natural seasonal ford crossing near to the location of the high voltage powerlines to site.
Figure 18-70: ScoZinc's Bridge

Figure 18-71: ScoZinc's Bridge & Highway Access

18.41 Logistics
As the Scotia Mine is located on a sealed highway within the Halifax Regional Municipality ("HRM"), site logistics for the mine is considered excellent.
From the mine gate, the following key business facilities are located approximately:
- 33 kilometres to the Halifax International Stanfield Airport
- 62 kilometres to Halifax downtown city centre
- 62 kilometres to the Fairview Cover Container Terminal
- 54 kilometres to the Burnside industrial area of Dartmouth in Halifax, is which supplies heavy mining equipment, and has metal works, ports and other industrial suppliers
18.41.1 Workforce hours
The majority of the Scotia Mine's workforce will work on two 12 hour shifts, 365 days per year. Four roster teams are planned to operate on this basis across all operations departments.
Administrative staff will work Monday to Friday, for a minimum of 10 hours per day.
It is expected that the majority of personnel will reside within a short commute of the Scotia Mine.
18.41.2 Inbound Freight
Highway access to the mine gate and mine site is available all year round. The Scotia Mine is located on a seasonally unrestricted highway. ScoZinc therefore anticipates no issues for the bulk of all inbound freight.
For freight arriving to the mine site, a large car park and transport truck access road is currently in place. Once the freight has cleared entry procedures, truck drivers are escorted by logistics receiving and/or security personnel to unload their freight. The Scotia Mine has several receiving yards and areas, including the main warehouse.
Modern receiving and tracking inventory controls are planned to be in place and managed by logistics and warehouse personnel.
The bulk of the inbound freight will consist of diesel fuel, spare parts, equipment, mining consumables, mill consumables, processing reagents, concentrate shipping containers, and general supplies to support the operation.
18.41.3 Outbound Concentrate
Over the life of the mine, the average annual concentrate production is approximately 30,000 tonnes (DMT) of Zinc and 14,000 tonnes (DMT) of Lead. Annual concentrate varies each year with peak outbound concentrate tonnes of 35,714 and 18,035 for Zinc and Lead respectively.
ScoZinc will be using standard 20' sea containers, with disposable liners, to store and transport all zinc and lead concentrates from the mine to the concentrate buyer. An onsite container handling facility has been designed for this purpose which eliminates considerable operational cost, re-handle requirements, insurance, risk, moisture, and concentrate losses of the concentrate sale process. The sealed containers will also ensure that the concentrate does not attract additional moisture during the transportation process, thereby providing strong moisture controls to the concentrate quality.

Figure 18-72: Container Handling Facility
Once concentrate for either zinc or lead is deposited into their respective lined containers, representative samples will be taken for assay sampling and quality control purposes. Containers will then be weighed on site and sealed by customs officers. ScoZinc's flat-bed highway trucks will then transport 20-tonne payload 20' containers to one of several container handling ports in Halifax. All the ports are all year round, deep water seaports, connected directly through the Bedford Basin and Halifax sea ways to the Atlantic Ocean.
The weighbridge is in good condition, but will require some technological upgrades.
Figure 18-73: Onsite container weighbridge

ScoZinc has planned to initially use the Fairview Cover Container Terminal ("Fairview Cove") which is located 62 kilometres from the mine gate by the Provincial highway network direct from the mine site. Fairview Cove's own shipping brokers and operators will coordinate the concentrate receiving and shipping handling process to ensure low-cost efficient delivery to ScoZinc's concentrate buyer.
ScoZinc will load and transport from the mine to Fairview Cove approximately 28 containers of Zinc per week, and 14 containers of Lead per week. This equates to a total of 38 containers per week, or up to 8 containers per day 5 days a week. For a 125 kilometre round-trip journey taking approximately 1.5 hours, ScoZinc has estimated that a Monday to Friday day-shift operation is all that is needed for one transport truck. Additional flexibility can be provided for 6-day a week transport, or additional daily transport with a second container transport truck and driver.

Figure 18-74: Fairview Cover Container Terminal route from the Scotia Mine
Ocean going container vessels will regularly transport ScoZinc's concentrate to the buyer's port of choice. It is expected that ScoZinc will receive payment for the concentrate on delivery to either the Fairview Cover Container Terminal, or on delivery to the buyer's port of choice for smelting.

Figure 18-75: Fairview Cove Container Terminal
Although ScoZinc intends to deliver all of its concentrate by sea to its buyers, the Scotia Mine's location on an unrestricted Canadian highway network and proximity to the Canadian National Railway line provides a number of other alternatives for outbound concentrate delivery.
By highway, the Port of Montreal is approximately 1,200 kilometres from the mine site.
Rail transport facilities have also been used for concentrate shipping. Two railway sidings are located in the town of Milford (Nova Scotia) 11 kilometers from the mine gate by all season roads. From the Milford siding, containers may be loaded on most rail trains and delivered to anywhere on the North American rail network including Montreal and Chicago for relatively low cost.
Figure 18-76: Nearby Milford Railway Siding

19 Market Studies and Contracts
19.1 Gypsum
19.1.1 Applications
Gypsum has many uses besides as wallboard. Gypsum can be turned into plaster (calcined) at relatively low heat, less than 200° C. Gypsum can be added to soil to enhance the porosity and add calcium and sulphur to the soil.
At the first Global GypSupply Conference in 2018the speakers discussed recycling, gypsum supply, flue gas gypsum. One speaker, Bernard Lekien called gypsum the 'wonder mineral' since it cannot burn, it is non-toxic, and it is infinitely recyclable (Lekien, 2018)
"In Europe 78% of gypsum use is by the plasterboard industry, 17% by the cement industry and 5% in agriculture. Gypsum demand is expected to grow by five times from 20Mt to 100Mt by 2050. At the same time, the EU is targeting a complete decarbonisation of power generation by 2050, even though some EU countries are heavily reliant on coal and lignite. Germany produces around 6.5Mt of the EU's annual approximately 18Mt of FGD gypsum each year. The German government started an Energy Policy Concept in 2010 in order to radically reduce greenhouse gas emissions by 2050. Although hard targets have already been missed, a target of 80-100% decarbonisation by 2050 should be achievable."(Joerg Demmich The first Global GypSupply Conference, 13-14 March 2018)
19.1.1.1 Wallboard
A principal application of gypsum from Nova Scotia has been as a feedstock for wallboard plants.
Robert Crangle, Jr. of the USGS writes that:
"Demand for gypsum depends principally agriculture, building plasters, the manufacture of portland cement, and wallboard products.
"The construction of wallboard manufacturing plants designed to use synthetic gypsum from coal flue gas desulfurization (FGD) units as feedstock has resulted in less mining of natural gypsum. The availability of inexpensive natural gas, however, has limited the additional construction of FGD units and, therefore, the use of synthetic gypsum in wallboard.
"Despite disruptions caused by the COVID-19 pandemic, the production of gypsum through the second quarter of 2020 was not affected." (Crangle, 2021)
The observation that there is a trend towards reduced supply of synthetic gypsum is also seen in the 2019 Minerals Production Report by the Government of Nova Scotia, which states
"The prospect of increased demand for natural gypsum is positive, as the gradual phasing out of coal-fired power plants will result in a reduction in the availability of synthetic gypsum in the marketplace. This trend has already begun to occur, with some gypsum wallboard plants having switched to natural gypsum due to a lack of locally-available synthetic gypsum." (Government of Nova Scotia, 2019)
19.1.1.2 Calcined Gypsum (Plaster of Paris)
Gypsum calcination is the process of heating the mineral to drive off free water plus one of the two crystalline water molecules. The reaction is CaSO4.2H2O + heat -. CaSO4.H2O (Gypsum is converted to hemihydrate). Calcination of gypsum requires grinding the raw gypsum stone to sand size and then heating the material in a rotating kiln to drive of the crystalline water.
Calcined gypsum has cementing properties. When water is added, the calcined gypsum recrystallizes and hardens. It is used to make fireproof coating over wood, for molds of toys, statues etc., and it has been used to stabilize backfill in some Australian mines. R. M. Anderson, and S. P. Pigdon discuss the strength of fill that was mixed with calcined gypsum. They found that the fill could attain strength of 1 MPa using around two to four times the amount of cement that they would normally use. (Anderson and Pigdon, 1998)
Calcined gypsum is also used to make cat litter; it is used as an absorbent for hydrocarbon spills and in agriculture.
19.1.1.3 Agriculture
Research into the uses of gypsum is being conducted at Ohio State and much of the information on agricultural benefits of the mineral described below is taken from talks given at the third annual Midwest Soil Improvement Symposium. The talks by the leading experts on the use of gypsum to improve soil structure reduce nutrient runoff and add important nutrients to the soil were recorded and can be downloaded from http://www.gypsoil.com/symposium.

Figure 19-1 A series of slides from the Midwest soil Improvement Symposium (accessed at http://www.gypsoil.com/symposium)
Gypsum as a soil stabilizer can make clay soils more permeable and more like soil, thus making them less likely to erode.
Clint Nester, one of the panel of experts states that:
"Calcium and magnesium react differently with clay. Calcium is a much larger particle and it can flocculate clays and make building pieces that are a good part of soil structure. Magnesium tends to disperse soil particles around it and peptize the soil. Together, they really affect how water can move through your clay soils.
"Gypsum is calcium sulfate and we use that on high magnesium soils to leach that small magnesium particle out of the soil. The sulfate is a double negative repelled by the soil and, as it moves down through the soil, it pulls the double positive magnesium with it.
"With this in mind, a two-inch rain can be a stress or a benefit depending on the soil structure. In heavy clay soils that are prevalent in many parts of the state, calcium and magnesium levels are important in developing good soil structure to minimize the stress and maximize the benefits of that rain. Nester wants to see 70% calcium and 12% to 15% magnesium in heavy clay soils."(Nester, 2013).
19.1.1.4 Potential Applications
Bruce (2013) reports that a new potential market for gypsum is as a material for 3D printing.
Gypsum that is ground to 20 μm and specially formulated to be load-bearing, conductive and insulating. Such a material could potentially be used to 'print' entire rooms. These custom-designed rooms could then be assembled 'Lego-style' to create an entire building. For architects, this idea opens up a whole range of aesthetic possibilities and has the potential to lower the cost of buildings by an estimated 20% (Bruce, 2013).
19.1.2 Demand and Pricing
Pricing data for the gypsum products are taken from posting by the United States Geological Survey commodity reports and postings on the web.
Consumer cat litter advertised on Amazon.com ranges in price from \$1.87/kg to \$4.54/kg. These prices at the sales desk, not at the mine gate. Plaster of Paris is sold by the tonne by a group in India and the price they offer converts to about \$C165/tonne.
The price would do indicate the value added to the raw calcined product which goes for about \$0.04/kg at the mine gate. Light weight half inch wallboard sells for \$1/kg of wallboard. At the mine gate gypsum is worth about \$C0.015/kg. Since wall board is less than half gypsum, this is quite a large value added. One can see the value of vertical integration of the gypsum industry.
| + | ||||||||||||||||
|---|---|---|---|---|---|---|---|---|---|---|---|---|---|---|---|---|
| YEAR | 2005 | 2006 | 2007 | 2008 | 2009 | 2010 | 2011 | 2012 | 2013 | 2014 | 2015 | 2016 | 2017 | 2018 | 2019 | 2020 |
| Production | ||||||||||||||||
| Crude | 21,100 | 21,100 | 17,900 | 14,400 | 9,400 | 9,000 | 9,770 | 14,800 | 12,900 | 11,000 | 11,500 | 19,800 | 20,700 | 21,100 | 21,200 | 22,000 |
| Synthetic | 8,690 | 9,290 | 8,500 | 7,740 | 7,700 | 7,500 | 11,800 | 12,100 | 10,800 | 11,000 | 11,500 | 16,700 | 20,700 | 16,600 | 14,400 | 13,000 |
| Calcined | 21,000 | 26,100 | 16,700 | 18,000 | 14,000 | 13,000 | 11,900 | 12,800 | 14,600 | 14,700 | 15,000 | 17,900 | 17,800 | 17,500 | 17,500 | 17,000 |
| Wallboard products sold (million | ||||||||||||||||
| square feet) | 28,700 | 35,000 | 27,800 | 20,700 | 18,500 | 17,700 | 17,200 | 18,900 | 21,800 | 21,500 | 22,000 | 24,400 | 25,000 | 23,700 | 25,200 | 26,000 |
| Wallboard products sold (million | ||||||||||||||||
| square metres) | 2666 | 3252 | 2583 | 1923 | 1719 | 1644 | 1598 | 1756 | 2025 | 1997 | 2044 | 2267 | 2323 | 2202 | 2341 | 2415 |
| Imports, including Anhydrite | 11,200 | 11,400 | 9,400 | 7,300 | 4,200 | 3,300 | 3,330 | 3,250 | 3,290 | 3,720 | 3,900 | 4,340 | 4,800 | 5,210 | 6,140 | 5,900 |
| Exports, crude, not ground or | ||||||||||||||||
| calcined | 148 | 143 | 147 | 149 | 120 | 360 | 316 | 408 | 142 | 67 | 60 | 43 | 36 | 36 | 37 | 32 |
| Consumption, apparent4 | 40,800 | 41,600 | 35,700 | 29,300 | 21,000 | 19,400 | 24,600 | 29,700 | 26,800 | 25,700 | 26,800 | 40,800 | 46,200 | 42,900 | 41,700 | 40,900 |
| Price: | ||||||||||||||||
| Average crude, f.o.b. mine, dollars | ||||||||||||||||
| per metric ton | \$7.48 | \$8.83 | \$7.50 | \$8.70 | \$8.50 | \$6.50 | \$8.20 | \$7.70 | \$9.00 | \$8.90 | \$9.00 | \$8.00 | \$7.50 | \$8.20 | \$8.60 | \$8.60 |
| Average calcined, f.o.b. plant, dollars | ||||||||||||||||
| per metric ton | \$37.18 | \$41.79 | \$38.30 | \$42.64 | \$40.00 | \$33.00 | \$28.70 | \$28.70 | \$27.60 | \$29.80 | \$30.00 | \$30.00 | \$30.00 | \$32.00 | \$35.00 | \$35.00 |
| Cdn \$ / US\$ | 1.6970 | 1.6080 | 1.6090 | 1.6090 | 1.6100 | 1.6114 | 1.6122 | 1.6130 | 1.6400 | 1.6500 | 1.6154 | 1.6160 | 1.6170 | 1.6180 | 1.6190 | 1.6190 |
| Average crude, f.o.b. mine, Canadian dollars per metric ton |
\$12.69 | \$14.20 | \$12.07 | \$14.00 | \$13.69 | \$10.47 | \$13.22 | \$12.42 | \$14.76 | \$14.69 | \$14.54 | \$12.93 | \$12.13 | \$13.27 | \$13.92 | \$13.92 |
| Average calcined, f.o.b. plant, | ||||||||||||||||
| Canadian dollars per metric ton | \$63.09 | \$67.20 | \$61.62 | \$68.61 | \$64.40 | \$53.18 | \$46.27 | \$46.29 | \$45.26 | \$49.17 | \$48.46 | \$48.48 | \$48.51 | \$51.78 | \$56.67 | \$56.67 |
| Employment, mine and calcining | ||||||||||||||||
| plant, number | 5,900 | 5,900 | 6,000 | 5,400 | 4,500 | 4,500 | 4,500 | 4,500 | 4,500 | 4,500 | 4,500 | 4,500 | 4,500 | 4,500 | 4,500 | 4,500 |
| Net import reliance as a percentage of | ||||||||||||||||
| apparent consumption | 27 | 27 | 26 | 24 | 19 | 15 | 12 | 10 | 11 | 14 | 14 | 11 | 10 | 12 | 15 | 14 |
Table 19-1: Gypsum and calcined gypsum price, 2005 - 2020 (USGS)
The USGS prepares commodity report summaries for mineral commodities each year. The table above was compiled from their reports for the years 2005 to 2020.


Figure 19-3 Historical Gypsum price in US\$ per metric tonne between 1900 and 2020.
19.2 Base Metals
The assumed long-term prices (LTP) of US\$1.35/lb and US\$1.14/lb for zinc and lead utilized in 2020 Technical Report are based on market forecasts compiled by Consensus Economics Inc. A 30% premium on the forecast prices for ore reserves is considered in deriving the LTP for mineral resource pricing.
Domestic Production and Use: The value of zinc mined in 2020, based on zinc contained in concentrate, was about \$1.6 billion. Zinc was mined in five States at 14 mines operated by five companies. Of the total reported zinc consumed, most was used in galvanizing, followed by brass and bronze, zinc-based alloys, and other uses.
Substitutes: Aluminum and plastics substitute for galvanized sheet in automobiles; aluminum alloys, cadmium, paint, and plastic coatings replace zinc coatings in other applications. Aluminum- and magnesium-base alloys are major competitors for zinc-based die casting alloys. Many elements are substitutes for zinc in chemical, electronic, and pigment uses.
It was estimated that the lead-acid battery industry accounted for about 92% of reported U.S. lead consumption during 2020. Lead-acid batteries were primarily used as starting-lighting-ignition (SLI) batteries for automobiles, as industrial-type batteries for standby power for computer and telecommunications networks, and for motive power. During the first 7 months of 2020, 73 million lead-acid automotive batteries were shipped by North American producers, essentially unchanged from those shipped in the same period of 2019.

Figure 19-4: Lead and Zinc, North American Producer price in \$US/pound.
| Table 19-2: Lead and Zinc, North American Producer price in \$US/pound. | |||||
|---|---|---|---|---|---|
| -- | -- | -- | ------------------------------------------------------------------------- | -- | -- |
| Year | 2012 | 2013 | 2014 | 2015 | 2016 | 2017 | 2018 | 2019 | 2020 |
|---|---|---|---|---|---|---|---|---|---|
| Lead | \$0.94 | \$0.97 | \$0.86 | \$0.97 | \$0.85 | \$1.05 | \$1.02 | \$0.91 | \$0.82 |
| Zinc | \$0.96 | \$0.96 | \$1.07 | \$0.96 | \$0.99 | \$1.39 | \$1.41 | \$1.24 | \$1.09 |
The price of lead quoted as the North American producer price in US\$/Lb. average \$1.05 and zinc averaged \$1.12/Lb. between 2012 and 2020.
Note: Item 19 from here on has no change from Previous NI43-101 Technical Report by Carew, et al, 2020
19.3 Market Studies
The principal commodities at the Scotia Mine are freely traded, at prices and terms that are widely known, so that prospects for sale of any production are virtually assured. Metal prices used in this study are based on longterm consensus forecasts by independent third parties, consultancies, investment banks and other financial institutions.
ScoZinc has several potential markets for concentrate sales. Historically, ScoZinc concentrate was sold to smelters in Europe, South Africa, and Asia through contracts with major trading companies. At that time (2007 to 2009), the Scotia Mine concentrates were deemed highly desirable by smelters due to their high concentrate quality, grading 57% Zn and 71% Pb, and low levels of deleterious metals. The zinc and lead to be mined over the current Life of Mine Plan (LOM), is from the same mineralized deposit as was mined during the period 2007 to 2009, and as such, the concentrate quality is expected to be the same or better due to improvements in the mill process plant: minimum 55% Zn and minimum 65% Pb.
| Company | Project | Location | Zinc Concentrate Grade (%) |
|---|---|---|---|
| ScoZinc Mining Ltd. | Scotia Mine | Canada | 55%-57% |
| Red River Resources Ltd. | Thalanga | Australia | 56.7% |
| Titan Mining Corp. |
Empire State Mines | USA | 56.0% |
| Trevali Mining Corp. | Perkoa | Burkina Faso | 52.8% |
| Heron Resources Ltd. | Woodlawn | Australia | 51.0% |
| Trevali Mining Corp. | Rosh Pinah | Namibia | 49.7% |
| Trevali Mining Corp. | Caribou | Canada | 47.6% |
| Table 19-3: Zinc Concentrate Grades: Scotia Mine vs. other Zinc Projects | |
|---|---|
| -------------------------------------------------------------------------- | -- |
Source: Company Technical Reports
These high-quality characteristics enable marketing of the ScoZinc concentrate at much more favorable terms than many other zinc and lead concentrate miners, as its purity is suitable for blending by smelters worldwide. When there are more deleterious or unwanted materials in the concentrate, the smelting process to extract metal is costlier and therefore some of these costs return to the miner in the form of additional discounts or penalties; in more extreme cases some, certain smelters or trading houses would refuse to take on concentrates that are "too deleterious".
Moreover, clean or high-quality concentrates are well sought by smelters worldwide, as they result in higher margins for the smelters, with some of these margins being transferred to the miners – ScoZinc – in the form of higher payments and lower or no penalties. ScoZinc expects to benefit from above average favorable smelting terms.
19.4 Concentrate Volumes and Quality
Historically, ScoZinc established multi-year concentrate purchase contacts with MRI Trading AG ("MRI") and Trafigura AG ("Trafigura") under terms consistent with the market terms at that time. The purchase contracts accounted for 100% of the zinc production and 100% of the lead production in which Trafigura and MRI each had the obligation to purchase 50% of the produced zinc concentrate. Trafigura also had the obligation to purchase 100% of the lead concentrate produced. In both cases, ScoZinc had obligation to sell its zinc and lead concentrate production under the established quantities and terms.
As per the April 3rd, 2018 news release ScoZinc entered into a Memorandum of Understanding ("MOU")/ strategic term sheet with MRI for life of mine offtake agreement for lead and zinc concentrates. This initial offtake agreement provides competitive terms for 333,000 wet metric tonnes ("wmt") of zinc concentrate and 133,000 wmt of lead concentrate from the Scotia Mine. As a side note, mine production is usually quoted in terms of wet metric tonnes ("wmt"), and the metal price is based on dry metric tonnes ("dmt").To adjust from wet to dry tonnes, an 8% reduction is applied to the wet tonnes to adjust for moisture content. It is important to understand whether something is being quoted in 'dmt' or 'wmt'.
ScoZinc expects to establish additional concentrate purchase contracts with one or more metal trading companies under terms consistent with the current market terms. ScoZinc is engaged in negotiations with a number of additional offtakers but has not yet finalized an arrangement. In addition, for more effective discussions, ScoZinc wanted to complete this Pre-Feasibility Study ("PFS") before advancing more detailed negotiations with other offtakers.
Treatment Charge and Refining Charge ("TC/RC") is a deduction from payable zinc and it represents theoretically what it takes to convert a tonne of concentrates into metal. These are market driven/ negotiated commercial terms and are charged by a refinery to a mine and constitutes revenue for a refiner and cost to a mine. Furthermore, the realized TC (Benchmark TC) is based on a different price basis each year and could be escalated or de-escalated based on the monthly average price. Conversely, Spot TC is continuously market negotiated and is typically not escalated/ de-escalated.
This PFS assumes that long-term treatment and refining charges (TC/ RC) will continue a downward trend for Year 1 and Year 2, followed by a gradual escalation as shown in the table below:
| Commodity | Year 1 | Year 2 | Year 3 | Rest of Mine Life |
|---|---|---|---|---|
| Zinc (US\$ per DMT) | \$200 | \$225 | \$250 | \$250 |
| Lead (US\$ per DMT) | \$170 | \$175 | \$190 | \$190 |
Table 19-4: Concentrate Treatment Charges
For the above Treatment Charge forecasts, ScoZinc has relied on market studies and published forecasts by independent consultants such as Wood Mackenzie Ltd., S&P Global Market Intelligence, Fastmarkets MB and Open Mineral AG. Open Minerals' one-month TC/RC expectation survey conducted in early April 2020 suggested that the industry, on average, expected terms at around US\$245 by the end of April (versus terms of over US\$315 less than two months before). According to Fastmarkets MB, in mid-March 2020, Teck agreed on TCs of US\$299.75 with Glencore, then Korea Zinc both with no scales. Furthermore, according to Open Mineral AG, by mid-May 2020, offtake deals have been concluded at less than UD\$140/tonne of concentrate.
The lead TCs have followed the same downward trajectory over the last few months: according to Fastmarkets MB, depending on the silver content on a concentrate sample, the lead concentrate TCs benchmarks, for March 2020, were between US\$170 (low silver) to US\$180 (high silver). For April 2020, the lead TCs were between US\$135 (low silver) to US\$150 (high silver content).
Scotia Mine's lead concentrate is a low silver content concentrate and hence ScoZinc should benefit from the lower expected TCs for our lead concentrate.
Against the backdrop of expected concentrate deficits during first half of 2020, it is likely that spot TCs can (and will likely) fall further and perhaps faster than expected, in the coming weeks.
As of mid-April 2020, as per the below graph from Open Mineral, the Zinc spot charges are falling at faster rates than they shot up in 2018 Q3/Q4. In addition, as a result of the COVID-19 pandemic in 2020 Q1/ Q2, the closure of zinc mines in Peru and other parts of the world is having a major impact on smelters in China and the Chinese zinc smelters are fighting to buy zinc concentrates as mine supply falls, which should result in lower TCs for the short to medium term.
ScoZinc's concentrates are deemed highly desirable by smelters due to their high concentrate quality, historically grading 57% Zn and 71% Pb, and low levels of deleterious metals. These characteristics translate into premium prices for paid metals and, coupled with the decreasing trend in the TCs, are expected to result in improved economics for the Scotia Mine.


The December 2019 updated Mineral Resource Estimate resulted in an increase in Measured & Indicated tonnage of 105% (to 25,450,000 tonnes at a Zinc equivalent grade of 2.84%) and an increase in Inferred tonnage of 7% (to 5,010,000 tonnes at a Zinc equivalent grade of 2.13%) from previous resource estimates on the deposit.
This updated Mineral Resource Estimate has led to this PFS which gives the Scotia Mine an economic study and therefore a Reserve Estimate as per the below:
The Scotia Mine Mineral Reserve Estimates are classified as either Proven Reserves or Probable Reserves and are provided Table 15.2. Total Mineral Reserves are 13,653,761 tonnes with a Zinc Equivalent grade of 3.09 percent. For more information, see Chapter 15 – Mineral Reserve Estimates.
| Mineral Zone | Classification | Tonnage (t) |
Zinc Grade (%) |
Lead Grade (%) |
Zinc Equivalent Grade (%) |
|---|---|---|---|---|---|
| Scotia Mine | Proven | 3,366,999 | 2.46 | 1.21 | 3.62 |
| Scotia Mine | Probable | 10,286,762 | 1.88 | 1.07 | 2.91 |
| Scotia Mine | Total | 13,653,761 | 2.02 | 1.10 | 3.09 |
| Table 19-5: Scotia Mine Mineral Reserve Estimates | ||||
|---|---|---|---|---|
| --------------------------------------------------- | -- | -- | -- | -- |
Notes: 2020 Mineral Reserves are as of 01 May 2020 and based on a design cut-off grade of 1.5% ZnEq grade. Cut-off grades are based on a Zinc metal price of US\$1.10/lb, recovery of 89%, a Lead metal price of US\$0.95/lb, and mining recovery of 92%. Average unplanned dilution and mining recovery factors of 12% and 92%, respectively, are assumed.
In terms of Payable Metal, it is expected that the final buyer will pay a percentage of the full zinc content, subject to a minimum deduction of units per dmt (dry metric tonnes), at the official LME Settlement quotation for Special High Grade Zinc, as published in the Metal Bulletin in London, averaged over the quotation period. The figure below shows the projected volumes of the two concentrates that will be produced at the Scotia Mine over the LOM.
Figure 19-6: Forecast LOM Concentrate Production

While the mill will utilize separate flotation circuits for lead and zinc, at this time it is anticipated that two types of concentrate will be shipped: a zinc concentrate and a lead concentrate.

Figure 19-7: Forecast Annual Production of Zinc Concentrate

Figure 19-8: Forecast Annual Production of Lead Concentrate
The annual variations in the volume of concentrate production are caused by a number of typical mining and processing production related factors that include:
- Tonnage feed available from the mine;
- The mill processing rate is constant, but it is expected to increase over the years with planned improvements;
- Variability in head-grades: later years are running lower zinc grades and have slightly lower zinc expected rates and higher lead grades (as per the mine plan and as described in more detail later in this chapter);
- The grades are affected by the mining areas and stockpiles.
According to the Life of Mine plan (or "LOM" plan), during the first 5 months of operations (the pre-production phase), ore will be stockpiled, after which the ore will be treated in the mill with the first expected concentrate sales within 4 to 6 weeks of concentrate production commencing (the production phase). In addition, the LOM plan is designed for the first 6 years to access mainly the high-grade ore.
The Mill crushing circuit has a nominal maximum throughput of 3,000 tonnes per day for the life of mine and the Mill grinding circuit has a nominal throughput capacity of 2,700 tonnes per day (or 83,700 tonnes per month average). ScoZinc has not forecast to increase these nominal capacities, although it is generally accepted that processing operation improvements and technological advances will enable increases over the mine's long operating life of 14 years.

Figure 19-9: Forecast Annual Concentrate Production
No deleterious minor elements are expected in the concentrates from the Scotia Mine. The concentrates have been proven to be readily marketable, given their clean high-grade nature. When there are more deleterious or unwanted materials in the concentrate, the smelting process to extract metal is costlier and therefore some of these costs return to the miner in the form of additional discounts or penalties; in more extreme cases some, certain smelters or trading houses would refuse to take on concentrates that are "too deleterious".
In contrast, clean or high-quality concentrates, are well sought by smelters worldwide, as they result in higher margins for the smelters, with a certain percentage of these margins being transferred to the miners – ScoZinc – in the form of higher payments and lower or no penalties. ScoZinc expects to benefit from above average favorable smelting terms.
The table below shows the anticipated average concentrate specifications for both zinc and lead concentrates.
| Mineral | Unit | Assay |
|---|---|---|
| Zinc | % | 58.06 |
| Lead | % | 1.43 |
| Sulphur | % | 28.86 |
| Cadmium | % | 0.38 |
| Iron | % | 0.34 |
| Magnesium Oxide | % | 1.18 |
| Arsenic | % | 0.02 |
| Copper | % | 0.07 |
| Silica | % | 0.75 |
| Calcium Oxide | % | 3.02 |
| Silver | g/t | 13 |
| Gold | g/t | 0.5 |
| Mercury | Ppm | <5 |
| Chlorine | Ppm | <50 |
| Fluorine | Ppm | 223 |
Table 19-6: Scotia Mine Historical Zinc Concentrate Specifications
Table 19-7: Scotia Mine Historical Lead Concentrate Specifications
| Mineral | Unit | Assay |
|---|---|---|
| Lead | % | 68.84 |
| Zinc | % | 7.60 |
| Silver | g/t | 31.4 |
| Iron | % | 0.24 |
| Sulphur | % | 12.4 |
| Silica | % | 0.64 |
| Magnesium Oxide | % | 0.81 |
| Copper | % | <0.01 |
| Aluminum Oxide |
% | 0.38 |
| Nickel | % | <0.01 |
| Arsenic | % | <0.01 |
| Bismuth | % | <0.01 |
| Antimony | % | 0.002 |
| Gold | g/t | 1.68 |
| Metal Production | Restart | Year 1 | Year 2 | Year 3 | Year 4 | Year 5 | Year 6 | Year 7 | Year 8 | Year 9 | Year 10 | Year 11 | Year 12 | Year 13 | Year 14 | TOTAL | |
|---|---|---|---|---|---|---|---|---|---|---|---|---|---|---|---|---|---|
| Total Mill Grind | tonnes | 0 | 970,500 | 985,500 | 985,500 | 988,200 | 985,500 | 985,500 | 985,500 | 988,200 | 985,500 | 985,500 | 985,500 | 988,200 | 985,500 | 849,161 13,653,761 | |
| Zinc Concentrate | tonnes | 0 | 33,903 | 34,327 | 31,330 | 31,294 | 35,714 | 35,785 | 29,635 | 29,716 | 29,635 | 26,612 | 28,115 | 28,040 | 22,728 | 20,311 | 417,144 |
| Lead Concentrate | tonnes | 0 | 7,461 | 10,696 | 8,104 | 9,953 | 14,732 | 17,210 | 16,279 | 15,072 | 18,035 | 18,248 | 12,349 | 14,495 | 16,356 | 15,014 | 194,004 |
| Zinc Recovery | percentage | 0.0% | 85.4% | 87.3% | 86.3% | 86.2% | 87.8% | 87.8% | 85.7% | 85.7% | 85.7% | 84.7% | 85.2% | 85.1% | 83.3% | 82.8% | |
| Lead Recovery | percentage | 0.0% | 87.8% | 89.3% | 88.1% | 88.9% | 91.1% | 92.2% | 91.8% | 91.2% | 92.5% | 92.6% | 90.0% | 91.0% | 91.8% | 91.9% | |
| Recovered Zinc | tonnes | 0 | 19,165 | 19,566 | 17,858 | 17,838 | 20,357 | 20,397 | 16,892 | 16,938 | 16,892 | 15,169 | 16,026 | 15,983 | 12,955 | 11,577 | 237,612 |
| Recovered Lead | tonnes | 0 | 5,252 | 7,594 | 5,754 | 7,066 | 10,460 | 12,219 | 11,558 | 10,701 | 12,805 | 12,956 | 8,768 | 10,291 | 11,613 | 10,660 | 137,698 |
| Zn Metal Payable from Smelter percentage | 85.0% | 85.0% | 85.0% | 85.0% | 85.0% | 85.0% | 85.0% | 85.0% | 85.0% | 85.0% | 85.0% | 85.0% | 85.0% | 85.0% | 85.0% | ||
| Pb metal Payable from Smelter percentage | 95.0% | 95.0% | 95.0% | 95.0% | 95.0% | 95.0% | 95.0% | 95.0% | 95.0% | 95.0% | 95.0% | 95.0% | 95.0% | 95.0% | 95.0% | ||
| Payable Zinc | pounds | 0 35,913,565 36,665,508 33,464,519 33,426,254 38,147,472 38,223,052 31,654,271 31,740,996 31,654,271 28,424,984 30,030,826 29,950,704 24,276,566 21,695,116 445,268,105 | |||||||||||||||
| Payable Lead | pounds | 0 10,999,854 15,905,653 12,051,222 14,799,865 21,907,125 25,591,225 24,206,862 22,411,600 26,818,554 27,135,145 18,363,071 21,554,146 24,321,622 22,326,395 288,392,337 | |||||||||||||||
| Payable Zinc | tonnes | 0 | 16,290 | 16,631 | 15,179 | 15,162 | 17,303 | 17,338 | 14,358 | 14,397 | 14,358 | 12,893 | 13,622 | 13,585 | 11,012 | 9,841 | 201,970 |
| Payable Lead | tonnes | 0 | 4,989 | 7,215 | 5,466 | 6,713 | 9,937 | 11,608 | 10,980 | 10,166 | 12,165 | 12,308 | 8,329 | 9,777 | 11,032 | 10,127 | 130,813 |
Table 19-8: Forecast variations in grades, recoveries and metal concentrate produced
According to the Life of Mine Plan (LOM), the mined zinc grades are constantly over 2% for the first 9 years, with the zinc grade dipping under 2% on Year 10, and with a slow decline in zinc grade for the next 5 years, with an expected life of mine end mined zinc grade of 1.63%. The expected mine lead grades are under 1% for the first 4 years of life of mine, with increased grades and constantly in the range of 1.18%-1.40% until Year 11 when grades briefly dip under 1% and finishing the last 3 years with mined grades between 1.14%-1.34%.
The same life of mine plan assumes zinc recoveries of 85% in Year 1, increasing slightly to 87.8% over the next 5 years, coming down to 85% on Years 7-9, 84.7% in Year 10, above 85% for the next two years and closing on Year 13 and Year 14 with expected zinc recoveries of 83% and 82% respectively. The zinc recovery is estimated at average 85.6% for LOM.
The lead recoveries as per the mine plan start at 87.8% in Year 1, they increase to 91% by Year 5 and stay above 90% mark for the rest of mine life (until Year 14). The lead recovery is estimated at average 90.7% for LOM.
Further references are made to Figure 3-3: Forecast Annual Production of Zinc Concentrate and Figure 3-4: Forecast Annual Production of Lead Concentrate.
19.5 Locked Cycle Test Results
The historical test work completed at ALS Metallurgy indicated that high recoveries of both zinc and lead can be expected from the material with high quality concentrates. A summary of the metallurgical performance of the ScoZinc mineralization, extracted from the ALS metallurgical report, is shown in table below:
| Mass | Assay - percent |
Distribution - | percent | ||||||||
|---|---|---|---|---|---|---|---|---|---|---|---|
| Product | (%) | Pb | Zn | Fe | Pb | Zn | Fe | ||||
| Test 9 – Cycles IV and V |
|||||||||||
| Flotation Feed | 100 | 1.83 | 2.46 | 0.9 | 100 | 100 | 100 | ||||
| Lead 2nd Clnr Con | 2.4 | 71.7 | 3.00 | 0.5 | 93.5 | 2.9 | 1.4 | ||||
| Zn 3rd Cleaner Con | 3.4 | 0.78 | 61.3 | 0.5 | 1.5 | 86.0 | 1.7 | ||||
| Zn 1st Cleaner Tail | 3.7 | 0.76 | 2.75 | 1.5 | 1.5 | 4.1 | 5.9 | ||||
| Zn Rougher Tail | 90.5 | 0.07 | 0.19 | 0.9 | 3.5 | 7.0 | 91.0 | ||||
| Test 10 – Cycles IV and V |
|||||||||||
| Flotation Feed | 100 | 1.82 | 2.44 | 1.0 | 100 | 100 | 100 | ||||
| Lead 2nd Clnr Con | 2.5 | 68.9 | 3.71 | 0.6 | 94.3 | 3.8 | 1.6 | ||||
| Zn 3rd Cleaner Con | 3.6 | 0.72 | 59.0 | 0.5 | 1.4 | 86.9 | 1.8 | ||||
| Zn 1st Cleaner Tail | 4.7 | 0.40 | 1.82 | 1.3 | 1.1 | 3.5 | 6.6 | ||||
| Zn Rougher Tail | 89.2 | 0.06 | 0.16 | 1.0 | 3.2 | 5.8 | 90.0 |
Table 19-9: Scotia Mine Metallurgical Performance Analysis
19.6 Offtake Agreements
On April 3rd, 2018, ScoZinc has signed a Memorandum of Understanding ("MOU") with MRI Trading AG for the sale of zinc and lead concentrates. The MOU sets out the intentions of ScoZinc and of MRI Trading AG ("MRI") to enter into concentrate sales agreements for life of mine 333,000 wet metric tonnes ("wmt") of zinc concentrate and 133,000 wet metric tonnes of lead concentrate from the Scotia Mine, under standard commercial terms, which are to be kept confidential. As a side note, mine production is usually quoted in terms of wmt, and the metal price is based on dry metric tonnes ("dmt").To adjust from wet to dry tonnes, an 8% reduction is applied to the wet tonnes to adjust for moisture content. It is important to understand whether something is being quoted in 'dmt' or 'wmt'.
Material payability terms have been assumed as follows:
- Zinc Concentrate:
- o Zinc payable: 85% minimum deduction 8 units.
- Lead Concentrate:
- o Lead payable: 95% minimum deduction 3 units.
ScoZinc expects to establish additional concentrate purchase contracts with one or more metal trading companies under terms consistent with the current market terms. ScoZinc is engaged in negotiations with a number of additional off-takers but has not yet finalized an arrangement. ScoZinc is aiming to get the same of better commercial terms for the portion of its production which is not already covered by the MRI Trading MOU (i.e. better payment terms, better delivery options, faster payment on delivery, etc.)
This offtake arrangement with one of the pre-eminent trading houses in the world, confirms the marketability of Scotia Mine's zinc and lead concentrates.
MRI Trading AG is a leader in trading, metals and minerals, petroleum products, bulk and freight. MRI specializes in non-ferrous ores, concentrates, refined and precious metals and their related by-products for a global smelting and processing customer base. Petroleum products integrate with the group's strength in the mining sector and considerable expertise in stock management. MRI offers services including strategic mine equity investment, pre-export finance, structured commodity and project finance and risk management.
Built upon detailed market intelligence, over 20 years of success, with offices in 10 countries around the globe, MRI's aim is to continue to grow with honesty and integrity proving to be an ethical and reliable partner. A strong balance sheet, corporate backing, a wealth of local and international knowledge, along with an experienced management team and entrepreneurial culture allows MRI to provide excellent service to its global client base.
MRI's main contracting centres are located in Zug, Switzerland and Singapore, with local and representative offices located in Santiago, Chile; Lima, Peru; Mexico City, Mexico; Johannesburg, RSA; Melbourne, Australia; Beijing and Shanghai, PRC; Vancouver, Canada; and Seoul, South Korea.
The current MOU with MRI Trading provides that treatment charges be set annually at the annual benchmark treatment charges and scales, as agreed between major smelters and major miners. Payables, penalties and quotation periods will be negotiated in good faith annually, including industry standard penalties based on indicative terms and agreed limits specified in each MOU. As discussed before, the ScoZinc concentrate is of high-quality and high purity, with limited deleterious material, well sought by smelter worldwide and, therefore, with fewer expected penalties and discounts.
ScoZinc is planning on using lined containers to transport all its zinc and lead concentrates to either the Port of Halifax (POH) or the Fairview Cove Container Terminal in Halifax, or have these containers loaded on rail card at the Milford train junction or even load them on trucks and have them delivered to the agreed spot with the off-takers. A number of these low-cost options are being evaluated as we speak. For those shipments expected to be made from the Port of Halifax or Fairview Cove Container Terminal, with the exact shipping schedule and lot sizes in each delivery to be mutually agreed within the project's shipping season.
19.7 Contracts
The following contracts are currently part of the proposed operations of the Scotia Mine:
- Memorandum of Understanding off-take agreement with MRI Trading AG for life of mine zinc and lead concentrates. This offtake agreement provides competitive terms for 333,000 wet metric tonnes (wmt) of zinc concentrate and 133,000 wmt of lead concentrate.
- Leasing of major mining equipment. This is common practice in the industry as it reduces initial capital expenditures and it assists the Company in maintenance of the equipment, as leased equipment is also often subject to maintenance agreements. ScoZinc has received non-binding quotes from two mobile mining equipment suppliers and is expected to complete the selection process and enter into a supply and maintenance contract when ScoZinc has received the necessary project funding.
- No contractual arrangements for concentrate trucking, port usage, shipping, smelting or refining currently exist. Although the Company has signed an MOU with MRI Trading AG for the sale of concentrates, no binding contractual arrangements have been made for the sale of zinc or lead concentrates at this time.
19.8 Smelter Market
Currently, there are a number of operating zinc smelters around the world, including four in North America and many more overseas smelters in Asia, Europe and Latin America.
19.8.1 North American Smelters
Table 19-10: North American Smelters
| Company | Smelter Name | Location | Zinc Capacity (kt) |
|---|---|---|---|
| Glencore | Valleyfield | Valleyfield, Quebec | 265 |
| Nyrstar | Clarksville Zinc | Clarksville, Tennessee | 124 |
| Hudbay | Flin Flon Zinc | Flin Flon, Manitoba | 115 |
| Teck Resources | Trail Zinc Plant | Trail British, Colombia | 290 |
Source: JDS Energy & Mining Inc. (2018)
19.8.2 Select International Zinc Smelters
| Company | Smelter Name | Location | Zinc Capacity (kt) |
|---|---|---|---|
| Glencore | San Juan de Nieve | Spain | 486 |
| Glencore | Nordenham | Germany | 150 |
| Nyrstar | Balen | Belgium | 260 |
| Nyrstar | Budel | Netherlands | 294 |
| Nyrstar | Auby | France | 172 |
| Nyrstar | Hobart | Australia | 271 |
| Boliden | Kokkola | Finland | 290 |
| Boliden | Odda | Norway | 170 |
| Korea Zinc | Onsan | South Korea | 550 |
| Hindustan Zinc | Chanderiya, Debari | India | 747 |
| Votorantim | Cajamarquilla | Peru | 300 |
| Shaanxi Nonferrous | Mianxian | China | 340 |
| China Minmetals | Zhuzhou | China | 450 |
Table 19-11: Select International Smelters
Source: JDS Energy & Mining Inc. (2018)
19.9 Metal Prices
There were no independent market studies completed specifically for ScoZinc or the Scotia Mine Project in support of the 2020 Pre-Feasibility Study.
A number of sources were reviewed to determine a market consensus for the long-term prices of zinc and lead, including Sell Side Mining Research published by different brokerage houses in Canada or internationally and studies by independent consultants such as Wood Mackenzie Ltd., Fastmarkets MB, S&P Global Market Intelligence and Open Mineral AG.
Wood Mackenzie, a leading natural resources research and consulting firm, publishes quarterly forecasts of metal prices and other economic assumptions used by different market participants in their long-term planning. The Q1 2020 market update assumes a 2020 zinc price of US\$ 1.05/ lb (pound) and a lead price of US\$ 0.88/ lb, a 2021 zinc price of US\$ 1.14/ lb and a lead price of US\$ 0.84/ lb, a 2022 zinc price of US\$ 1.17/ lb and a lead price of US\$ 0.82/ lb, and a 2023 zinc price of US\$ 1.17/ lb and a lead price of US\$ 0.81/ lb.
As at March 2020, Wood Mackenzie's long term forecast for zinc prices is US\$ 1.39/ lb and for lead price is US\$ 0.88/ lb.
| Metal | Units | 2020 | 2021 | 2022 | 2023 | Long Term |
|---|---|---|---|---|---|---|
| US\$/ lb | \$1.05 | \$1.14 | \$1.17 | \$1.17 | \$1.20 | |
| Zinc | US\$/ tonne | \$2,315 | \$2,513 | \$2,579 | \$2,579 | \$2,646 |
| US\$/ lb | \$0.88 | \$0.84 | \$0.82 | \$0.81 | \$0.90 | |
| Lead | US\$/ tonne | \$1,940 | \$1,852 | \$1,808 | \$1,786 | \$1,984 |
Table 19-12: Prices of zinc and lead used in financial analysis
As discussed below and regardless of the current macro situation and elevated global uncertainty due to the COVID-19 pandemic, the long-term outlook for global economy and for both lead and zinc is considered positive and these fundamentals, with the continuing Canadian-US dollar exchange rate which significantly improves metal prices expressed in Canadian dollars and with the current oil prices decline expected to continue in the medium term, impact favorably on the Scotia Mine Project.
Long-term base case metal prices used in the financial analysis in the 2020 Pre-Feasibility Study are shown in Table 3-11. Based on the evaluation of consensus forecasts and review of published information from various market studies, the long-term metal prices selected for the base case economics of the Scotia Mine are considered to be reasonable.
| Table 19-13: Prices of zinc and lead used in financial analysis – Long Term | |
|---|---|
| ----------------------------------------------------------------------------- | -- |
| Metal | Units | Long Term | ||
|---|---|---|---|---|
| US\$/ lb | \$1.20 | |||
| Zinc | US\$/ tonne | \$2,646 | ||
| US\$/ lb | \$0.90 | |||
| Lead | US\$/ tonne | 1,984 |
19.9.1 Macroeconomic Outlook
The following discussion on the long-term outlook for metal prices draws on the current market conditions and on published public information extracted from various sources including: Open Mineral AG, Fastmarkets MB, Glencore December 2019 Investor Presentation, Glencore 2019 Annual Report, Teck Corporation 2019 Annual Report, S&P Global Intelligence Ltd. and Wood Mackenzie Ltd.
Economic growth rates, particularly industrial production growth forecasts, impact the demand and behavior of metals prices. Until the arrival of the current pandemic, both worldwide real GDP growth and worldwide industrial production growth were on an upward trajectory, with certain countries benefiting from an economic expansion at full or close to full employment (i.e. the United States).
Unfortunately, the arrival of COVID-19, first in China, then in Western Europe, then the United States and most of the world, resulted in most of the world's governments imposing severe stay at home measures which will result in a potential double digit drop in GDP growth in Q2 and Q3 of 2020. Once the pandemic is somewhat under control and especially if vaccine development efforts result in significant progress, it is expected that world economies will rebound at an accelerated pace. The massive fiscal stimulus with which various governments around the world initially responded to the crisis, should also help with economic restart and hence the demand for metals, especially base metals (gold and precious metals have already experienced solid price appreciation). Furthermore, as many non-first world countries imposed drastic measures to contain the virus resulted in many mines across the world being placed under reduced schedules, temporarily shut down or entirely placed under care and maintenance. Until the supply side of base metals (zinc, lead) comes back online, it is expected that commodity prices will outperform the current levels once the economy restarts (the demand side). It is also expected that the recovery in industrial production and in business activity in general, worldwide, shall continue in 2021 and beyond, which should translate into a wide commodity prices recovery.
Moreover, and specifically related to ScoZinc, the USD strengthened significantly against the majority of the world's currencies (including the Canadian dollar) during February – March 2020, largely due to the flight to safety around i) the current steep market correction, and ii) the current COVID-19 pandemic. These 2 factors also resulted in a steep decline in the oil price, a key cost component of any mining operation, including the Scotia Mine. As the economies around the world recover and as the COVID-19 spread is contained, it is expected that both non-USD currencies and the oil price will recover with oil showing relative strength in May 2020.
19.9.2 Zinc Prices
Zinc is one of the most widely used base metals in the world, known for its ability to resist oxidation and corrosion. Zinc is mainly used to galvanise steel or iron – that is, to apply a zinc coating to stop it rusting. Galvanised steel is used in buildings, cars, white goods and electronics. The strength and flexibility of zinc alloys mean they are widely used to create die casts for industrial uses – for example, in the production of car or machine parts. Zinc is also used to make brass and bronze. Zinc oxide is mainly used in the production of rubber, while zinc sulphide has uses such as X-ray screens, in optics, and as a pigment. Hence, zinc's fundamentals remain largely underpinned by the automotive sector, with infrastructure development and emerging market considerations, particularly in China and India, being key to the metal's long-term outlook.
Recent developments in the Zinc Markets and their Implication for the Zinc Markets in 2020 and beyond:
Global concentrate market in surplus; smelter production returning to new normal
- Global mine production missed forecast in both 2018 and 2019
- Chinese zinc mine supply was down by 1% keeping production at 2015 levels
- 2019E global refined zinc supply was up by 1.9% 2019 versus the forecasted growth of 6.4% (which was expected at the end of 2018)
- LME refined zinc stocks decreased almost 80,000 tonnes in 2019
- 4 th consecutive year of zinc metal market deficits, which have driven down stocks
- Smelter bottleneck in China restricted metal production, drawing down stocks
- Global visible zinc exchange inventory the end 2019 well below long term averages just over 2 days of actual consumption, with only 50,000 tonnes of refined zinc remaining on LME
- High cost miners under pressure and closing due to low price and high treatment charges
- Although COVID-19 resulted in lower demand for base metals in general, robust expected growth in infrastructure, enhanced by massive government spending, will boost zinc demand from post-fabrication galvanizers, starting with 2020-2021
- Zinc price showed resilience since the COVID-19 started. After hitting this year's low of US\$1,774/ tonne on March 25th, 2020 in the face of the coronavirus pandemic, zinc prices have recovered, crossing US\$2,000/ tonne in early May 2020
- The global construction sector stabilizes the need for zinc in 2020-2021, which is partially offset by a lower expected demand from the automotive sector and from other industries
- 2020 and beyond: higher smelter production mainly in Asia while in Europe a lower metal output is expected
- Low zinc prices will most likely result in mine closures in 2020 that will stay close for some time to come
- Cutbacks to drive turnaround weak demand and failing profitability might accelerate cutbacks, and
- Global mine production capability is forecast at 14.0Mt in 2020, 15.0Mt in 2021 and 15.2Mt in 2022
In addition, according to Glencore, a globally diversified natural resources company, the anticipation of large increases in both zinc concentrate and metal supply, plus the global macroeconomic uncertainty, weighed negatively on zinc market sentiment during 2019. Despite recording another metal deficit year in 2019, resulting in historically low visible zinc metal stocks, the zinc price averaged US\$2,549/ tonne (US\$1.15/ lb), 13% lower than 2018.
The zinc price peaked in April 2019 at US\$3,017/ tonne (US\$ 1.36/ lb) followed by a swift fall to US\$2,210/ tonne (US\$ 1.00/ lb) by September of the same year driven by trade wars and market uncertainty. The zinc price closed the year at US\$2,293/ tonne (US\$ 1.04/ lb), 7% down from the start. By March 2020, the zinc price had fallen to US\$1,800/ tonne (US\$ 0.81/ lb).
The global average C1 cash cost is forecast to increase by 3.8% from US\$0.66/ lb paid zinc in 2019 to US\$0.68/ lb in 2020. The rise is mainly due to a forecast 24% year-on-year increase in the global annual realized treatment charge for 2020 to US\$300/ tonne concentrate. This increase in the contract terms is expected to increase global C1 costs by 0.051/ lb zinc, according to Wood Mackenzie. By comparison, Scotia Mine's expected LOM average C1 cash cost is expected to be US\$ 0.60/ lb.

Figure 19-10: Composite Cash Costs for Zinc Mines vs. Scotia Mine
Source: Wood Mackenzie, ScoZinc Mining Ltd.

Figure 19-11: C1 Cost Curve – Base Case & Probable Projects vs. Scotia Mine
Source: Wood Mackenzie, ScoZinc Mining Ltd.
Quoting Glencore: "Concentrates supply, ex China, grew year-over-year (YoY), but the effect was considerably lower than initially expected, increasing by only 150,000–200,000 tonnes. Delays in project ramp-ups, operational issues and labor strikes were the primary drivers of such underperformance. In China, per the National Bureau of Statistics (NBS), 2019 mine production decreased 1% on the prior year. Metal production in China (per NBS) did respond in H2 2019. Smelters resumed partially idled production, following additional environmental controls imposed in 2018, with such capacity filled with imported concentrates. Chinese metal production is reported to have grown by 526,000 tonnes (9.2%). In the rest of the world however, negative growth of 130,000 (-1.7% year on year) has been reported. Despite the increase in reported global metal production, visible zinc metal stocks continued to be drawn. Compared to December 2018, LME and SHFE stocks dropped by 60% and 40% respectively to 51,000 and 28,000 at December 2019, signaling that zinc demand was sufficient to absorb the additional units."
China continues to dominate the zinc and lead mine output in the world. In 2020, China is expected to account for 35% and 44% of the world's zinc and lead mine production, respectively. China's share of total world production has been falling in the last few years, as in 2016 it accounted for 40% zinc and 58% lead production. This has been in response to a number of mines shuttering coinciding with increased environmental inspections. In 2020, the top ten producing countries are to account for 83% and 87% of zinc and lead mine production on the same basis.
In 2020, the top ten zinc mines are expected to account for over 20% of global output. Wood Mackenzie's Q1 2020 long term outlook forecasts that Rampura Agucha in India will regain its position as the world's largest zinc producer in 2020 (after losing it in 2019 to Red Dog). Red Dog in the US is to have the second position in the world in 2020. The mines are expected to produce 540,000 zinc and 520,000 zinc in concentrate respectively in 2020. Rampura Agucha fully transitioned to be an underground mine in 2018 and in 2020 ore
milled is expected to exceed 5 million tonnes per annum. Antamina mine in Peru entered third position during 2019 in a phase of processing a higher proportion of copper-zinc ores with higher zinc grades and consequently having a higher zinc production.
For the world lead producers, the top ten are expected to account for 20% of total lead production in 2020, with Mount Isa ranking number one followed by Doe Run, Sindesar Khurd, Cannington and Penasquito.
In 2020, ownership of the top ten zinc in concentrate producing companies is expected to account for 32% of world zinc mine production. The top three zinc mining companies are those companies which own the largest producing mines, Glencore, Hindustan Zinc and Teck.
Looking ahead, zinc mine supply is expected to continue growing, given the current project pipeline. Nevertheless, the current combination of low prices and high treatment charges is pressuring mining profitability, which may result in supply disruption in the short to medium term. Producers with low all in sustaining costs (i.e. ScoZinc) expected to remain profitable albeit at reduced levels. The increase in metal production is necessary for the market to restock from the current multi-year lows.
19.9.3 Zinc Concentrate Treatment Charges
The price for concentrate, the Treatment Charge ("TC"), is set based on the supply and demand of concentrate. This is an annual negotiation and applies to all concentrates sold in that year. There are also smaller lots of concentrates traded on the spot market which are sold from mines to smelters based on production at the mine and requirement by the smelter. This often involves a third-party trading company, which in ScoZinc's case is MRI.
Given the difficulty of discovering new deposits and the many years then required to commission a new mine it is rare that world mine production matches smelter capacity in a given year and that the resulting refined production matches any demand for refined zinc. It is therefore common for both sequential markets to be either in surplus or in deficit with stocks of both providing some buffer of supply. (Source: Wood Mackenzie).
As at April 2020, according to Open Mineral AG and other market sources, the zinc TCs are dropping quickly, with certain contracts being quoted below US\$200/ tonne. As at May 2020, contracts were quoted @ US\$140/ tonne.
On the Chinese refined side, there is a good improvement in galvanizing demand as most of the construction and infrastructure projects have restarted. The die-casting and chemical industries, which are more linked to domestic consumer and export markets, are improving more far more modestly.
Zinc domestic mine supply is recovering slowly. Chinese miners came back late after Chinese New Year, and with the sharp recent price fall, some miners are reluctant to sell their concentrate. Domestic zinc concentrates are relatively tight now and port stocks are declining. Chinese smelters (with less issues to offload sulphuric acid) are raising utilization rates again and with the favorable arbitrage, smelters are actively trying to source imported material.
Mounting concern around COVID-19 led disruptions at some key suppliers globally and in Latin America along with the recent metal price fall, will lead to falling spot TCs. The zinc mining sector is undoubtedly going to go through a difficult 3-6 months as estimates are for around 15-20% of all mines are burning cash on a total cash cost basis. In March of 2020, three zinc mines in Australia were being placed on care & maintenance.
In addition, COVID-19 is expected to erode metal demand which is likely to support high spot TCs and lower Chinese smelter utilization rates for 2020. According to Open Mineral AG, it is expected that the Ex-Chinese TCs could settle around ~US\$280/ tonne conc @ US\$2,300/ tonne zinc price.
19.9.4 Long Term Zinc Markets
With the concentrate market still in surplus in 2020 and zinc demand likely to plunge in the coming months in the face of the global impact of COVID-19, we are likely to see the pace of project development slow, if not stall completely in the coming months.
However, according to Wood Mackenzie, over the long term to 2030 global zinc consumption is forecast to grow at an average 1.5% per year. Albeit modest growth rates, but this represents an average increase in zinc consumption of 225,000 tonnes per annum of zinc. Thus, new mine and smelter production of a similar order of magnitude are required.
For zinc mines, this is equivalent to the construction of one new large mine (or four medium-sized ones) every year. We expect this production to come from a combination of projects, expansions at operating mines and mine life extensions over the medium to long term.
As of May 2020, a new World Bank Group report called "Minerals for Climate Action: The Mineral Intensity of the Clean Energy Transition", finds that the production of minerals could significantly increase by 2050, to meet the growing demand for clean energy technologies. It estimates that over 3 billion tons of minerals and metals will be needed to deploy wind, solar and geothermal power, as well as energy storage, required for achieving a below 2°C future. Zinc and lead feature among those metal expected to benefit it from and significantly help with the development of clean energy technologies.

Figure 19-12: Expected Demand for Minerals by 2050
Source: The World Bank "Minerals for Climate Action: The Mineral Intensity of the Clean Energy Transition", May 2020 report
The report makes specific reference to Zinc-air batteries: "Zinc-air batteries have become more prominent in the emerging storage sector because of their high specific energy density compared to other storage options, such as Li-ion batteries. Zinc-air batteries have emerged as the leading mineral-air battery type because they are safe, environmentally friendly, and potentially cheap and simple. The potential advantages of the technology can be seen in a comparison of the practical energy density of different battery technologies. Lithium-air batteries are possible and have even higher energy densities, but zinc is more attractive for a number of reasons, including safety, ease of recyclability, and greater global availability. Zinc-air batteries could potentially be used in both electric vehicles—either solely or, potentially more practically, as a range extender in combination with a Li-ion battery—and stationary storage (Sherman et al. 2018)".
In addition, according to the same report, "98.1% of zinc demand from energy technologies comes from the wind industry, as the mineral is predominantly used for protecting wind turbines from corrosion."
19.10 Lead Price
Lead has a wide range of industrial uses including batteries, undersea cables, weights, solders and radiation protection. The price of lead, which is used mainly for batteries, can be related to that of zinc as the metals are usually co- produced. Lead has relatively low stocks and, as China barely trades the metal, sell-off shocks are rare. Official data shows that mine output has been falling in China as more stringent environmental controls are applied and many closures have been enforced. China continues to be the leading producer and consumer of lead.
Wood Mackenzie, a leading natural resources research and consulting firm, publishes quarterly forecasts of metal prices and other economic assumptions used by different market participants in their long-term planning. The Q1 2020 market update assumes a 2020 zinc price of US\$ 1.05/ lb and a lead price of US\$ 0.88/ lb, a 2021 zinc price of US\$ 1.14/ lb and a lead price of US\$ 0.84/ lb, a 2022 zinc price of US\$ 1.17/ lb and a lead price of US\$ 0.82/ lb, and a 2023 zinc price of US\$ 1.17/ lb and a lead price of US\$ 0.81/ lb.
| Metal | Units | 2020 | 2021 | 2022 | 2023 | Long Term |
|---|---|---|---|---|---|---|
| US\$/ lb | \$1.05 | \$1.14 | \$1.17 | \$1.17 | \$1.20 | |
| Zinc | US\$/ tonne | \$2,315 | \$2,513 | \$2,579 | \$2,579 | \$2,646 |
| US\$/ lb | \$0.88 | \$0.84 | \$0.82 | \$0.81 | \$0.90 | |
| Lead | US\$/ tonne | \$1,940 | \$1,852 | \$1,808 | \$1,786 | \$1,984 |
Table 19-14: Prices of zinc and lead used in financial analysis
As at March 2020, Wood Mackenzie's long term forecast for lead price is US\$ 0.88/ lb.
19.10.1 Lead Mine Production
The similarity of zinc and lead metallogenesis (i.e. the formation of distinct metal ores) has resulted in the major producers of zinc being strongly represented in the ranking of lead producers. Similarly, the overwhelming majority of lead mines produce some zinc, leaving only a small number of primary lead mines in operation.
In 2020, Australia's Mount Isa is expected to produce the most paid lead, followed by Doe Run, Sindesar Khurd, Cannington and Penasquito. Penasquito lead in concentrate would increase 49% from 2019 to 2020 reaching 104kt zinc in concentrate as Penasquito is to have a full year of production. In 2019, operations were halted twice between March and October because of an illegal blockage. (Source: Wood Mackenzie).
Global average C1 composite cost for lead mines is estimated to be US\$ 0.51/ lb lead in 2020, an 8% increase compared with US\$ 0.47/ lb lead in 2019. The expected rise in the lead treatment charge will more than offset the reduction in costs due to the higher year on year zinc price. A lead price of US\$ 0.81/ lb (US\$1,788/ tonne) in 2020 would intersect at the 96th percentile of the lead C1 cost curve.
The demand for lead metal is expected to be moderately strong, especially after a return to normalcy post COVID-19 and especially with expected increased usage in the automotive and industrial battery sectors in the near-term and continued decline in the world production of refined lead metal in the near to medium-term.
19.10.2 Lead Concentrate Treatment Charges
This PFS assumes that long-term treatment and refining charges (TC/ RC) will continue a downward trend for Year 1 and Year 2, followed by a gradual escalation as shown in the table below:
| Commodity | Year 1 | Year 2 | Year 3 | Rest of Mine Life |
|---|---|---|---|---|
| Zinc (US\$ per DMT) | \$200 | \$225 | \$250 | \$250 |
| Lead (US\$ per DMT) | \$170 | \$175 | \$190 | \$190 |
The three major components of the lead concentrate treatment contract are:
- A Treatment Charge ("TC"), commonly expressed in US dollars per tonne of concentrate. The charge is tied to the lead price by way of an escalation clause (price participation). Price-participation clauses are expressed in one of two ways, either, for example, "the treatment charge shall be increased by US\$3.3/tonne concentrate for each cent (or part there-of) the price increases above the base price" (expressed in c/lb lead), or, "the treatment charge shall be increased by 15.0 cents/tonne concentrate for each dollar the price increases above the base price" (expressed in US\$/tonne lead). The two quoted rates are equivalent to each other. There were no de-escalation clauses until 2002, but these are now common in most contracts. In 2017 the price participation scales were set to zero. (Source: Wood Mackenzie)
The treatment charge can vary significantly from mine to mine since it is very much dependent on the quality of the concentrate. As for zinc, lead treatment charges are also subject to 'site' allowances where appropriate.
-
The percentage of lead metal content that will be paid by the smelter. The world-wide standard is payment for 95%, subject to a minimum deduction of 3 units.
-
Payment for by-product metals and penalties. By-product payments are usually made for silver and gold subject to minimum deductions which vary over a wide range. Penalties will be levied for elements such as arsenic, bismuth and antimony subject to minimum limits. ScoZinc has limited to no deleterious materials, which should result in no penalties for our lead concentrate.
For the above Treatment Charge forecasts, ScoZinc has relied on market studies and forecasts published by independent consultants such as Wood Mackenzie Ltd., S&P Global Market Intelligence, Fastmarkets MB and Open Mineral AG. Open Minerals' one-month TC/RC expectation survey conducted in early May 2020 suggested that the industry, on average, expected terms at around US\$130-170/ tonne. According to Fastmarkets MB, depending on the silver content on a concentrate sample, the lead concentrate TCs benchmarks, for March 2020, were between US\$170 (low silver) to US\$180 (high silver). For April 2020, the lead TCs were between US\$135 (low silver) to US\$150 (high silver content).
Scotia Mine's lead concentrate is a low silver content concentrate and hence ScoZinc should benefit from the lower expected TCs for our lead concentrate.
Against the backdrop of expected concentrate deficits during first half and Q3 2020, it is reasonable that spot TCs will fall further and perhaps faster than expected, in the coming months.
As of mid-April 2020, as per the below graph from Open Mineral, the Zinc spot charges are falling at faster rates than they shot up in 2018 Q3/Q4. In addition, as a result of the COVID-19 pandemic in 2020 Q1/ Q2, the closure of zinc mines in Peru and other parts of the world is having a major impact on smelters in China and the Chinese zinc smelters are fighting to buy zinc concentrates as mine supply falls, which should result in lower TCs for the short to medium term.
ScoZinc's concentrates are deemed highly desirable by smelters due to their high concentrate quality, historically grading 57% Zn and 71% Pb, and low levels of deleterious metals. These characteristics translate into premium prices for paid metals and, coupled with the decreasing trend in the TCs, are expected to result in improved economics for the Scotia Mine.

Figure 19-13: Historical Lead Treatment Charges
19.10.3 Current & Long-Term Lead Markets
In 2019, the global lead market was balanced, with 2020 forecasted to have an oversupply of up to 100,000 tonnes. The 2020 mine supply to be lower than expected (although the lead disruptions to be smaller than those in zinc): a further decline in refined lead production in the Americas and in Europe, with a stable production in China is forecasted, scrap lead remains tight, mostly attributable to COVID-19, and lead prices are expected to rebound in a material way by late Q3, early Q4 2020.
For the medium to longer term, the demand for lead metal is expected to be moderately strong, especially after a return to normalcy post COVID-19 and especially with expected increased usage in the automotive and industrial battery sectors in the near-term and continued decline in the world production of refined lead metal in the near to medium-term.
In addition, the concerted efforts throughout the world to address climate change, will result in additional and steady demand for minerals, including base metals (i.e. lead, zinc). As per the May 2020 World Bank Group report called "Minerals for Climate Action: The Mineral Intensity of the Clean Energy Transition", the production of minerals could significantly increase by 2050, to meet the growing demand for clean energy technologies. It estimates a steady growth of 9% p.a. for lead will be needed to deploy wind, solar and geothermal power, as well as energy storage, required for achieving a below 2°C future.
19.10.4 Zinc & Lead Prices Adopted
The metal prices used in the financial analysis in the 2020 Pre-Feasibility Study are shown in Table 3-14 below.
Based on the evaluation of consensus forecasts and review of published information from various market studies, the long-term metal prices selected for the base case economics of the Scotia Mine are considered to be reasonable.
| Metal | Units | 2021 | 2022 | 2023 | Long term |
|---|---|---|---|---|---|
| Zinc | US\$/lb | \$1.14 | \$1.17 | \$1.17 | \$1.20 |
| US\$/tonne | \$2,513 | \$2,579 | \$2,579 | \$2,646 | |
| Lead | US\$/lb | \$0.84 | \$0.82 | \$0.81 | \$0.90 |
| US\$/tonne | \$1,852 | \$1,808 | \$1,786 | \$1,984 |
Table 19-16: Prices of zinc and lead used in economic analysis
19.11 Conclusions
The Scotia Mine project in the province of Nova Scotia, as evidenced by this PFS, demonstrates compelling economics both in the short term (under weak metal prices assumptions) as well as in the medium to long term (under metal prices expected to recover). In addition, both the zinc and lead concentrates produced at the Scotia Mine are premium, high quality, low impurity concentrates well sought by smelters worldwide.
Furthermore, ScoZinc has already a favorable off take agreement to market these non-deleterious concentrates for the life of mine production.
20 Environmental Studies, Permitting and Social or Community Impact
Note: Item 20 has no change from Previous NI43-101 Technical Report by Carew, et al, 2020
20.1 Project Overview
The Scotia Mine is an existing operation on high-level Care & Maintenance with substantial environmental databases, operating history, and valid permits and licenses that allow for the mining, processing of resources, and the shipping of zinc and lead concentrates. Roughly half of the resources used in this economic analysis are already under permit and mining of those resources (Main Zone, Southwest Expansion) can begin immediately. The Scotia Mine has a Life of Mine ("LOM") of approximately 14 years and, as currently planned, the re-establishment of the Scotia Mine involves:
- Development of an open-pit zinc-lead operation, mining approximately 39,000 tonnes per day, decreasing linearly, and processing approximately 2,700 tonnes per day
- Upgrading or replacing existing mine facilities
- Potential increase of the Tailings Storage Facility ("TSF") capacity after year 8 of the LOM
- Construction of an additional water settling pond and discharge point
Another important aspect of the project status with respect to permits, environment and community is that regulators and the community have experience with the Project and environmental baseline conditions are already well understood. In combination, these factors limit the overall permitting risk and anticipated timelines for permitting project expansions to include the entire mineral resource used in this analysis.
In addition, the risks and potential costs associated with environmental and community issues are well understood and based on operating experience and history of the mine. As such, the financials for environment and community matters that are input to the economic model are accurate to a feasibility level.
20.2 Overview of Existing Information
There is information available on the Nova Scotia Environment website which includes the approvals for Environmental Assessments and the Industrial Approval. The Nova Scotia Environment (the permitting Regulator) registry of ScoZinc's associated files can be viewed at https://novascotia.ca/nse/
20.2.1 Environmental Setting and Socio-Economic Setting
The climate conditions for the Project area are based on the nearest climate station with historical data. The Upper Stewiacke climate station (operated by the Meteorological Service of Canada; Government of Canada 2017) is located approximately 35 km northeast of Gays River at a similar elevation. Based on data collected between 1981 to 2019, the average total annual precipitation is 1,363.6 mm (water equivalent), which includes 248.1 cm of average snowfall per year and 1,115.5 mm of average rainfall per year.
Monthly precipitation amounts remain fairly constant throughout the months of May to August, increasing through September through December. The average annual temperature is 6.2°C, with an average monthly range from -6.8°C in January to 18.4°C in July. On average, the Scotia Mine experiences relatively mild winters with snowfalls regularly melting throughout the winter months to keep snowbanks at zero or very-low depths.


Figure 20-2: Historical Average Monthly Temperature
Figure 20-3: Historical Average Monthly Snowfall

The physical geography of the area surrounding the Project has been previously described (CRA 2011). Topography in this region of Nova Scotia is dominated by mainly Carboniferous rocks (shale, limestone, sandstone, gypsum) upon which deep soils derived mainly from glacial outwash have developed (Roland 1982 in CRA 2011). These central lowlands provide a topography that is variable in nature from lowland plains to rolling hills and rarely exceed 90 m above sea level (CRA 2011).
The local geology consists of a dominance of Lower Carboniferous (Mississippian Age) Windsor Group strata with occurrences of the Meguma mapped southwest and northeast of the Gays River/ Cooks Brook area.
The Project area is well drained, with fine textured soil on hummocky terrain that lies in the southern extent of the Central Lowlands, adjacent to the Rawdon/ Wittenburg Hills and the Eastern Interior ecodistricts (Neily et al., 2005).
The hydrogeological regime in the Project area is complex; controlled by a karst gypsum / carbonate contact which has been in-filled with Cretaceous-age sands and clays. Two overlying Pleistocene glacial cycles and recent deposition of the river alluvium adjacent to the meandering Gays River complicate the hydrogeology. Several sand units form aquifers that are separated by zones of permeable clays which are probably interconnected in the karst gypsum deposits overlapping the mineral deposit (CRA 2011).
The Gays River is the principal watercourse in the area, with its headwaters in Lake Egmont. The Main Branch of the Gays River flows north and west past the Project site, where it converges with the South Branch Gays River. Drainage for the Gays River sub-system of the Stewiacke-Shubenacadie River system collects from the valley sides to the north and south of the emerging Cooks Brook and Gays River (CRA 2011). In the Project area, the Gays River is a meandering channel with overall low gradient and limited riffles and abandoned pools. The substrate sediments are predominately silt with very minor boulders and cobbles. The active channel averages 10 metres in width with a range of water depths from several centimetres to several metres (CRA 2011).
There are several wetland complexes in the Project area. In Nova Scotia, wetlands are protected under the provincial Environment Act and an approval is required for their alteration. A wetland survey and compensation plan may be required as a component of the Project development for areas not currently under Industrial Approval permit. Surveys of plants and animals have previously been completed for the general project area. Previous work has identified Hepatica nobilus (Round-Lobed Hepatica), which is considered endangered in Nova Scotia by the Nova Scotia Department of Lands and Forestry; the project Environmental Assessment approval requires a monitoring program for this species and is outlined in the Wildlife and Vegetation Monitoring Plan. Other flora species of interest include two plant species and one lichen species. Canada Lily (Lilium canadense), Canada Wood Nettle (Laportea canadensis) and the lichen Sticta fuliginosa are considered sensitive to human interaction by NSDLF.
No fauna species of concern have been identified to date within the site footprint. However, Wood Turtles (Glyptemys insculpta) have been observed within the local area. This species is categorized as threatened under both provincial and federal legislation. The project Environmental Assessment approval mandates the undertaking of an inventory and ongoing monitoring program for this species, and it is outlined in the Wildlife and Vegetation Monitoring Plan.
Additional wildlife surveys will be required prior to disturbance in the Southwest Expansion area as outlined in the Wildlife and Vegetation Monitoring Plan. New development areas contemplated by this report will be required to undergo an Environmental Assessment (and approval) and Industrial Approval.
20.2.1.1 Socio-Economic Setting
The Scotia Mine is located in Cooks Brook, a small, unincorporated community in the Halifax Regional Municipality ("HRM") that borders the community of Gays River, Colchester County. This community lies between the larger communities of Middle Musquodoboit, Lantz and Shubenacadie. The population of the surrounding area is described by Nova Scotia Finance, Community Counts to fall within three "communities" namely Middle Musquodoboit, Lantz, and Wittenburg. The total population of these three areas is 6,816 (2006 Census; community-specific information is unavailable from the 2016 census). About 28% of the population is under 20 years of age and 13% is 65 years of age or older. Population growth between 1996 and 2006 was about 3%. English is spoken by over 99% of the population. The average family income for the three communities in the area ranges from \$56,500 to \$67,000 per annum (the more affluent area being Lantz) (CRA 2011).
In the local area there is a range of land uses focused on resource-based industries such as agriculture, forestry and mining. The mine site is in an agricultural area that extends from the Musquodoboit Valley north into Colchester County. Agricultural land use accounts for approximately 5% of the Gays River area.
The local area is primarily forested with mixed use (mainly residential and small business) located along the secondary roads. Sawmills and a wood pellet manufacturing plant are located near Middle Musquodoboit. Forested lands are primarily privately owned. Private woodlot owners are a significant source of supply to these facilities. ScoZinc owns about 50% of the property in the Gays River area.
Project permits currently require and mandate a Community Liaison Committee ("CLC") composed of local residents and mine site staff. During mine operation, the committee meets on a regular basis to discuss issues from the community in regards to the mining operations. Past meetings have highlighted noise from the operations as a key issue for local residents, as well as concerns about dust and potential impacts to Gays River quality and flow. Employment and opportunities for local people is also an important issue. The operation expects to draw substantial numbers of its workforce from the nearby communities and as such employees will also provide a valuable source of communication on local issues. It is anticipated that the requirement for a CLC will continue to be a requirement of Industrial Authorizations for future project expansions.
Local residents rely on wells for water supply. Potential impacts to groundwater wells from localized dewatering of the aquifers through mining or changes to aquifers from blasting shocks have been identified as a possibility. Bonding of \$147,500 is in place with the Government of Nova Scotia for the purposes of supplementing water supply of local residents in the event of impacts to water supply wells. The bonding amount is based on residents within a certain proximity of the mine site. As the Project expands, the requirement for bond will likely need to be increased to account for the greater number of residents that fall within that perimeter.
Archaeological studies of the Project area have been undertaken for various phases of the project development. Given the proximity to Gays River and the long post-colonial history of the area, several, mostly minor, pre-contact and post-contact archaeological sites have been identified within the Project footprint. However, these previously identified sites have been studied, catalogued, and handled so that they require no additional action and will not inhibit mine development. Archaeological surveys of additional areas that may be disturbed as part of this Project may be required during the permitting process.
20.2.2 Summary of Environment and Socio-Economic Issues
Environmental studies of the project area have identified several plant and animal species of interest, including two that require an ongoing monitoring program. A Wildlife and Vegetation Monitoring Plan will be implemented that will identify species of concern and monitoring measures to keep them safe. New footprintspecific surveys may be required for new areas of disturbance anticipated by the development scenario identified in this report.
Community communication and involvement is mandated to a CLC through existing Project permits. This committee is and will continue to be the primary tool for communicating with local residents regarding their concerns or issues with the Project. Noise, dust, and impacts to water wells have been identified as key community issues. Bonding requirements have been established as mitigation for impacts to water wells and it can be expected that the overall bond requirement will increase as the footprint of the project increases and the number of residences within the certain proximity of the Project increases.
Archaeological sites in the area of the Project are not uncommon, and several minor sites have previously been identified within the project footprint; however, these sites have been assessed and will pose no obstacle to mine operation or development. Footprint-specific surveys will be required for new development areas and there is a possibility of identifying pre and post contact archaeological remains in the project area. Management of any such finds may require avoidance through adjustments in project plans or, if this is not possible, excavation of any identified sites prior to project disturbance.
20.3 Environmental Management Plans
As a part of provincial and federal legislation and in order to minimize the potential environmental impacts a number of management plans will be developed and implemented.
The following documents have been or are currently in development for implementation:
- Community and Liaison Committee Program
- Final Design, Construction Drawings Waste Rock Pile
- Final Design, Construction Drawings Settling Reservoir
- Waste Management and Dangerous Goods Management Plan
- Waste Rock and Stockpile Stability Plan
- Explosives Management Plan
- Water Management Plan
- Annual NSE Report
- Environmental Effluent Monitoring plan
-
Spill Contingency Plan
-
Closure and Reclamation Plan
- Surface Water Sampling Program
- Groundwater Sampling Program
- QA/QC program for Water Sampling
- Soil Erosion and Sediment Control Plan
- Wildlife and Vegetation Monitoring Plan
- Noise Monitoring Program
- Ambient Air Monitoring Program
- Water Supply Policy
- Technical Blast Design
- Blast Monitoring Program
- Pre-Blast Survey
- Pit wall Stability Monitoring Program
- Geotechnical Assessment
- Wetlands Protection and Monitoring Plan
- Wetlands Compensation Plan
- Complaint Response Plan
- Dam Safety Plan (dam safety inspections, dam safety reviews)
- TMF Monitoring Plan
20.3.1 Tailings and Waste Rock Management
Tailings generated by the milling process will be pumped to the existing tailings storage facility ("TSF"). A causeway TSF raise will be required to establish the needed catchment size to accommodate the additional tailings volume generated by the project expansions. The costs to increase the capacity of the existing TSF are captured in the capital and operating budget for the operation. The tailings disposal plan will safely maximize usage of the existing storage area before raises occur.
Solid waste generated at the Project site will consist of unusable rock, organics and other naturally occurring materials stripped from the areas. Waste rock will be used, as appropriate, for infrastructure development with the excess being stored in waste rock stockpiles near the pit or backfilled into the mined-out portion of the pit. Lower-grade resource from the pits will be segregated and stockpiled for future processing. Gypsum excavated during pit stripping may be segregated and stockpiled for shipping off site. For more information on Gypsum handling, please refer to Section 16.
All the administration, processing and support facilities will remain at the existing site location and are serviced by an existing on-site sewage treatment system.
20.3.2 Site Monitoring
Monitoring of the project site will be carried out by internal project staff with the assistance of qualified consultants when necessary. The cost for support staff, lab analysis and supporting external resources has been incorporated into the General and Administration ("G&A") costs of the current Project economic model.
Site environmental monitoring anticipated to be required for the operation includes:
-
Hydrogeology – Groundwater monitoring wells have been and will be established at appropriate locations in the vicinity of Project facilities. Groundwater will be monitored for level and quality through the operations and closure phases of the Project. Precise locations and analysis parameters are set out in the current Industrial Approval
-
Surface Water – Surface water quality and flow volume monitoring has been and will be carried out at environmental discharge locations, in the receiving environment upstream and downstream of the discharge location where appropriate, and in other locations as required. The precise locations and analysis parameters of the monitoring program are established in the Industrial Approval

Figure 20-4: ScoZinc Monitoring Locations
-
Wetlands – Areas planned for disturbance will be surveyed for the presence, size and quality of wetlands. A Wetlands Protection and Monitoring and a Wetlands Compensation Plan has been developed and will be carried out in accordance with Nova Scotia policy where required
-
Domestic Wells – Water wells on private property that fall within the perimeter prescribed for water well bonding will be tested for recharge and quality in advance of initiating operations, where allowed by the land owner(s). The CLC will provide a communications link between the Project General Manager and the local residents if domestic well impacts are alleged. Follow-up monitoring can be carried out and mitigation measures initiated if impacts are found
-
Blast Surveys – Prior to commencing operations, an updated survey of residences and other buildings within a prescribed perimeter of blasting operations will be carried out (where allowed by the land owner(s)). Blasts will be monitored from several monitoring stations so that concussion and ground vibrations limits are not exceeded. The CLC will provide a communication link between the Project General Manager and local residents when blasting damage is alleged. Follow up inspections can be carried out in the event of a complaint and mitigation measures developed based on the outcome of these inspections
-
Dust – Total Suspended Particulate ("TSP") emissions monitoring will be required once operations commence so that limits set out in the Industrial Approval are not exceeded. Particulate monitoring throughout different phases of the expansion process can be conducted using a Beta Array Monitor or High Volume Sampling. Air quality monitoring locations are set out in the Industrial Authorization
-
Noise – Ambient noise monitoring will be required during operations, so that sound levels to not exceed limits specified by the Industrial Approval. Managing noise issues will be dependent on complaints received from local residents via the CLC in communication with the Project General Manager. Noise issues are likely to be episodic and associated with specific activities, locations, residence proximity, and climate conditions. Management of noise complaints will be case specific and depend on those attributes of the perceived issue
-
Archaeology – Personnel involved in all ground disturbances related to the construction and mining activities will be made aware of the potential for archaeological and/or cultural resources and the appropriate actions to take in identifying and reporting such features
-
Flora & Fauna – The Wildlife and Vegetation monitoring plan will be implemented which includes, but is not limited to, monitoring of the plant Hepatica nobilus, and a monitoring program for Wood Turtles. Site specific habitat surveys required for expansion areas may identify additional species requiring monitoring and/or mitigation. The precise nature and type of these monitoring and mitigation programs will be prescribed in consultation with NSDLF
-
Socio-economic Parameters – The only socio-economic parameter likely to require future monitoring will be Traditional Land Use Surveys by First Nations. These surveys are typically done in advance of site disturbance to document plant and animal species in the area that are used by First Nations.
20.3.3 ARD Management Plan
The Scotia Mine orebody is hosted by carbonate rock which is naturally acid reducing and therefore significantly eliminates any potential for the project to exhibit acid rock drainage ("ARD"). Although there are no known instances of ARD at the Scotia Mine, ScoZinc has contingency measures in place to monitor and control any leachate.
As outlined in the Industrial Approval, every 100,000 tonnes of ore mined, samples will be analyzed for acid base accounting, total sulphur and percent sulphide. Should ARD be identified, measures in the Industrial Approval will be followed.
20.3.4 Water Management
Wastewater at the Scotia Mine occurs in four management streams; tailings supernatant, pit water from pit dewatering, contact water from the mill and ancillary buildings, and contact water from waste rock stockpiles and other disturbed mining areas.
A series of dewatering wells 10-40 metres deep will surround the perimeter of the open-pit creating a cone of depression around the pit and allowing for dry pit walls and increasing pit wall stability. The water from these wells is pumped to a lined settling reservoir to allow sediments to settle out resulting in clean water. Water will be used as dust suppressant from the settling reservoir on an as needed basis. Clean water from the settling reservoir is sent to the mill for process water, and eventual tailings supernatant will be discharged to the Tailings Management Facility utilizing pumps and gravity. Depending on water quality, excess water from the settling reservoir will be directed to either the polishing pond or tailings pond and eventually through the polishing pond discharge. Pit water from the northern wells that are drawn from the underground workings will be pumped to pit sumps which will be directed to the Tailings Storage Facility.
Tailings supernatant will be released to the existing tailings pond which is located as a component of the TSF at the toe of the tailings beach. Excess water in the tailings pond is discharged to the polishing pond. From the Polishing pond it is discharged to the environment via an outflow structure where it flows to Annand Brook and from there to the Gays River upstream of the mine. Discharge through this structure is monitored for
quality and volume by onsite personnel through third party lab facilities and flow measuring devices. The water management process for the Project is consistent with the current operating parameters and permits for the Project.
Contact water from the mill and ancillary facilities is controlled by ditching and naturally flows towards the Main Pit or to the storm water storage pond outside the mine office building that in turn flows back to the pit. Water directed to the pit will be managed with the pit water and directed to the TSF. The storm water storage pond outside the mine office is intended as back-up fire suppression water for the operation.
Contact water from the North Barrier Berm will be captured in settling ponds located at the base of the berm so that the overall drainage and flow patterns leading into the existing catchment areas are maintained. Water will be discharged directly to the environment via pond spillways following tests to confirm it is within water quality limits. Contact water from the South Stockpile is directed to the TSF. In addition to the ponds, straw bales, straw waddles, and other sediment controls are used.
Water will be withdrawn from the Gays River on an as needed basis and within the approved daily limit. Water will be sent to the water treatment facility and distributed as non-potable water for site operations and to charge the Emergency Fire Suppression lines.
Water discharged from the tailings pond to the environment is currently subject to the Federal Metal and Diamond Mining Effluent Regulations ("MDMER") approach and guidelines as well as some additional requirements from the Province via the existing Industrial Approval. Historically the operations discharges have met all requirements except minor copper exceedance that were properly reported, and corrective actions were successful.

Figure 20-5: Scotia Mine Water Process Flow Chart
20.3.5 Chemicals, Fuel and Hazardous Material Management
The majority of mine activities, and those associated with chemicals and hazardous material, will take place within the mill in clearly delineated areas. Specific chemicals will have their own dedicated containments with spill mitigation kits designed for those specific chemicals within the working area. Regulations outlined in the Industrial Approval for Dangerous Goods/ Waste Dangerous Goods/Reagent Handling will be adhered to. Bulk fuel storage will be contained in double walled tanks stored in an impermeable berm with a 110% capacity of total storage.
Concentrate will be stored in the container management facility in lined and sealed 20' sea containers prior to shipment offsite. Consequently, dust should be minimal and any spills should be readily recovered.
The spill response plan will be updated to reflect changes to the mill process, storage of concentrate and bulk chemicals. An up-to-date inventory of dangerous goods and waste dangerous goods stored at the facility will be kept as is required by the Industrial Approval.
Non-hazardous waste produced on the mine site will be brought back to the existing facilities and trucked away for appropriate reuse or disposal to a provincially approved waste disposal facility. Recycling will be implemented where possible in accordance to HRM disposal requirements.
20.4 Permitting
The Province of Nova Scotia has a well-defined mine permitting process. The pre-development permitting process can be generalized into two stages, defined as Stage 1 or the Environmental Assessment ("EA") stage and Stage 2 or Permits, Leases, and Approvals. Stage 1 is completed first, followed immediately by Stage 2, and once Stage 2 approvals are in place, mining activities can commence.
20.4.1 Overview of the Regulatory Process
20.4.1.1 Stage 1 – Environmental Assessment
Provincial
The Environmental Assessment ("EA") for a mine proposal normally occurs following advanced exploration, and a positive economic analysis to warrant mine development. The Environmental Assessment process in Nova Scotia is regulated under the provincial Environment Act and Environmental Assessment Regulations. Projects required to be registered for EA are divided into two categories: Class I and Class II undertakings. A facility that extracts or processes metallic or non-metallic minerals, coal, peat, peat moss, gypsum, limestone, bituminous shale or oil shale, is identified as a Class I undertaking thus requiring registration for EA. The provincial EA process begins with the proponent presenting an overview of the mining project at a "One Window" Committee meeting attended by Nova Scotia Environment ("NSE"), Nova Scotia Labour and Advanced Education, NSDLF and any other regulators the government determines to be relevant based on the project specifics (potentially including federal regulators such as DFO, Environment and Climate Change Canada, and Transport Canada). The meeting is designed to inform the regulators of the project and for the regulators to advise the proponent on any possible regulatory issues from their respective departments. At the end of the meeting, the Department of Environment will inform the proponent if the project must be registered under the Environmental Assessment Regulations.
Following the "One Window" Committee meeting but prior to registering the EA, the proponent will usually meet with members of the One Window Committee and hold a project open house for the public so that potential topics of concern are addressed in the registration document. Once the proponent is satisfied that topics have been addressed, a finalized registration document is submitted to NSE for Registration. Within seven days of the project's registration, the proponent must publish a Notice of Registration to inform the public of the project, where copies of the EA Registration document can be reviewed, and to invite the submission of comments to the NSE EA Branch during the 30-day public review period. Copies of the document are also distributed by the Environmental Assessment Administrator to applicable regulators for review and comment. Following the public review and comment period, the Environmental Assessment Administrator summarizes comments received from the public and regulators, and submits to the Minister for an approval decision. From submission of the registration document to the Minister's decision is approximately 57 days (i.e. seven days for the document to be registered following submission and 50 days for the public and regulatory review period and the Minister's decision). However, the assessment may be extended if the Minister decides that more information, a focus report, or Environmental Assessment report is required. If it is an "Approval" decision, there are usually terms and conditions which must be addressed at Stage 2.
Federal
The requirements for federal EA are defined by the Canadian Environmental Assessment Act ("CEAA") 2012. CEAA 2012 applies to "Designated Projects," which are physical activities listed under the Regulations Designating Physical Activities under CEAA 2012. A project not listed under the Regulations Designating Physical Activities can still be designated by the Minister, if, in the Minister's opinion, the activity may result in adverse effects or public concern that may warrant the designation. Such a designation is unlikely for the Project.
The Regulations Designating Physical Activities identify 48 "Physical Activities" that constitute Designated Projects which would require federal EA under CEAA 2012. Items 16 and 17 of the Schedule to the Regulations Designating Physical Activities include:
16 The construction, operation, decommissioning and abandonment of a new:
(a) metal mine, other than a rare earth element mine or gold mine, with an ore production capacity of 3 000 t/day or more;
(b) metal mill with an ore input capacity of 4 000 t/day or more;
17 The expansion of an existing:
(a) metal mine, other than a rare earth element mine or gold mine, that would result in an increase in the area of mine operations of 50% or more and a total ore production capacity of 3 000 t/day or more; (b) metal mill that would result in an increase in the area of mine operations of 50% or more and a total ore input capacity of 4 000 t/day or more;
Since the mine will not exceed these thresholds, the Project is not considered a Designated Project under CEAA 2012, and a federal EA is not anticipated to be required. Further, as no aspect of the Project will be built
on federal land, it is not expected that the mine will require an Environmental Assessment under Section 67 of CEAA 2012.
20.4.1.2 Stage 2 – Permits, Leases and Approvals
Stage 2 follows an EA Approval decision and involves the steps to attain the Permits, Leases, and Approvals required for mining activities. The three generally required are a Mineral Lease, Land Access Agreements, and an Industrial Approval. A Mineral Lease grants exclusive rights (20-year term) to some or all of the mineral resources in a specified area but does not allow any field activity beyond exploration. The approval time for a new lease is generally 60 days or less if all required information has been submitted. Land Access Agreements are a legally binding agreement that provides the Proponent access to the project area. The length of time required to acquire these agreements is variable.
An Industrial Approval (10-year term) is to construct, operate, or reclaim an open-pit, milling facility, or bulk solids handling load out facility. The submission document is fairly substantial and if an Environmental Assessment was required, must address all of the terms and conditions outlined in the approval. Once the document has been submitted and determined to be "adequate" by the NSE, the approval process can take up to 60 days unless deficiencies are identified and the approval time period extended by the regulators.
20.4.2 Permits and Licences
ScoZinc has a number of permits and approvals in place, as provided in the following table.
| SCOZINC PERMITS & APPROVALS | |||||||
|---|---|---|---|---|---|---|---|
| COMMON NAME | NUMBER (if applic.) |
FUNCTION | GRANTING AUTHORITY |
STATUS | DATE GRANTED |
EXPIRY | |
| Environmental Assessment Approval - Main Mine Area |
N/A | Environmental Review |
Nova Scotia Environment (Then NS Dept. of Environment & Labour) |
Approval in effect |
2000-08- 14 |
No Expiry | |
| Environmental Assessment Approval - Southwest Expansion |
N/A | Environmental Review |
Nova Scotia Environment |
Approval in effect |
2011-10- 07 |
2020-10-07 date by which project (ie, the project within the SW Expansion Area) commencement is required. |
|
| Industrial Approval - ScoZinc Scotia |
2006- 055136- 05 |
Operating Permit - ScoZinc Mine |
Nova Scotia Environment |
Approval in effect. |
2017-02- 23 |
2027-02-23 |
Table 20-1: ScoZinc Permits and Approvals
| Mine | |||||||
|---|---|---|---|---|---|---|---|
| Industrial Approval - Sheet Harbour Bulk Solids Handling Facility |
2007- 057986- 04 |
Operating Permit - Sheet Harbour Bulk Solids Handling Facility |
Nova Scotia Environment |
Approval in effect. |
2017-11- 01 |
2027-11-01 | |
| Mineral Lease 10-1 |
10-1 | Required prior to the development of a mine |
Nova Scotia Department of Energy and Mines (Then Department of Natural Resources) |
In good standing |
2010-04- 02 |
2030-04-02 | |
| Mineral Lease 12-1 |
12-1, ("40058" in NovaROC system) |
Required prior to the development of a mine |
Nova Scotia Department of Energy and Mines (Then Department of Natural Resources) |
In good standing |
2013-10- 02 |
2033-10-02 | |
| Mineral Lease 12-2 |
12-2, ("40059" in NovaROC system) |
Required prior to the development of a mine |
Nova Scotia Department of Energy and Mines (Then Department of Natural Resources) |
In good standing |
2013-10- 02 |
2033-10-02 |
20.5 Indigenous Background
First Nations involvement with past operators of the mine and mill has been meaningful and as a result; to date the project has had no issues or incidents with Indigenous communities that could potentially be affected by the project. Current management strives to continue that meaningful relationship through strong liaison and consultation with community leaders.
First Nations were involved in Mi'kmaq ecological knowledge gathering in the late 1990s, 2005, and again in 2012. In 2006, an archaeological site of significance (the Sinkhole Site) was mitigated using First Nations involvement and staff in an area of Gays River. The site had been planned for disturbance by a previous mine plan. Contact has been made with representatives from the closest First Nations community of Sipekne'katik First Nation and preliminary discussions held about mutually beneficial programs. ScoZinc will pro-actively engage in further discussions and are cognizant of the "Mi'kmaq - Nova Scotia - Canada consultation Terms of Reference".
20.6 Mine Closure
The reclamation plan has been developed for the Scotia Mine in accordance with the Industrial Approval. The current plan is as of 2017 and is required to be updated during the annual review to indicate the current status of the site reclamation. It also includes the mine plan and progressive reclamation plans for the next three years. The current plan was most recently updated in 2017 and will be updated in 2020. A final reclamation plan will be submitted for approval within 6 months following cessation of production or 6 months before the commencement of final reclamation.
20.6.1 Temporary Closure
Definition of Temporary closure:
Temporary closure is defined as a mine ceasing operations with the intent to resume mining activities in the future. Temporary closures can last for periods of weeks, or for several years based on economic, environmental, political or social factors.
Definition of Care and Maintenance:
- Care and Maintenance is a term used in the mining industry to describe process and conditions on a closed mine site where there is a potential to recommence operations at a later date. During care and maintenance phase, production is stopped but the site is managed to ensure it remains in a safe and stable condition.
- 20.6.1.1 Waste Rock Pile
Activities planned for the waste rock pile during Temporary Closure or C&M include monitoring for slope stability.
20.6.1.2 Underground
Historical underground workings are flooded. ScoZinc has no intention or plans to mine underground at the Scotia Mine. There are no underground mining operations included in the LOM for this Pre-Feasibility Study.
20.6.1.3 Mill Process Plant
On Care and Maintenance the Mill Process Plant will be shut down and all hazardous chemicals stored appropriately or shipped offsite. Process water will be sent to the Tailings Management Facility. All concentrates will be stored in shipping containers in the container management facility. Process infrastructure will be stored in a manner to prevent wear.
20.6.1.4 Tailings Storage Facility
The Tailings Management Facility will continue to receive surface water from runoff. Tailings pond and polishing pond will continue to treat as designed and water quality monitoring will continue at all surface water sites as per provincial and federal regulations.
20.6.1.5 Site Infrastructure
Non-essential buildings during Care and Maintenance will be taken off-line. Only those buildings needed to support required personnel will remain active.
20.6.1.6 Monitoring
Site monitoring will continue as required by provincially and federally mandated regulations.
20.6.2 Permanent Closure
The needs and wishes of a community, as well as the mining process, may change as the project proceeds resulting in the requirement for a "Final Reclamation Plan" to be submitted within six months following the end of the extraction phase of the mine life. This plan is prepared by the proponent in consultation with the CLC, NSE, NSDLF, local Indigenous Communities and potentially other stakeholders such as community groups or technical organizations.
This "Final Reclamation Plan" is then approved and the proponent begins the work. The plan often includes monitoring components for aspects such as surface water quality, groundwater quality, water levels, vegetation growth and wetlands health. When the proponent completes all of the requirements of the Environmental Assessment, Industrial Authorization and any other reclamation-related conditions, the proponent is able to get back the reclamation bond value in full. Nova Scotia also allows for portions of the bond to be released if progressive reclamation is part of the project. For example, if 20 percent of the area has been reclaimed to the goal in the "preliminary reclamation plan", a portion of that bond may be released if NSE and NSDLF are satisfied with the work completed.
In accordance with the above noted process, no final reclamation plan for the Project has been prepared or submitted. The requirements noted here are inferred from the currently accepted Preliminary Reclamation Plan which covers the Main Pit, tailings storage facility, waste stockpiles, and mine buildings. The current Preliminary Reclamation Plan was approved in July 2017.
Reclamation for the entire project will ultimately include the following:
- Removal of infrastructure and buildings
- Final rehabilitation of stockpiles
- Final surface contouring and sediment erosion control
- Assessment and remediation (if required) of any contaminated soils
- Rehabilitation of the former mining pits and tailings management area (including slope stabilization)
- Pit flooding
- Water level control
- Revegetation
Monitoring
20.6.3 Post-Closure Monitoring, Maintenance and Reporting Program
This section outlines monitoring specific to reclamation activities. The current Environmental Assessment and Industrial Authorization for Site Operations prescribe required monitoring for the duration of site operations that includes a number of aspects as described above as well as surface water, groundwater, rare plants.
ScoZinc anticipates that in keeping with the currently approved reclamation plan, post-reclamation monitoring for the expanded project will be carried out for a period of at least three years after final site reclamation. This includes monitoring of groundwater levels, surface water quality, vegetation, and aquatic habitat.
Key elements of the reclamation plan may include the following:
Vegetative Cover
Periodic inspections of the effectiveness of re-vegetation efforts will be needed. Areas identified as requiring additional effort will be noted, and a program to address the deficiencies in the re-vegetation will be developed and submitted to NSDLF and NSE for review.
Slope and Shoreline Inspections
Slopes on stockpiles and shorelines of the lakes created by reclamation activities will be inspected for issues of erosion on a routine basis during reclamation operations. Inspections on a quarterly basis are proposed for the various Pits for a period of three years after pit closure or less as agreed to by NSDLF, NSE and the CLC. ScoZinc recognizes that additional monitoring may be required after the reclamation program is complete, if so directed by NSDLF and/or NSE.
Pit Water Quality
Before decommissioning, the water being pumped from the Pits to the Tailing Management Area will be monitored for general chemistry and metals according to stipulations set forth in the Industrial Approval. Upon cessation of dewatering operations in the Pits, this monitoring will be replaced by seasonal water quality measurements from two depths (0-1 m and 1 m from bottom) in a central location of the pit lake for general chemistry and metals. An in-situ water quality meter may be used to provide a suite of parameters such as temperature, conductivity, and pH. It is proposed that monitoring continue for three years after the water level in the pit has reached stabilization and then be re-assessed by ScoZinc and NSE to determine if refinements to the program are required or cessation of the program is approved.
Groundwater Levels and Quality
The site is well equipped with monitoring wells that are used to address the current Industrial Approval requirements for both water level and water quality monitoring. It can be expected that additional monitoring wells will be required to address the future phases of the Project beyond the currently permitted project footprint. Available wells in this network will be monitored on a monthly basis for water level and for general chemistry and metals after mine closure. Each year, ScoZinc will review the data and consult with NSE on any required refinements to the program.
A summary of the post-reclamation monitoring activities are provided below in Table 19-2.
| Medium | Schedule | Parameters | Reporting | Maintenance | Comments |
|---|---|---|---|---|---|
| Surface Water | Monthly during reclamation; Quarterly post-reclamation for three years after quarry lake water level stabilization unless otherwise agreed upon with NSE and NSDLF. |
Surface water chemistry and field parameters data. |
Quarterly Summary Yearly Report |
Outflow structure may need minor repairs that will be completed when noted during monitoring sessions. |
Established monitoring locations. Locations added or removed as required. |
| Drainage Control Structures |
Monthly during reclamation then Quarterly for three years after quarry lake water level stabilisation. |
Inspection | Quarterly Summary Yearly Report |
As needed. | Include all surface water drainage structures, including those that are part of the TMA |
| Groundwater | Monthly during reclamation/ Quarterly post reclamation for three years after quarry lake water level stabilisation unless otherwise agreed upon with NSE. |
Groundwater chemistry and field parameters data. |
Quarterly Summary Yearly Report. |
Wells may need minor repairs that will be completed when noted during monitoring sessions. |
Existing wells will be used and possibly supplemented, if needed. |
| Vegetation | Monthly during reclamation/ Quarterly post reclamation for three years after quarry lake water level stabilisation unless otherwise agreed upon with NSE and NSDLF. |
Vegetation population and community survey data. |
Quarterly Summary Yearly Report. |
As required to establish vegetative cover. |
Approved seed mixes will be used. Monthly inspections will only be during the growing season. |
| Wetlands | Monthly during reclamation/ Quarterly post reclamation for three years after quarry lake water level stabilisation unless |
Wetland plant community and hydrology data. |
Quarterly Summary Yearly Report. |
As required to establish wetlands |
Constructed wetlands will have a monitoring program specified in |
| otherwise agreed upon with NSE and NSDLF. |
the wetlands compensation plan that is accepted by NSE. |
||||
|---|---|---|---|---|---|
| Erosion and Sediment Control (pit shore and stockpile slope stability) |
As required during reclamation until stable conditions are reached. Monthly in year one post reclamation activities being completed and quarterly for three years after quarry lake water level stabilisation. |
Visual inspection. Develop metrics to measure success. |
Quarterly Summary Yearly Report. |
As required to maintain slope stability and erosion control. |
Pit shoreline; Stockpile slopes. Inspections will be completed by qualified persons. |
| Tailings Management Area Discharge |
Monthly during reclamation then quarterly for three years after quarry lake water level stabilisation. |
Surface water quality and quantity data. |
Quarterly Summary Yearly Report. |
SW1 is the only planned discharge point from the Tailings Management Area. |
|
| TMA Dams (Causeway, Saddle & Polishing Pond) |
Monthly during reclamation then quarterly for three years after quarry lake water level stabilisation. |
Inspection | Quarterly Summary Yearly Report. |
As needed. | |
| TMA Dam Safety Review (Causeway, Saddle & Polishing Pond) |
At least once post active reclamation. |
Inspection and report |
Once | ||
| Pit (s) water | Monthly during reclamation and refilling; then quarterly after pit has reached steady state unless otherwise agreed upon with NSE and NSDLF to the end of the monitoring program (three years after |
Surface water quality and quantity data. |
Quarterly Summary Yearly Report. |
Two samples at one location: 0-1 m and 1 m from bottom. |
| quarry lake water stabilisation). |
||||
|---|---|---|---|---|
| Quarry Lake, Western Wetland, & Gays River |
Monthly during reclamation and refilling; then quarterly after pit has reached steady state unless otherwise agreed upon with NSE and NSDLF to the end of the monitoring program (three years after quarry lake water stabilisation). |
Water Levels. | Quarterly Summary Yearly Report. |
20.6.4 Reclamation Bonding
ScoZinc currently has a cash performance bond for the protection of domestic water supplies (\$147,500) and a reclamation bond of \$2.89 million held with the Province of Nova Scotia.
The domestic water supply related bond has been implemented as part of the Industrial Approval and has never needed to be drawn from due to an unresolved water supply related issue.
The reclamation bond amount was calculated based on the Reclamation Plan submitted to and accepted by the Province in 2011. Bonding for the Southwest Expansion, permitted in 2012, is currently outstanding and payment will be required prior to any work commencing. The current bonding for the Southwest Expansion is estimated to be \$4.0 million, as the initial cost estimate by the Province for the reclamation of this additional area was \$3.7 million. No additional bonding for mining the Getty Deposit has been included in the current economic model of the Project as the current bonding in place of \$2.89 million plus the Southwestern Expansion bonding of \$4.0 million is in total (\$6.89M) considerably larger areas than the proposed additional mining areas associated with the Getty Deposit.
It is expected that progressive reclamation of the historic project components (mined out pit areas and existing rock dumps and stockpiles) in conjunction with progressive bonding by the Government will allow the total bond requirements to be maintained at the current estimate of \$6.89 million as the Project progresses through the Northeast Extension, Northeast Pit, and Southwest Extension Pit and Getty phases.
21 Capital and Operating Expenditure
Note: Item 21 has no change from Previous NI43-101 Technical Report by Carew, et al, 2020
21.1 Sources of estimated costs
The capital and operating expenditure estimates used in this pre-feasibility study for re-starting the Scotia Mine (pre-commercial production period) were determined from a number of sources by ScoZinc and its consultants, including equipment purchase, leasing proposals and vendor quotations. Due to the brown-fields nature of the Scotia Mine, and its high-level care & maintenance status, it is estimated that more than 50% of the capital cost estimates, excluding contingency, are based on firm pricing obtained through competitive quotations by qualified vendors and contractors.
Under the Life of Mine plan and cash flow model, the Scotia Mine commences re-start works 9 months before actual commercial production of zinc and lead concentrate begins. This period is referred to as the precommercial production period, or "pre-production" period of the mine. ScoZinc believes that due to the highlevel care & maintenance status of the mine, plus the Scotia Mine staff already in place with its strong contractor and consultant base, a relatively short 9 to 11 month period is time enough to complete all necessary technical work, permitting notices, and supplier quotations in order to ensure the commercial production timetable is met.
Mine production therefore commences on Month 4 of the pre-production period (or 5 months before commercial production), and mineral processing commences on Month 10 of the pre-production period. The pre-production period is also referred to Year -1. Commercial production therefore occurs on Month 10 of the pre-production period, which is effectively Month 1 of the Scotia Mine production period. Year 1, also begins on Month 1, with the Life of Mine plan showing 14 Years or 167 months of commercial production.
The majority of the quotes and work proposals have been received during the first quarter of 2020, and are considered to provide a relatively high-level of accuracy for the purposes of this pre-feasibility study and the cash flow model.
Additional engineering designs are however planned to confirm layout and structural support aspects for new equipment in the mill processing plant particularly, including the new primary and secondary crushers, the new double deck vibrating screen, the Jameson flotation cells, the new concentrate filter presses and loadout facility.
| Capital and Operating Estimate | Source |
|---|---|
| Mining fleet costs and operating performance | Tormont/Komatsu |
| Mining operations costs including dewatering & support | Terrane/ScoZinc |
| Mining infrastructure costs | Suppliers/ScoZinc |
| Processing Plant equipment upgrades | Ausenco |
| Processing operating costs | Ausenco/ScoZinc |
| Site facilities improvements and operating costs | ScoZinc |
| Concentrate logistics | ScoZinc |
| Power requirements & costs |
Ausenco/ScoZinc |
| Owner's costs | ScoZinc |
| Reclamation estimate | Dept Mines/Environment |
Table 21-1: Sources of inputs to Capital and Operating Expenditure estimates
21.2 Capital Cost Summary
Capital cost estimations for a 9 to 11 month pre-production period through to commercial production period have been estimated to total of \$26.9 million, which are based on mining equipment purchase or leasing costs, mill refurbishment and upgrade costs, plus all indirect capital costs during the pre-production period, excluding working capital, ownership costs and contingency.
Including all working capital and contingencies, the estimated total capital cost is \$YY million. Working capital includes all operating costs and indirect capital costs required until receipts from sales of concentrate are realized. Contingencies of between 5% and 15% were applied to each major cost centres to provide a standard pre-feasibility study accuracy of between -20% to +20%.
Following on from commercial production, capital costs have been developed for the life of mine to include sustaining capital requirements over the 14-year mine life. Estimations have been developed based on monthby-month forecasts over approximately 160 months.
| Capital Cost period | Duration | Total | |||
|---|---|---|---|---|---|
| Pre-Commercial Production Cost | 9-months | \$26.9 million | |||
| Sustaining Capital Cost | 14-years | \$8.1 million | |||
| Life of Mine Capital Cost | 14.6-years | \$35.0 million | |||
| Contingencies | 2-years | \$3.3 million | |||
| Total Life-of-Mine Capital Cost | 14.6-years | \$38.3 million |
| Table 21-2: Summary of capital costs | |||
|---|---|---|---|
| -------------------------------------- | -- | -- | -- |
21.3 Pre-production capital
During the pre-production period of 6-months, the capital costs forecast for each month are provided in the following table by major cost centre. The majority of the costs are associated the mill process plant refurbishment and upgrades, the mining fleet equipment purchases and leasing costs, and the mine operating costs for pre-stripping overburden to access the ore body for sustainable ore supply to the mill.
| Major Cost Centre | M-9 \$M |
M-8 \$M |
M-7 \$M |
M-6 \$M |
M-5 \$M |
M-4 \$M |
M-3 \$M |
M-2 \$M |
M-1 \$M |
Total \$M |
|---|---|---|---|---|---|---|---|---|---|---|
| Mining | 0.1 | 0.1 | 0.2 | 0.7 | 1.5 | 1.3 | 1.6 | 2.0 | 2.1 | 9.6 |
| Processing | 4.4 | 1.3 | 1.0 | 1.3 | 1.5 | 1.6 | 1.5 | 0.3 | 2.3 | 15.2 |
| Site Infrastructure | 0.0 | 0.0 | 0.1 | 0.4 | 0.4 | 0.1 | 0.1 | 0.0 | 0.0 | 1.1 |
| Reclamation Bond | 0.0 | 2.0 | 0.0 | 0.0 | 0.0 | 0.0 | 0.0 | 0.0 | -2.0 | 0.0 |
| Total Capital Cost (exContingency) |
4.5 | 3.4 | 1.3 | 2.4 | 3.4 | 3.0 | 3.2 | 2.3 | 2.4 | 25.9 |
| Continency | 0.2 | 0.3 | 0.3 | 0.4 | 0.4 | 0.4 | 0.3 | 0.3 | 0.2 | 2.8 |
| Total Pre-production Capital | 4.7 | 3.7 | 1.6 | 2.8 | 3.8 | 3.4 | 3.5 | 2.6 | 2.6 | 28.7 |
Table 21-3: Pre-production capital costs
A number of critical capital items will be ordered in advance during the procurement phase of the execution strategy, in particular certain processing equipment with long lead times. During the pre-production phase, lease payments on any items, particularly mining equipment, has been included in the pre-production capital costs. During the production period, the lease costs of such items after production commencement are included in Sustaining Capital costs for the life of mine.
21.3.1 Salvage values
The Scotia Mine is currently on care & maintenance and has a large real property portfolio and an extensive equipment asset register with a currently combined assessed value of over \$5 million. With the refurbishment and upgrades to the processing plant over the mine life, plus the purchase of additional mobile equipment, it is expected that the salvage value of the equipment at the end of the mine life would be in the order of \$12 million.
The table below presents a summary of the main equipment and salvage values after considering costs associated with disassembly and sale costs.
| Major Item for salvage or sale | Capital Cost/ Assessed Value |
Residual Value |
Salvage Value |
|---|---|---|---|
| Mining equipment |
\$12M | 15% | \$2M |
| Process plant equipment | \$10M | 15% | \$2M |
| Site equipment (existing) | \$4M | 15% | \$1M |
| Environmental bond (existing) | \$3M | 0% | \$0 |
| Real estate portfolio (existing) | \$2M | -3% | \$3M |
| Total | \$25M | \$8M |
Table 21-4: Salvage value capital estimate
21.3.2 Pre-Production capital cost inclusions and exclusions
The following cost items have been included in the Pre-Production Capital Cost Estimate:
- Additional engineering design work and trade-off studies
- Project financing costs
- Additional environmental bonding requirements
The following cost items have not been included in the Pre-Production Capital Cost Estimate:
- Project sunk costs including preliminary economic assessments or pre-feasibility studies
- Additional diamond drilling costs
- Any scope changes
- Inflation or escalation during pre-production period
- Foreign exchange variations
A table illustrating the capital cost inclusions and exclusions is provided below.
Table 21-5: Pre-production capital costs inclusions and exclusions
| Capital Expenditure | Inclusion | Exclusion | Total Cost |
|---|---|---|---|
| Engineering & IFC designs1 | Yes | \$2,935,203 | |
| Hydrology study | Yes | \$20,000 | |
| Ownership costs (deferred payment) | No | Yes | \$1,166,667 |
Note 1: Engineering designs for the process plant refurbishment upgrades, namely the primary crusher, secondary crusher, Jameson cell additions, concentrate filter press mezzanine deck, concentrate loadout conveyor bin and retractable conveyor system.
Note 2: Hydrological study on optimal water table pumping rates for pit slope stability
| Capital Cost | Inclusion | Exclusion | Total Cost |
|---|---|---|---|
| Metallurgical testing to increase throughput (1) | No | \$50,000 |
Table 21-6: Recommended pre-production cost items
Note 1: Metallurgical test work to improve throughput beyond 2,700tpd
21.3.3 Pre-Production direct capital costs - mining
The Life of Mine plan requires that five months of high-strip ratio mine production occurs before sufficient ore stockpiles are built to enable optimal blending at the ROM and a sustained processing rate of 2,700 tonnes per day.
As the Scotia Mine is based an owner-mining fleet operations, mining equipment is scheduled to arrive to site at least six months before commercial concentrate production occurs. ScoZinc's strategy is to gradually build up monthly mine production rates ensuring that the equipment operators and supervisory personnel are appropriately trained and assessed for the operational targets required.
Due to the open-pit development sequences determined during the pre-production period, both ore and waste materials are mined from the Scotia deposit from the first month of mining operations. For this reason, there are no mine pre-development costs.
Total pre-production capital expenditure for mining is estimated to be \$1.48 million, with an additional contingency of \$0.22 million.
21.3.4 Pre-Production direct capital costs - processing
In February 2020, Ausenco completed a mineral processing trade-off technical study which determined that the ScoZinc's mill contained a number of production and maintenance bottlenecks whose removal will contribute to increasing the efficiency of the mill under a production. Such bottlenecks included, inadequate grizzly design, inability of primary and secondary crushers and screens to correctly reduce rock sizes for efficient grinding, excessive dust generation inside the mill, undersized screens and general crushing circuit throughput restrictions, fine ore bin ore freezing and maintenance constraints, grinding circuit throughput and sizing constraints, re-grind mill disconnection, flotation circuit overload and poor particle separation and recovery, excessive concentrate moisture due to poor drying circuit system, insufficient and unreliable power supply, and insufficient and unreliable water supply. In evaluating the bottlenecks, Ausenco determined that a number of low-cost improvements could be made during a relatively short refurbishment period to significantly de-risk the processing operations. The main process flow improvements include the following:
Addition of a two-stage crushing on the Run-Of-Mine pad to eliminate excessive dust and improve oversize handling, throughput and blending controls;
- Upgrades to fine ore bin with knife gates, vibratory feeder conveyors and air canons to improve operations and maintenance controls, and also prevent ore freezing during periods of very low outside temperatures;
- Replacement of the rod handlers and various chutes to improve operations and maintenance;
- Incorporation of the re-grind mill to improve zinc grades;
- Upgrades to the flotation circuits with more efficient pumps and agitators, inline sampling, and flotation cell level automation; and
- Upgrades to the concentrate drying circuit with efficient filter presses commonly used in colder climate operations and enable higher productivity with better moisture controls.
During the pre-feasibility study process, ScoZinc and Ausenco applied considerable effort to determining the optimal equipment requirements and capital costs, whilst focusing on ScoZinc's strategy of a low-cost and lowrisk full scale production model.
ScoZinc and Ausenco have completed preliminary layouts and designs for the refurbishment and upgrade of the mill and associated facilities. Capital costs have been forecast based on a range of quotations received from vendors and costings received on other similar projects.
Costs were received on the following major items:
- Primary crusher monthly rental charges
- Secondary crusher system supply and install
- Tertiary crusher refurbishment
- Vibrating double deck screen supply and installation
- Fine Ore Bin material handling upgrades
- Rod mill refurbishment
- Ball mill 1 refurbishment
- Ball mill 2 refurbishment (previous re-grind mill)
- Cyclone refurbishment
- Reagent systems upgrades
- Metallurgical laboratory upgrades
- Flotation cell refurbishment
-
Jameson cell supply and installation
-
Thickener tanks refurbishment
- Concentrate filter press supply and installation
- Concentrate load out facility upgrades
- Concentrate handling facility supply and installation
- Electrical system survey including load survey and MCC
- Instrumentation and control systems
- Water balance survey and system upgrades
- Conveyor systems maintenance and upgrade
Total pre-production capital expenditure for processing is estimated to be \$15.3 million, with an additional contingency of \$2.6 million.
21.3.5 Pre-Production direct capital costs - site infrastructure
ScoZinc has completed designs for the relocation or upgrades to various infrastructure on site to support the mining and processing operations. Capital costs have been forecast based on a range of quotations received from vendors.
Costs were received on the following major infrastructure item costs:
- Powerline re-alignment from the northern wall to the southern wall
- Internet systems upgrades with fiber-optic connections
- Security systems upgrades with additional remote CCTV systems
Total pre-production capital expenditure for infrastructure is estimated to be \$1.1 million, with an additional contingency of \$0.15 million.
21.3.6 Reclamation costs
The Scotia Mine currently has a cash bond of \$2.89 million with the Nova Scotia Department of Finance to cover the reclamation work of the environmental assessment of the main zone of the Scotia Deposit. This cash bond was provided to the Nova Scotia in 2006. ScoZinc plans to replace this cash bond with a surety bond, and has received preliminary premium quotations for that to occur just prior to commercial production.
According to the additional EA for as the SW & NE expansion, ScoZinc must provide an extra environmental security bond in the amount of \$5 million to cover the reclamation work which was based on ScoZinc's preliminary economic assessment ("PEA"). New bond estimation is required based upon the PFS study and new life of mine plan. Due to very different life of mine strategies including the opportunity to progressively perform reclamation and deposit significant amounts of waste in the mine out pits, ScoZinc estimates that the additional environmental bond for the SW expansion may be consequently reduced to an additional bond of \$2 million. ScoZinc also plans to provide a surety bond for this amount, and has received preliminary premium quotations for that to occur just prior to commercial production in connection with the conversion of the existing \$2.89 million cash bond.
For future mining areas requiring environmental approval and bonding after the 6th year of the life of mine plan, namely the Getty Deposit, ScoZinc has assumed that a surety bond would be in place of \$2 million to cover the reclamation bond for the Getty area at the end of the mine life.
Reclamation costs for the current Environmental Assessment Approvals have been determined by the Nova Scotia Department of Environment and are tabulated as follows. All bond estimates have been included in the cash flow model under the sustaining capital costs.
| Development Area | Bond Required | Trigger |
|---|---|---|
| Main zone | \$2.89 million | Bond in place |
| (Main Zone) SW and NE zones |
To be re-assessed | Prior to disturbance |
| (South West & NE Zones) Getty zone |
(to be reassessed) Not determined |
Prior to Year 6 of the LOM |
| (Getty) Total Bond |
\$7.89 million | |
| Bond currently remitted | \$2.90 million | |
| Bond remaining | To be re-assessed | Prior to disturbance |
Table 21-7: Reclamation Bond requirements
21.3.7 Pre-Production indirect costs
ScoZinc has planned for its own qualified personnel to actively supervise the implementation of certain engineering, procurement and refurbishment works on the mine site, including those of the processing plant.
However, in respect of specialist expertise required for refurbishment of the Plant within the 5 to 6-month timeframe planned, ScoZinc intends to secure the services of an Engineering, Procurement and Construction Management ("EPCM") for a proportion of the process plant upgrades. The cash flow model has allowed for EPCM costs where necessary.
ScoZinc has also allowed for an increase to its spare parts inventory and for key equipment tenders. Prior to the pre-production period, the Scotia Mine will employ experienced warehouse and logistics personnel to manage inventory controls and bidding process.
Total pre-production indirect costs are estimated to be \$2.9 million.
21.3.8 Pre-Production contingency
Contingency allowances were estimated by ScoZinc, Ausenco and MineTech for each major cost centre based on the level of engineering definition required and the method of pricing sourced for various equipment.
The general basis of contingency levels is as follows:
- 5% new mining equipment
- 5% new mechanical equipment
- 10% freight from source to site
- 25% refurbishment of existing mill
Total pre-production contingency allowances are estimated to be \$2.9 million.
21.3.9 Production sustaining capital
During the 14-year period of commercial production under the life of mine plan, sustaining capital costs have been determined on a month by month basis to match the level of scheduling detailed completed during the mine planning process. Sustaining capital costs are not escalated or inflated.
The life of mine sustaining capital costs have been developed as follows:
- For mining equipment and activities, including the purchase and rebuild of mobile equipment, \$2.54 million is required over the mine life, including vehicles, dewatering equipment, replacement mining equipment, studies, support equipment, rockbreaker and a north berm. Costs for mining equipment used in this estimate were sourced from a variety of equipment suppliers, including Toromont, Komatsu, Dyno Nobel, Archibald Drill & Blast.
- Mining equipment leasing and rental costs \$51.57 million are included in sustaining capital costs over the life of the mine.
- Processing equipment leasing or rental costs of \$6.68 million are included in sustaining capital costs over the life of the mine and processing equipment upgrades or replacements of \$0.9 million.
- Infrastructure costs of \$0.9 million.
- Reclamation costs of \$1.35 million are included in sustaining capital costs over the life of the mine.
- Salvage value of \$8 million has been estimated and is a reduction of sustaining capital taken at the end of the mine life.
Overall, sustaining costs are an estimated \$5.28 per tonne of ore processed over the life of the mine.
| Sustaining Capital Costs | Life of Mine \$/tonne processed |
Life of Mine \$M |
|---|---|---|
| Mining | \$3.97 | \$54.24 |
| Processing | \$0.56 | \$7.58 |
| Infrastructure | \$0.07 | \$0.90 |
| Reclamation | \$0.10 | \$1.35 |
| Salvage Value | \$0.59 | \$8.00 |
| Total | \$5.28 | \$72.07 |
Table 21-8: Total sustaining capital costs
21.3.10 Working capital
Working capital includes the accumulation of operating expenses between the period of commercial production and the receipt of revenue from sales. All pre-production expenditure is classed as capital expenditure.
Due to the Scotia Mine's relatively short gap period determined by its efficient concentrate handling and transport system, the working capital requirement is an estimated at \$5 million.
21.4 Operating Expenditure Estimate
21.4.1 Total operating expenses
The Scotia Mine total operating expenditure ("OPEX") estimate is \$740.1 million over the life of the mine. This equates to \$53.72 per tonne of ore processed, or US\$0.59/lb C1 Cash Cost average. Compared to the other zinc producers, this average C1 Cash Cost places the Scotia Mine in the 25% lowest cost producers in the world.
The operating expenditure table below provides a summary of the life of mine operating costs for the total processed tonnage of 13.6M.
| Major Cost Centre | Life of Mine Total cost |
Life of Mine Unit cost |
|---|---|---|
| Mining | \$276.7M | 20.26 |
| Processing | \$154.1M | 11.29 |
| SG&A | \$31.0M | 2.27 |
| TC & Freight | \$271.6M | 19.89 |
| Total | \$733.4M | \$53.72/t milled |
| C1 Cash Cost | US\$0.59/lb |
| Table 21-9: Total operating expenditure summary | ||
|---|---|---|
| -- | ------------------------------------------------- | -- |
The detailed life of mine plan indicates that mine operating expenses will vary from year to year due to the initial high stripping ratios and shallow pits, versus low stripping costs and deeper pits past the mid-way point of the mine life. In contrast, processing costs over the life of the mine are fairly constant due to the steadystate processing throughput of 2,700 tonnes for the life of the mine. ScoZinc however expects processing improvements to me made in due course, such that the total unit operating costs may be reduced as the ore body is developed over the 14-year mine life.


Source: Wood Mackenzie, ScoZinc Mining Ltd.
For an annual operating cost perspective, the following figure illustrates the changes in cash operating expenses over the mine life.

Figure 21-2: Annual Cash Operating Expenditure


Figure 21-4: Annual Cash Operating Expenses by Cash Cost Component
21.4.2 Mine Operating Expenditure
The Scotia Mine is developed using conventional open pit mining practices and equipment with plans and designs prepared in conformance with regulatory requirements and industry best practices. These plans include detailed operational designs and schedules developed and optimized using the most recent mineral reserve estimates and state of art mine planning software. The life of mine ("LOM") plans provide detailed pit designs, access ramps, haulage routes, waste rock storage dumps, pit wall dewatering controls measures, design steps to address the old underground workings, pit slope stability measures, and dewatering models in order to achieve the best mining performance possible.
Drilling and blasting will be conducted by a licenced specialist contractor, and the load and haul operation will be conducted by ScoZinc. Mobile mining equipment will be provided to the mine under 60-month maintenance and report contract ("MARC") to ensure the equipment meets and maintains the best performance specifications throughout at least the first five years of its life span. Following that five-year period, ScoZinc intends to have sufficient maintenance personnel trained and in place to perform its own maintenance on its mobile fleet. All operations will be under the supervision of ScoZinc management teams. Mine site infrastructure such as technical facilities, equipment workshops, fueling bays, and operations area are predominantly in place to provide the essential support to mining operations. ScoZinc has included additional costs for improving support, such as a new diesel fuel bay and an additional workshop for large mobile mining equipment maintenance.
The mine will be operated on two 12-hour shifts per day, 365 days per year basis with 4 panel rotating crews. Labor supply within the province is more than ample to supply the needs of the operation. Labour rates used in the cash flow model are comparable other mining operations in the region.
The mine operating cost components include:
- Operating labour costs
- Mobile equipment operating costs
- Mobile equipment diesel fuel and tire costs
- Dewatering power and equipment
- Project costs
- Supervisory operating costs
- Indirect operating costs.
The estimated annual mine cash operating expenses ("Mine OPEX") varies across the life of the mine due to pit development sequences necessary for maintaining the constant ore supply to the ROM stockpiles for mineral processing. The distributions of mining costs within the mining operation are provided below the charts below.

Figure 21-5: LOM Mine Cash Operating Expenditure

Figure 21-6: Annual Mine Cash Operating Expenditure
21.4.3 Mill Operating Expenditure
The Scotia Mine mill operation used conventional crushing, grinding, flotation and filtration processes recover both zinc and lead concentrates. The mill operating expenditure (or Mill OPEX) has been developed based upon using the existing refurbished infrastructure, labour costs and process consumables for a 2,700 tonnes per day throughput.
ScoZinc and Ausenco analysed and examined a number of alternative throughput levels, ranging between 2,200 and 3,000 tonnes per day, with an additional alternative of 4,500 tonnes per day throughput. Under varying capital and operating expenditure costs, the 2,700 tonnes per day throughput was determined as the most optimal throughput for maximum recoveries, low-capex and low-risk operating performance.
Mill operating expenditures were developed for a 2,700 tonne per day life-of-mine throughput which included detailed planning and performance analysis of all processing circuits, including comminution, flotation, reagents, consumables, inventories, and water and power costs. Historical operating costs were also reviewed as a basis of comparison.
All processing operations will be under the supervision of ScoZinc management teams. Mill site infrastructure such as technical facilities, equipment workshops, and operations area are predominantly in place inside the Mill Building to provide the essential support to processing operations. ScoZinc has included additional costs for processing support, including an additional backup transformer and concentrate handling operations.
The mill will be operated on two 12-hour shifts per day, 365 days per year basis with 4 panel rotating crews. Labor supply within the province is more than ample to supply the needs of the processing operation. Labour rates used in the cash flow model are comparable other processing operations in the region.
The mine operating cost components include:
- Operating labour costs
- Fixed plant equipment operating costs
- Mobile equipment diesel fuel and tire costs
- Water supply power and equipment
- Project costs
- Supervisory operating costs
- Indirect operating costs.
The estimated annual mill cash expenditure ("Mill OPEX") is very constant across the life of the mine due to the constant processing throughput of 2,700 tonnes per day. The distribution of mill costs within the processing operation is provided below in a chart.

Figure 21-7: LOM Mill Cash Operating expenditure

Figure 21-8: Annual Mill Cash Operating Expenditure
21.4.4 General and Administrative Costs
The Scotia Mine general and administrative ("G&A") expenditures required to support both the mine and mill operations consists of management, administration, environment, community, human resources, safety, training, logistics, warehouse, security, IT, projects, support services, and all mine site insurance, bonding, taxes and other overheads.
Management and administrative staff will be engaged on a regular 5-day working week, on a 7am to 5pm basis. The labour supply within Nova Scotia for the majority of the administration requirements are considered very good particularly due to the mine's location within the Halifax Regional Municipality ("HRM"). Labour rates used in the cash flow model are comparable other mining and industrial operations in the region.

Figure 21-10: Annual G&A Cash Operating expenditure

Figure 21-9: LOM G&A Cash Operating expenditure
21.4.5 Workforce costs
The labour costs applied in the cash flow model for all Scotia Mine personnel are based on both salaried and hourly wage rates typically used in the Nova Scotia region for mining and industrial labour. An additional labour burden of 20% has been applied to the wages and 15% to salaried employees, which ScoZinc considers reasonable due to present burden calculations and the Scotia Mine's location in the Halifax Regional Municipality. Labour costs for ScoZinc's head office positions in Halifax are excluded from the workforce costs.
| Year | -1 | 1 | 2 | 3 | 4 | 5 | 6 | 7 | 8 | 9 | 10 | 11 | 12 | 13 | 14 |
|---|---|---|---|---|---|---|---|---|---|---|---|---|---|---|---|
| Mine | 40 | 68 | 68 | 68 | 68 | 68 | 68 | 69 | 72 | 72 | 72 | 68 | 64 | 54 | 41 |
| Mill | 12 | 54 | 54 | 54 | 54 | 54 | 54 | 54 | 54 | 54 | 54 | 54 | 54 | 54 | 50 |
| Site Services | 5 | 9 | 9 | 9 | 13 | 20 | 23 | 23 | 23 | 23 | 23 | 23 | 23 | 23 | 18 |
| Administration | 10 | 15 | 16 | 16 | 16 | 16 | 16 | 16 | 16 | 16 | 16 | 16 | 16 | 16 | 16 |
| Total Mine Site | 67 | 146 | 147 | 147 | 151 | 158 | 161 | 162 | 165 | 165 | 165 | 161 | 157 | 147 | 124 |
Table 21-10: Scotia Mine Workforce Labour Levels

Figure 21-11: Annual Workforce Levels (Average)

Figure 21-12: Annual Workforce Levels (by type)
21.4.6 General Consumables and Supplies costs
General Operations costs
The Scotia Mine's location near Halifax (Nova Scotia) enables lower inventory levels of consumables and supplies to be stored on site before use, and importantly the purchase of a large majority of items at regular prices without the added on costs and logistics of remote freight transport costs. The mine's year-round access to permanent highways, ports and rail facilities ensures that the major of supplies can be received reliably.
ScoZinc warehouse is approximately 80% full of a range of consumables and supplies.
For mining operations, the major consumables and supplies required include mobile equipment parts and tires, drilling & blasting, dewatering supplies, and general planning consumables for ScoZinc's technical and supervisory controls. ScoZinc will contract the mobile mining equipment supplier to also supply the necessary parts (as needed) for their equipment under a defined maintenance plan and cost agreement (or MARC). For drilling and blasting operations, the Drill & Blast contract will provide the consumables necessary to complete their work on site also under a services cost agreement.
For processing operations, mill consumables and supplies are determined largely by a stead-state processing throughput rate of 2,700 tonnes per day. ScoZinc and Ausenco have determined the requirements and costs on this basis for the mill including power, grinding media, equipment wear parts, water treatment, reagent chemicals, plus additional general processing supplies.
21.4.7 Power costs
Electrical 25kV grid power is the predominant source of power on site, consumed primarily by the mill for all its processing requirements. Mining operations also use a limited amount of power for pit dewatering and pit
perimeter wells. The mine site currently uses grid power for its administration and support services buildings, although ScoZinc are planning on installing a 40KW Photovoltaic (PV) system to provide those energy requirements in the future.
All electrical power is currently provided by Nova Scotia Power on a range of Industrial Tariff rates. ScoZinc is currently on a Small Industrial Tariff during care & maintenance, but will return to the Large Industrial Tariffs rate (Rate Code 23) during the production phase of operations. All power costs for ScoZinc are based on Rate Code 23 onwards which includes both a Demand Charge (\$11.675/kWh) and an Energy Charge (\$8.987/kWh).
Life of Mine site power distribution for mining and processing operations is provided below.

Figure 21-13: Annual Power Distribution

Mining operations will demand the majority of the diesel fuel needed on site utilized on the mobile mining fleet. Diesel fuel consumption has been determined for all mobile equipment throughout the mine life, with diesel rack rates and delivery to site provided by Imperial Oil. ScoZinc have used a delivered price of \$1.00 per litre of diesel less a Nova Scotia provincial rebate of 15 cents per litre.
Annual diesel consumption costs for the life of mine production needs are provided in the figure below.

Figure 21-15: Annual Diesel Consumption Costs
21.4.9 Concentrate transport costs
The cost of transporting the ScoZinc concentrates from the Scotia Mine to the Fairview Cove Container Terminal in Halifax ("Fairview Cove") is calculated to have a unit cost of \$7.50 per wet metric tonne (wmt) of zinc or lead concentrate. This transport unit cost includes the round-trip distance of approximately 130 kilometres by highway between the mine gate and the Fairview Cove, road fees, insurance, fuel and labour costs.
ScoZinc will purchase, maintain and manage a flat-bed container transport truck capable of carrying up to a 25-tonne payload of concentrate, which will transport concentrate both laiden and un-laiden containers directly to and from the Fairview Cove.
Zinc and Lead concentrate production rates forecast that a total of 200 containers are nominally required for transport each month on average for the mine life. With a round-trip journey time of 1.5 hours (average), 10 containers will only need to be transported per day, 5-days per week.
The container transport monthly frequency is provided in the figure below.

Figure 21-16: Container Transport Frequency
Figure 21-17: Container Transport Costs

For shipping costs of the containers to the potential concentrate buyers, ScoZinc has allowed European ocean freight and Fairview Cove charges (berthage, wharfage, load out and assay charges) of \$69 per wet metric tonne of zinc or lead concentrate.
Depending upon alternative concentrate buyer requirements, the containerized concentrates may also be transported a shorter distance to the CN Railway Milford siding (11 kilometres from the mine gate), for container loading onto a train for cost effective rail transport to the buyer on the North American railway network. ScoZinc has not determined these transport costs, however, it is very likely that the costs will generally be lower than the forecast total transport and shipping costs to European concentrate buyers.
22 Economic Analysis
Note: Item 22 has no change from Previous NI43-101 Technical Report by Carew, et al, 2020
22.1 Summary of Economic Results
The economic viability of the Scotia Mine was evaluated using industry standard discounted cash flow analysis, by month for the life of mine. Inflation and escalation variables were not applied in the cash flow modelling process. All amounts are expressed in Canadian Dollars, except where noted. The key parameters and assumptions applied in the base-case cash flow model and a summary of the economic results are provided in the following table.
| Mine and Mill Parameters | ||||||
|---|---|---|---|---|---|---|
| Total ore mined (million tonnes) | 13.65 | Milling rate (tonnes / | day) | 2,700 | ||
| Mining rate (tonnes per day) | 33,000 | Zinc concentrate (tonnes / | year) 5Yr avg | 33,313 | ||
| Life of Mine (years) | 14.25 | Lead concentrate (tonnes / | year) 5Yr avg | 10,189 | ||
| Life of Mine Statistics | ||||||
| Metal production | Ore Grade (First 5 Years) |
Ore Grade (LOM) |
Recoveries (LOM) |
Metal Payability |
||
| Zinc | 2.25% | 2.03% | 86% | 35M lbs1 | 85% | |
| Lead | 0.82% | 1.10% | 89% | 15M lbs1 | 95% | |
| Project Assumptions Base Case | ||||||
| Zinc price (Yr. | 1 avg) | US\$1.16/lb. | All proven and probable mineral reserves | |||
| Zinc price (LOM avg) | US\$1.20/lb. | Exchange Rate (USD:CAD) | 0.71 | |||
| Lead price (Yr. | 1 avg) | US\$0.83/lb. | Discount Rate (base-case) | 8% | ||
| Lead price (LOM avg) | US\$0.90/lb. | Discount Rate (alternative) | 5% | |||
| Operating and Capital Costs | ||||||
| Operating Costs2 | LOM | Capital Costs | LOM | |||
| Mining | \$1.81/t mined | Pre-production capital expenditure | \$28.1M | |||
| Mining | \$20.26/t milled | Contingency | \$2.7M | |||
| Processing | \$11.29/t milled | Total | \$29.7M | |||
| G&A | \$2.27/t milled | Working capital (incl. ownership costs) |
\$5.0M | |||
| \$19.89/t milled | \$12.8m | |||||
| Note 1: Metals contained in both lead and zinc concentrates Note 2: Includes concentrate trucking, port and ocean shipping charges Note 3: Includes all treatment charges and royalties Note 4: After Lead credits deducted |
||||||
| Economic Results | Pre-Tax | Post-Tax | ||||
| Internal Rate of Return | 52.3% | 48.6% | ||||
| Ownership/financing costs | \$4.6M | |||||
| Payback period (from | first revenue) | 2.4 years | ||||
| Average annual EBITDA | \$17.1M | |||||
| TC & Freight3 Total |
Net Present Value @ 8% discount rate Net Present Value @ 5% discount rate |
\$53.72/t milled | Sustaining Capital C1 Cash Cost4 \$156.4M \$205.8M |
US\$0.59/lb \$114.5M \$150.4M |
Table 22-1: Economic Results Summary
Rounding note: Rounding of numbers may influence statistic totals.
22.2 Cash Flow Model Cost Sources
This NI 43-101 Technical Report contains forward-looking information regarding projected mine production rates, pre-production schedules and forecasts of resulting cash flows. Although ScoZinc has completed considerable planning and cost estimation and independent quotations from a number of equipment and labour suppliers for the brown-fields Scotia Mine, some factors such as the ability to obtain major equipment or skilled labour on a timely basis, or to achieve the planned mine production rates at the assumed grades, or to achieve the forecast capital and operating costs, may cause actual results to differ materially from those presented in this pre-feasibility economic analysis.
Capital and operating expenditures for the Scotia Mine have been developed in detail by month for the 14 year life of the project and are provided in the previous section of this Report (Section 21). Inputs from ScoZinc, Ausenco, and MineTech were all included in the cash flow model under the expertise of the relevant QPs.
22.3 Cash Flow Model Assumptions
22.3.1 Unit of Currency
All capital and operating expenditures in the cash flow model are expressed in Canadian Dollars ("\$C" or "CAD") as of May 2020, unless noted otherwise. Costs have not been inflated or escalated.
22.3.2 Metal Prices
Forecast Zinc and Lead metal prices applied in the base-case economic analysis are discussed in Section 19 (Market Studies) with summaries of the applied prices provided below. Due to the project execution strategies adopted in Chapter 24 (Other Relevant Data), the Scotia Mine cash flow model applies the forecast metal prices in sequential project year format. As such a proportion of each calendar-year forecast is applied to the project-year forecast. See tables below.
| Metal | Units | 2021 | 2022 | 2023 | Long term |
|---|---|---|---|---|---|
| Zinc | US\$/lb | \$1.14 | \$1.17 | \$1.17 | \$1.20 |
| US\$/tonne | \$2,513 | \$2,579 | \$2,579 | \$2,646 | |
| Lead | US\$/lb | \$0.84 | \$0.82 | \$0.81 | \$0.90 |
| US\$/tonne | \$1,852 | \$1,808 | \$1,786 | \$1,984 |
| Table 22-2: Forecast Metal Prices by Calendar Year | |
|---|---|
| ---------------------------------------------------- | -- |
| Metal | Units | Year 1 | Year 2 | Year 3 | Long term |
|---|---|---|---|---|---|
| Zinc | US\$/lb | \$1.16 | \$1.17 | \$1.19 | \$1.20 |
| US\$/tonne | \$2,557 | \$2,579 | \$2,624 | \$2,646 | |
| Lead | US\$/lb | \$0.83 | \$0.81 | \$0.88 | \$0.90 |
| US\$/tonne | \$1,830 | \$1,786 | \$1,940 | \$1,984 |
Table 22-3: Forecast Metal Prices by Project Year
22.3.3 Currency Exchange Rates
Forecast currency exchange rates between the Canadian and United States dollars were used at CAD 1.00 to USD 0.71, or CAD 1.41 to USD 1.00. The basis for this forecast is discussed in Section 19 (Market Studies).
22.3.4 Discount Rates
The base-case cash flow applied an 8 percent discount rate to the calculation of the Scotia Mine's Net Present Value ("NPV"). A discount rate of 5 percent was also provided for comparative purposes, with additional rate sensitivities evaluated.
22.3.5 Revenue timing
The sale of ScoZinc's concentrates are forecast to begin during the first month of commercial production due to the concentrate container handling process, however, ScoZinc has allowed for a lag in actual revenue of up to 6 weeks.
22.3.6 Working Capital
Due to the concentrate revenue lag, ScoZinc has estimated that a working capital allowance of \$5 million is sufficient to meet the Scotia Mine's cash flow requirements.
22.3.7 Project Finance
Due to the \$29.7M forecast capital requirement (including contingency) to commence commercial production and a working capital allowance of \$5.0M until the first concentrate sales are received, ScoZinc has assumed that the majority of its capital funding needs of \$29.7M will be provided by project finance mechanisms. Ownership costs for a revolving credit facility have been included in the cash flow model at a nominal interest rate of 8 percent per annum.
22.3.8 Other assumptions
Other economic assumptions used in the cash flow model include the following:
- ScoZinc's labour costs are paid within the month of occurrence
- Suppliers and contractors are paid within 30 days of invoicing
- Federal and Provincial value added sales taxes are not included.
All pre-development and sunk costs are excluded
22.4 Capital Expenditure
The capital expenditures determined to advance the Scotia Mine to commercial production within 6 to 11 months of project financing are estimated to be \$28.1 million. This includes all pre-production capital and contingencies but excludes working capital. The table below provides the capital expenditure requirements.
| Expenditure | Year -1 |
|---|---|
| Mining pre-stripping | \$8.1M |
| Mining capital costs | \$1.5M |
| Mill refurbishment | \$3.8M |
| Mill capital costs | \$8.5M |
| G&A equipment | \$1.1M |
| G&A capital costs | \$1.0M |
| Direct & Indirect capital costs | \$2.9M |
| Ownership costs | \$1.2M |
| Sub-Total | \$28.1M |
| Contingency | \$2.7M |
| Total | \$30.8M |
Additional capital expenditure details are provided in Section 21 (Capital and Operating Expenditure).
22.5 Sustaining Capital Expenditure
The Scotia Mine's sustaining capital expenditure from the commercial production date (Month 1, Year 1) for the remainder of the mine life (Month 166, Year 14) is forecast in the cash flow model to be \$9.6M including contingency and equipment salvage at the end of the mine life. The table below shows the sustaining capital costs by key cost centre.
| Expenditure | LOM |
|---|---|
| Mining capital costs | \$2.5M |
| Mill capital costs | \$1.6M |
| G&A capital costs | \$0.7M |
| Direct & Indirect costs | \$0.8M |
| Ownership costs | \$3.4M |
| Sub-Total | \$9.0M |
| Contingency | \$0.6M |
| Salvage | (\$2.0M) |
| Total | \$7.6M |
Table 22-5: Sustaining Capital Expenditure Summary
Additional sustaining capital expenditure details are provided in Section 21 (Capital and Operating Expenditure).
22.6 Operating Expenditure
The Scotia Mine's unit operating costs are expressed in the following table for the Life of Mine.
| Production Statistics | LOM |
|---|---|
| Total tonnes Mined | 153,211,226 |
| Total tonnes Milled (or Processed) | 13,653,761 |
| Expenditure | LOM |
| Mining | \$1.81/t mined |
| Mining | \$20.26/t processed |
| Processing | \$11.29/t processed |
| G&A | \$2.27/t processed |
| TC & Freight | \$19.89/t processed |
| Total Unit Operating cost |
\$53.72/t processed |
| C1 Cash Cost | US\$0.59/lb Zinc |
Table 22-6: Unit Operating Expenditure
Additional operating expenditure details are provided in Section 21 (Capital and Operating Expenditure).
22.7 Concentrate Sale terms
ScoZinc has a concentrate sales agreement with MRI for the sale of ScoZinc's zinc and lead concentrates. The sales agreement establishes confidential commercial terms for the majority of ScoZinc's annual production. ScoZinc is also able to negotiate other sales agreements for the balance of its concentrate production.
In general, concentrate sale agreements will account for all of the planned production of both zinc and lead concentrate for at least the first five years of operations. The sales agreements will also include treatment charges, as agreed between major smelters and major miners. ScoZinc has applied current and forecast treatment charges to its cash flow model as provided in Section 19 of this report (See Market Studies & Contracts).
In addition, payables, penalties (if any) and quotation periods will be negotiated in good faith annually, including industry standard penalties based on the terms and agreed limits specified in ScoZinc's sales agreements.
Treatment and refining charges, including deductibles and penalties, are expected to vary with each smelter location as well as each individual smelter terms and conditions. ScoZinc believes it is unnecessary to include any significant penalties for ScoZinc's zinc and lead concentrate in the cash flow model in this Pre-Feasibility Study since past production from the Scotia Mine has proven the high-quality nature of ScoZinc's carbonate hosted zinc and lead concentrates to be substantially free of any deleterious minerals. As such, ScoZinc's concentrate is considered to be high-ranking and therefore capable of being blended with lower-ranking concentrates from other mining operations at particular smelters. As a result, ScoZinc's concentrate is expected to attract lower treatment and refining charges.
The following concentrate marketing assumptions have been applied in the cash flow model:
Concentrates will be loaded on site directly into standard 20' lined shipping containers;
Each shipping container will be transported from the mine site by road to the Fairview Cove Container Terminal a distance of 62 km, or alternatively, to the Milford CN Railway Siding, a distance of 11km from the mine site;
- Smelters are located in North America or Europe; and
- Each container shall hold approximately 20 tonnes (wmt) of either zinc or lead concentrate.
In order to develop indicative smelter terms for the Pre-Feasibility Study cash flow model, ScoZinc has used past production statistics and offtake agreements for both its zinc and lead concentrates.
Other than a small potential penalty for the amount of Cadmium in the Zinc Concentrate, the Scotia Mine's Zinc and Lead concentrates are free of any smelter charge penalties.
A summary of the indicative smelter terms and charges for the Scotia Mine producing concentrate from Q3 2021 are provided below to demonstrate the high-quality, clean nature of ScoZinc's concentrates.
| Payables | Life of Mine | ||||||
|---|---|---|---|---|---|---|---|
| Zinc | Pay for 85% of the final Zinc content | ||||||
| Deductions | Year 1 | Year 2 Year 3 |
Rest of Mine Life | ||||
| Treatment Charges | US\$225/dmt | US\$250/dmt | US\$250/dmt | US\$250/dmt | |||
| Penalties | Life of Mine | ScoZinc | |||||
| Antimony | US\$1.50 for each 0.1% dmt above 0.3% | No Penalty | |||||
| Arsenic | US\$1.50 for each 0.1% dmt above 0.3% | No Penalty (0.02%) | |||||
| Cadmium | US\$2.00 for each 0.1% dmt above 0.25% | 0.38% | |||||
| Fluorine & Chlorine | US\$1.50 for each 100 ppm above 200 ppm | No Penalty (<50) | |||||
| Mercury | US\$1.75 for each 100 ppm above 100 ppm | No Penalty (<5) | |||||
| Lead | US\$1.50 for each 1% dmt above 3% | No Penalty (1.43%) | |||||
| Silica | US\$1.50 for each 1% dmt above 3% | No Penalty (0.75%) |
Table 22-7: Zinc Concentrate Indicative Smelter Charges
Table 22-8: Lead Concentrate Indicative Smelter Charges
| Payables | Life of Mine | ||||||
|---|---|---|---|---|---|---|---|
| Lead | Pay for 95% of the final Lead content |
||||||
| Deductions | Year 1 | Year 2 Year 3 |
|||||
| Treatment Charges | US\$175/dmt | US\$175/dmt US\$185/dmt |
US\$185/dmt | ||||
| Penalties | Life of Mine Industry | ScoZinc | |||||
| Antimony | US\$1.50 for each 0.1% dmt above 0.3% | No Penalty | |||||
| Arsenic | US\$1.50 for each 0.1% dmt above 0.3% | No Penalty | |||||
| Cadmium | US\$2.00 for each 0.1% dmt above 0.25% | No Penalty | |||||
| Fluorine & Chlorine | US\$1.50 for each 100 ppm above 200 ppm | No Penalty | |||||
| Mercury | US\$1.75 for each 100 ppm above 100 ppm | No Penalty | |||||
| Silica | US\$1.50 for each 1% dmt above 3% | No Penalty | |||||
| Zinc | US\$1.50 for each 1% dmt above 5% | 7.60% |
22.8 Taxation and Royalties
The Scotia Mine is owned and operated by ScoZinc Limited, a Nova Scotia incorporated company. ScoZinc is therefore subject to the three-tiered Canadian taxation system of Federal income taxation, Provincial income taxation, and Provincial mining taxation. The Scotia Mine is also subject to a Nova Scotian royalty system. ScoZinc Limited is owned by ScoZinc Mining Ltd., a British Columbia incorporated company.
A list of applicable taxations and royalties rates is provided below effective January 1, 2020:
- Federal income tax: 15% of taxable income
- Provincial income tax: 16% of taxable income
- Provincial royalty: 2% net revenue
22.8.1 Federal taxation
A Canadian Federal income tax rate of 15.0% was used to calculate income taxes in the cash flow model.
22.8.2 Provincial taxes
A Nova Scotia income tax rate of 16.0% was used to calculate provincial income taxes in the cash flow model.
22.8.3 Property taxes
ScoZinc owns the lands and surface rights for the Scotia Mine consisting of 22 separate real property titles. Taxes paid in 2019 total approximately \$50,000.
22.8.4 Mineral Property Tax Pools
Canadian Exploration Expense ("CEE") and Canadian Development Expense ("CDE") tax pools were used with applicable opening balances to calculate income taxes.
22.8.5 Federal Investment Tax Credits
ScoZinc applied Federal Investment Taxation Credits on its opening balances for the first month of commercial concentrate production. The Federal Investment tax credits apply to the pre-production capital costs of the Scotia Mine.
22.8.6 Capital Cost Allowance
The Canadian Federal Capital Cost Allowance ("CCA") yearly deduction rates were used to calculate the applicable CCA deduction amount ScoZinc can claim during the mine life.
22.8.7 Provincial Royalties
A Nova Scotian Provincial royalty of 2% net revenue applies to the life of mine.
22.8.8 Landowner Royalties
For the Scotia Deposit, ScoZinc owns the real property covering all the defined mineral resources on the mining leases, so no royalty to any landowner is applicable. However, there is a small 25-acre portion on ScoZinc's real property that is subject to sand, gravel and fill royalty of \$1.00 per metric tonne to Gallant Aggregates. This royalty does not impact the Scotia Mine's pre-feasibility study.
For the Getty deposit, ScoZinc has a 1% Gross Metal Return Royalty ("GMR") payable to Globex Resources Ltd ("Globex"), which provides Globex a royalty interest in the associated claims. Agreement terms also allow ScoZinc to purchase 50% of the GMR for \$300,000. ScoZinc's Life of Mine plan indicates that such a royalty would only be applicable in the last few years of the 14-year mine life.
22.8.9 Workforce burden
ScoZinc plans to implement a health insurance plan for the permanent employees at the Scotia Mine. Accordingly, ScoZinc has allowed for up to \$2,800 per annum for employees with dependents, and up to \$1,500 per annum for employees without dependents. The budgeted allowance is estimated to be \$350,000 per annum.
The Scotia Mine is also able to obtain the Nova Scotia Workers' Compensation insurance, which has an average assessment rate of \$2.65 per \$100 of monthly payroll. The budgeted allowance is estimated to be \$365,000 per annum.
Based upon the total annualized workforce numbers, payroll taxes are estimated to be \$3.2 million per annum.
Including additional amounts for potential incentive plans and overtime, the total annual workforce burden is estimated to be \$4.0 million, which equates to a workforce burden of approximately 44.5% per employee.
22.9 Cash Flow Financial Results
A summary of the cash flow financial results is provided in the table below for both before and after taxation is paid.
The cash flow model average annual production of approximately 33,313 tonnes of zinc concentrate (35 million pounds) and 10,189 tonnes of lead concentrate (15 million pounds), yielding an average annual earnings before interest, taxes, depreciation and amortization ("EBITDA") of \$17.1 million per year and cumulative EBITDA earnings of \$353 million over a mine life of 14 years. Due to the Scotia Mine's potential for commercial production in the short term, both short-term and long-term metal price forecasts have been applied.
| Financial Analysis | Before-Tax | After-Tax | |||
|---|---|---|---|---|---|
| NPV (8% discount rate) | \$156.4M | \$114.6M | |||
| NPV (5% discount rate) | \$205.8M | \$150.4M | |||
| IRR | 52.3% | 48.6% | |||
| EBITDA (annual average) | \$17.1M | ||||
| Payback period | 2.4 years |
Table 22-9: Cash flow Financial Results
22.10 Economic Analysis
The Base Case economic model has been developed using both short term metal price assumptions of US\$1.16/lb zinc, US\$0.88/lb lead, plus and long-term metal price assumptions of US\$1.20/lb zinc, US\$0.90/lb lead. The short term metal pricing is based on present market conditions anticipated for the first few years of production which naturally reduces the potential earnings of the project, however ScoZinc is of the view that this approach represents a realistic approach since the Scotia Mine has the potential of commercial production within the short term.
The metal price assumptions used in this study are based on market consensus for the long-term prices of zinc and lead, including Sell-Side Mining Research, published by different investment banks, in Canada and internationally, and studies by independent consultants such as Wood Mackenzie Ltd., Fastmarkets MB, S&P Global Market Intelligence and Open Mineral AG, among others, as discussed on Section 19.
A sensitivity analysis was conducted on the project's base cash flow model ("Base Case") to evaluate its robustness against variations in financial parameters that contribute the most to economics of the project. Key financial parameters varied for the Base Case were metal prices and the exchange rate to the United States dollar. Results of the analyses are provided in the tables below.
| Zinc/Lead | NPV Pre-Tax | NPV After-Tax | IRR | Payback | Average | |||
|---|---|---|---|---|---|---|---|---|
| Price US\$/lb | 5% discount |
8% discount |
5% discount |
8% discount |
Pre-Tax | After-Tax | Period | Annual EBITDA |
| 0.95/0.75 | \$63M | \$67M | \$35M | \$53M | 19.8% | 19.9% | 5.3yrs | \$7.3M |
| 1.00/0.80 | \$72M | \$101M | \$55M | \$77M | 28.8% | 26.9% | 4.8yrs | \$9.7M |
| 1.05/0.85 | \$100M | \$136M | \$75M | \$101M | 36.8% | 34.3% | 4.0yrs | \$12.1M |
| Base Case | \$156M | \$205M | \$115M | \$150M | 52.3% | 48.6% | 2.4yrs | \$17.1M |
| 1.20/0.90 | \$162M | \$212M | \$119M | \$155M | 57.1% | 53.1% | 1.9yrs | \$17.4M |
| 1.25/0.95 | \$190M | \$246M | \$138M | \$179M | 66.1% | 61.1% | 1.7yrs | \$19.9M |
| 1.30/1.00 | \$217M | \$280M | \$157M | \$202M | 75.3% | 69.1% | 1.4yrs | \$22.3M |
Table 22-10: Metal Price Sensitivities Analysis
* Scotia Mine Base Case: Year 1 average (US\$1.16/lb Zn, US\$0.83/lb Pb), LOM average (US\$1.20/lb Zn, US\$0.90/lb Pb)
| Exchange | NPV Pre-Tax | NPV After-Tax | IRR | Payback | Average | |||
|---|---|---|---|---|---|---|---|---|
| rate CAD:USD |
5% discount |
8% discount |
5% discount |
8% discount |
Pre-Tax | After-Tax | Period | Annual EBITDA |
| 0.55 | \$295M | \$377M | \$211M | \$269M | 96.8% | 86.7% | 1.2yrs | \$29.3M |
| 0.60 | \$244M | \$314M | \$176M | \$226M | 79.7% | 72.8% | 1.4yrs | \$24.8M |
| 0.65 | \$200M | \$260M | \$145M | \$188M | 65.8% | 60.7% | 1.8yrs | \$20.1M |
| 0.71* | \$156M | \$205M | \$115M | \$150M | 52.3% | 48.6% | 2.4yrs | \$17.1M |
| 0.75 | \$131M | \$174M | \$97M | \$128M | 44.8% | 41.6% | 3.1yrs | \$14.9M |
| 0.80 | \$103M | \$139M | \$77M | \$104M | 36.7% | 34.1% | 4.0yrs | \$12.5M |
| 0.85 | \$78M | \$109M | \$59M | \$82M | 29.7% | 27.7% | 4.8yrs | \$10.2M |
Table 22-11: Exchange Rate Sensitivities Analysis
* Scotia Mine Base Case
A spider sensitivity diagram showing the project's IRR sensitivities to metal prices, foreign exchange rate, capital cost and operating cost is provided below on a post-taxation basis.
The sensitivity indicates that the project is most sensitive to Exchange Rate, Zinc metal prices, and Zinc head grades. Conversely, the project is less sensitive to Zinc Treatment Charges, operating costs, capital expenditure, and Lead prices.

Figure 22-1: Post-Taxation Sensitivity Diagram
| MINING | |||||||||||||||||
|---|---|---|---|---|---|---|---|---|---|---|---|---|---|---|---|---|---|
| Material Mined | Year -1 | Year 1 | Year 2 | Year 3 | Year 4 | Year 5 | Year 6 | Year 7 | Year 8 | Year 9 | Year 10 | Year 11 | Year 12 | Year 13 | Year 14 | TOTAL | |
| SHG Ore | tonnes | 1,464 | 6,249 | 0 | 1,146 | 8,855 | 10,437 | 13,698 | 1,454 | 8,761 | 5,719 | 7,460 | 1,448 | 8,828 | 0 | 0 | 75,519 |
| Zn% | grade | 5.26 | 3.91 | 0.00 | 11.69 | 12.17 | 9.75 | 6.31 | 2.27 | 3.56 | 4.54 | 1.05 | 6.48 | 6.46 | 0.00 | 0.00 | 6.31 |
| Pb% | grade | 0.00 | 10.00 | 0.00 | 8.57 | 8.84 | 6.13 | 5.57 | 8.34 | 8.61 | 6.70 | 12.58 | 4.91 | 7.21 | 0.00 | 0.00 | 7.84 |
| HG Ore | tonnes | 20,577 | 187,952 | 195,185 | 94,076 | 153,577 | 257,980 | 405,561 | 163,323 | 265,020 | 203,483 | 137,156 | 202,986 | 217,106 | 64,693 | 154,551 | 2,723,227 |
| Zn% | grade | 3.48 | 3.98 | 3.36 | 3.33 | 3.59 | 3.49 | 3.35 | 2.61 | 3.18 | 3.08 | 2.56 | 3.41 | 3.87 | 2.61 | 2.43 | 3.28 |
| Pb% | grade | 0.00 | 1.44 | 1.88 | 1.57 | 1.75 | 2.06 | 2.42 | 2.61 | 2.41 | 2.87 | 3.26 | 2.06 | 2.05 | 2.24 | 2.92 | 2.26 |
| MG Ore | tonnes | 98,887 | 498,649 | 570,902 | 512,584 | 571,976 | 390,314 | 588,654 | 504,904 | 468,701 | 506,900 | 519,024 | 381,874 | 519,728 | 536,699 | 402,066 | 7,071,863 |
| Zn% | grade | 2.43 | 2.23 | 2.08 | 2.16 | 2.02 | 2.09 | 1.96 | 1.87 | 1.93 | 1.69 | 1.70 | 1.93 | 1.65 | 1.42 | 1.67 | 1.89 |
| Pb% | grade | 0.00 | 0.53 | 0.73 | 0.61 | 0.83 | 0.92 | 0.93 | 0.93 | 0.97 | 1.18 | 1.00 | 1.03 | 1.04 | 1.23 | 1.20 | 0.92 |
| LG Ore | tonnes | 61,642 | 264,664 | 257,202 | 370,274 | 344,475 | 117,166 | 265,572 | 187,026 | 276,669 | 308,778 | 353,397 | 144,648 | 272,616 | 391,320 | 167,704 | 3,783,153 |
| Zn% | grade | 1.63 | 1.48 | 1.48 | 1.49 | 1.35 | 1.28 | 1.34 | 1.25 | 1.25 | 1.30 | 1.25 | 1.25 | 1.15 | 0.96 | 1.07 | 1.29 |
| Pb% | grade | 0.00 | 0.27 | 0.29 | 0.26 | 0.40 | 0.50 | 0.42 | 0.54 | 0.50 | 0.46 | 0.50 | 0.49 | 0.61 | 0.81 | 0.67 | 0.47 |
| Total Ore | tonnes | 182,570 | 957,515 | 1,023,289 | 978,080 | 1,078,883 | 775,897 | 1,273,484 | 856,706 | 1,019,150 | 1,024,880 | 1,017,038 | 730,956 | 1,018,279 | 992,712 | 724,321 | 13,653,761 |
| Zn% | grade | 2.30 | 2.38 | 2.18 | 2.03 | 2.11 | 2.54 | 2.32 | 1.88 | 2.09 | 1.86 | 1.66 | 2.22 | 2.03 | 1.32 | 1.69 | 2.03 |
| Pb% | grade | 0.00 | 0.70 | 0.84 | 0.58 | 0.89 | 1.30 | 1.35 | 1.17 | 1.28 | 1.33 | 1.22 | 1.22 | 1.20 | 1.13 | 1.45 | 1.10 |
| Overburden | tonnes | 4,055,012 10,422,451 8,994,179 11,022,075 8,846,942 7,832,946 5,448,424 6,757,227 6,104,887 4,869,946 5,587,802 3,451,941 3,533,442 2,706,248 | 490,752 | 90,124,277 | |||||||||||||
| Gypsum | tonnes | 207,378 | 1,699,040 2,732,543 | 164,119 | 1,623,181 2,835,011 3,400,032 2,971,662 3,014,604 | 1,936,094 | 1,992,826 2,899,818 | 1,887,474 | 1,082,202 2,406,352 | 30,852,336 | |||||||
| Carbonate | tonnes | 347,826 | 988,672 | 774,064 | 1,520,388 | 1,692,535 | 455,919 | 919,940 | 1,431,601 | 1,199,939 | 730,244 | 996,972 | 261,185 | 653,599 | 1,513,192 | 485,090 | 13,971,167 |
| Meguma | tonnes | 0 | 167,321 | 437,925 | 222,506 | 252,457 | 327,725 | 699,620 | 296,398 | 311,419 | 313,366 | 167,170 | 686,100 | 182,472 | 34,646 | 510,559 | 4,609,685 |
| Total Mine Production | tonnes | 4,792,786 14,235,000 13,962,000 13,907,169 13,494,000 12,227,500 11,741,500 12,313,594 11,650,000 8,874,529 9,761,808 8,030,000 7,275,267 6,329,000 4,617,075 153,211,226 | |||||||||||||||
| Total Ore | tonnes | 182,570 | 957,515 | 1,023,289 | 978,080 | 1,078,883 | 775,897 | 1,273,484 | 856,706 | 1,019,150 | 1,024,880 | 1,017,038 | 730,956 | 1,018,279 | 992,712 | 724,321 | 13,653,761 |
| Total Waste | tonnes | 4,610,216 13,277,485 12,938,711 12,929,089 12,415,116 11,451,602 10,468,016 11,456,888 10,630,849 7,849,649 8,744,771 7,299,044 6,256,988 5,336,288 3,892,754 139,557,465 | |||||||||||||||
| Total Strip Ratio | ratio | 25.25 | 13.87 | 12.64 | 13.22 | 11.51 | 14.76 | 8.22 | 13.37 | 10.43 | 7.66 | 8.60 | 9.99 | 6.14 | 5.38 | 5.37 | 10.22 |
| PROCESSING | |||||||||||||||||
| Ore Processed | Year -1 | Year 1 | Year 2 | Year 3 | Year 4 | Year 5 | Year 6 | Year 7 | Year 8 | Year 9 | Year 10 | Year 11 | Year 12 | Year 13 | Year 14 | TOTAL | |
| Total Mill Grind | tonnes | 0 | 970,500 | 985,500 | 985,500 | 988,200 | 985,500 | 985,500 | 985,500 | 988,200 | 985,500 | 985,500 | 985,500 | 988,200 | 985,500 | 849,161 | 13,653,761 |
| Zn Grade | grade | 0.00 | 2.31 | 2.27 | 2.10 | 2.09 | 2.35 | 2.35 | 2.00 | 2.00 | 2.00 | 1.82 | 1.91 | 1.90 | 1.58 | 1.63 | 2.03 |
| Zn tonnes | tonnes | 0 | 22,403 | 22,409 | 20,696 | 20,693 | 23,153 | 23,177 | 19,710 | 19,764 | 19,710 | 17,911 | 18,812 | 18,776 | 15,543 | 13,848 | 276,603 |
| Pb Grade | grade | 0.00 | 0.61 | 0.86 | 0.66 | 0.80 | 1.18 | 1.37 | 1.27 | 1.18 | 1.40 | 1.42 | 0.99 | 1.14 | 1.28 | 1.34 | 1.10 |
| Pb tonnes | tonnes | 0 | 5,952 | 8,498 | 6,521 | 7,907 | 11,447 | 13,225 | 12,549 | 11,703 | 13,808 | 13,870 | 9,698 | 11,300 | 12,627 | 11,360 | 150,467 |
Table 22-12: Cash flow Model Detail
MineTech International Limited NI 43-101 Technical Report, Scotia Mine Effective Date: March 22nd, 2021 Zn tonnes tonnes 0 22,403 22,409 20,696 20,693 23,153 23,177 19,710 19,764 19,710 17,911 18,812 18,776 15,543 13,848 276,603 Pb Grade grade 0.00 0.61 0.86 0.66 0.80 1.18 1.37 1.27 1.18 1.40 1.42 0.99 1.14 1.28 1.34 1.10 Pb tonnes tonnes 0 5,952 8,498 6,521 7,907 11,447 13,225 12,549 11,703 13,808 13,870 9,698 11,300 12,627 11,360 150,467
| SALES | |||||||||||||||||
|---|---|---|---|---|---|---|---|---|---|---|---|---|---|---|---|---|---|
| Metal production | Year -1 | Year 1 | Year 2 | Year 3 | Year 4 | Year 5 | Year 6 | Year 7 | Year 8 | Year 9 | Year 10 | Year 11 | Year 12 | Year 13 | Year 14 | TOTAL | |
| Zinc Concentrate | tonnes | 0 33,903 |
34,327 | 31,330 | 31,294 | 35,714 | 35,785 | 29,635 | 29,716 | 29,635 | 26,612 | 28,115 | 28,040 | 22,728 | 20,311 | 417,144 | |
| Lead Concentrate | tonnes | 0 7,461 |
10,696 | 8,104 | 9,953 | 14,732 | 17,210 | 16,279 | 15,072 | 18,035 | 18,248 | 12,349 | 14,495 | 16,356 | 15,014 | 194,004 | |
| Zinc Recovery | percentage | 0.0% | 85.4% | 87.3% | 86.3% | 86.2% | 87.8% | 87.8% | 85.7% | 85.7% | 85.7% | 84.7% | 85.2% | 85.1% | 83.3% | 82.8% | |
| Lead Recovery | percentage | 0.0% | 87.8% | 89.3% | 88.1% | 88.9% | 91.1% | 92.2% | 91.8% | 91.2% | 92.5% | 92.6% | 90.0% | 91.0% | 91.8% | 91.9% | |
| Recovered Zinc | tonnes | 0 19,165 |
19,566 | 17,858 | 17,838 | 20,357 | 20,397 | 16,892 | 16,938 | 16,892 | 15,169 | 16,026 | 15,983 | 12,955 | 11,577 | 237,612 | |
| Recovered Lead | tonnes | 0 5,252 |
7,594 | 5,754 | 7,066 | 10,460 | 12,219 | 11,558 | 10,701 | 12,805 | 12,956 | 8,768 | 10,291 | 11,613 | 10,660 | 137,698 | |
| Zn Metal Payable from Smelter percentage | 85.0% | 85.0% | 85.0% | 85.0% | 85.0% | 85.0% | 85.0% | 85.0% | 85.0% | 85.0% | 85.0% | 85.0% | 85.0% | 85.0% | 85.0% | ||
| Pb metal Payable from Smelter percentage | 95.0% | 95.0% | 95.0% | 95.0% | 95.0% | 95.0% | 95.0% | 95.0% | 95.0% | 95.0% | 95.0% | 95.0% | 95.0% | 95.0% | 95.0% | ||
| Payable Zinc | pounds | 0 35,913,565 36,665,508 33,464,519 33,426,254 38,147,472 38,223,052 31,654,271 31,740,996 31,654,271 28,424,984 30,030,826 29,950,704 24,276,566 21,695,116 445,268,105 | |||||||||||||||
| Payable Lead | pounds | 0 10,999,854 15,905,653 12,051,222 14,799,865 21,907,125 25,591,225 24,206,862 22,411,600 26,818,554 27,135,145 18,363,071 21,554,146 24,321,622 22,326,395 288,392,337 | |||||||||||||||
| Payable Zinc | tonnes | 0 16,290 |
16,631 | 15,179 | 15,162 | 17,303 | 17,338 | 14,358 | 14,397 | 14,358 | 12,893 | 13,622 | 13,585 | 11,012 | 9,841 | 201,970 | |
| Payable Lead | tonnes | 0 4,989 |
7,215 | 5,466 | 6,713 | 9,937 | 11,608 | 10,980 | 10,166 | 12,165 | 12,308 | 8,329 | 9,777 | 11,032 | 10,127 | 130,813 | |
| Zinc Price | C\$/pound | 1.61 | 1.64 | 1.65 | 1.68 | 1.69 | 1.69 | 1.69 | 1.69 | 1.69 | 1.69 | 1.69 | 1.69 | 1.69 | 1.69 | 1.69 | 1.68 |
| Lead Price | C\$/pound | 1.22 | 1.16 | 1.14 | 1.24 | 1.27 | 1.27 | 1.27 | 1.27 | 1.27 | 1.27 | 1.27 | 1.27 | 1.27 | 1.27 | 1.27 | 1.25 |
| Zinc Price | US\$/pound | 1.14 | 1.16 | 1.17 | 1.19 | 1.20 | 1.20 | 1.20 | 1.20 | 1.20 | 1.20 | 1.20 | 1.20 | 1.20 | 1.20 | 1.20 | 1.19 |
| Lead Price | US\$/pound | 0.87 | 0.83 | 0.81 | 0.88 | 0.90 | 0.90 | 0.90 | 0.90 | 0.90 | 0.90 | 0.90 | 0.90 | 0.90 | 0.90 | 0.90 | 0.89 |
| FINANCIALS | |||||||||||||||||
| Revenue | Year -1 | Year 1 | Year 2 | Year 3 | Year 4 | Year 5 | Year 6 | Year 7 | Year 8 | Year 9 | Year 10 | Year 11 | Year 12 | Year 13 | Year 14 | TOTAL | |
| Zinc Revenue | C\$'000 | 0 58,884 |
60,479 | 56,215 | 56,495 | 64,475 | 64,602 | 53,500 | 53,647 | 53,500 | 48,042 | 50,756 | 50,621 | 41,031 | 36,668 | 748,916 | |
| Lead Revenue | C\$'000 | 0 12,756 |
18,197 | 14,851 | 18,760 | 27,770 | 32,440 | 30,685 | 28,409 | 33,995 | 34,397 | 23,277 | 27,322 | 30,830 | 28,301 | 361,990 | |
| Metal Sales Revenue | C\$'000 | 0 71,640 |
78,677 | 71,066 | 75,255 | 92,244 | 97,042 | 84,185 | 82,056 | 87,496 | 82,439 | 74,033 | 77,943 | 71,861 | 64,969 | 1,110,906 | |
| less TC & Freight | C\$'000 | 0 18,878 |
21,259 | 18,971 | 18,524 | 22,380 | 23,324 | 20,060 | 19,655 | 20,706 | 19,348 | 17,894 | 18,647 | 16,808 | 15,166 | 271,620 | |
| Gross Revenue | C\$'000 | 0 52,762 |
57,418 | 52,095 | 56,732 | 69,864 | 73,718 | 64,125 | 62,400 | 66,790 | 63,091 | 56,139 | 59,296 | 55,054 | 49,803 | 839,286 | |
| Royalties Net Revenue |
C\$'000 | 0 1,055 0 |
1,148 | 1,042 | 1,135 | 1,397 | 1,474 | 1,282 | 1,248 | 1,336 | 1,262 | 1,123 | 1,186 | 1,629 | 1,097 | 17,415 | |
| C\$'000 | 51,707 | 56,269 | 51,053 | 55,597 | 68,467 | 72,244 | 62,842 | 61,152 | 65,454 | 61,829 | 55,016 | 58,110 | 53,424 | 48,705 | 821,871 | ||
| Mining Opex Mill Opex |
C\$'000 C\$'000 |
8,107 | 24,166 0 11,005 |
26,331 11,095 |
23,477 11,095 |
24,904 11,111 |
20,655 11,095 |
17,073 11,095 |
19,436 11,095 |
20,618 11,111 |
17,464 11,095 |
17,878 11,095 |
17,600 11,095 |
16,532 11,111 |
11,805 11,095 |
10,640 9,931 |
276,686 154,123 |
| Total Operating Expenses | C\$'000 | 8,107 | 35,171 | 37,426 | 34,572 | 36,015 | 31,749 | 28,168 | 30,531 | 31,729 | 28,559 | 28,973 | 28,695 | 27,643 | 22,900 | 20,572 | 430,810 |
| Gross Profit | C\$'000 | -8,107 | 16,536 | 18,843 | 16,481 | 19,582 | 36,718 | 44,075 | 32,311 | 29,423 | 36,895 | 32,856 | 26,322 | 30,467 | 30,525 | 28,134 | 391,061 |
| G&A | C\$'000 | 1,015 | 2,217 | 2,258 | 2,258 | 2,258 | 2,258 | 2,218 | 2,098 | 2,098 | 2,098 | 2,098 | 2,098 | 2,038 | 2,038 | 1,961 | 31,007 |
| EBITDA | C\$'000 | -9,122 | 14,319 | 16,585 | 14,223 | 17,324 | 34,460 | 41,858 | 30,213 | 27,325 | 34,798 | 30,758 | 24,224 | 28,429 | 28,487 | 26,173 | 360,054 |
| Property Capital | C\$'000 | 0 0 |
0 | 0 | 0 | 0 | 0 | 0 | 0 | 0 | -250 | 0 | 0 | 0 | 0 | -250 | |
| Financing Costs | C\$'000 | -1,167 | -2,173 | -1,113 | -123 | 0 | 0 | 0 | 0 | 0 | 0 | 0 | 0 | 0 | 0 | 0 | -4,577 |
| Capex (Pre-Prod/Sustaining) | C\$'000 | -17,811 | -3,146 | -600 | -395 | 0 | -90 | -867 | -840 | -320 | -882 | -320 | 0 | -100 | 0 | 2,000 | -23,371 |
| Contingencies | C\$'000 | -2,729 | -585 | 0 | 0 | 0 | 0 | 0 | 0 | 0 | 0 | 0 | 0 | 0 | 0 | 0 | 2,886 |
| Cash flow before taxes | C\$'000 | -30,829 | 8,415 | 14,872 | 13,705 | 17,324 | 34,370 | 40,991 | 29,373 | 27,005 | 33,916 | 30,188 | 24,224 | 28,329 | 28.487 | 28.173 | 334,742 |
| NPV @ 8% (before taxes) | C\$'000 | 156,376 | |||||||||||||||
| NPV @ 8% (after taxes) | C\$'000 | 114,555 | |||||||||||||||
| IRR | Percentage | 52% | |||||||||||||||
| EBITDA (average) | C\$/year | 17,145,417 | |||||||||||||||
| Cash Cost (average) TCC LOM (average) |
US\$/lb US\$/lb |
0.59 0.60 |
|||||||||||||||
| STATISTICS | |||||||||||||||||
| Operating Cash Costs | Year -1 | Year 1 | Year 2 | Year 3 | Year 4 | Year 5 | Year 6 | Year 7 | Year 8 | Year 9 | Year 10 | Year 11 | Year 12 | Year 13 | Year 14 | TOTAL | |
| Mining cost | \$/t mined | 1.69 | 1.70 | 1.89 | 1.69 | 1.85 | 1.69 | 1.45 | 1.58 | 1.77 | 1.97 | 1.83 | 2.19 | 2.27 | 1.87 | 2.30 | 1.81 |
| Mining cost | \$/t processed | 0.00 | 24.90 | 26.72 | 23.82 | 25.20 | 20.96 | 17.32 | 19.72 | 20.86 | 17.72 | 18.14 | 17.86 | 16.73 | 11.98 | 12.53 | 20.26 |
| Processing cost | \$/t processed | 0.0 | 11.3 | 11.3 | 11.3 | 11.2 | 11.3 | 11.3 | 11.3 | 11.2 | 11.3 | 11.3 | 11.3 | 11.2 | 11.3 | 11.7 | 11.29 |
| G&A | \$/t processed | 0.00 | 2.28 | 2.29 | 2.29 | 2.28 | 2.29 | 2.25 | 2.13 | 2.12 | 2.13 | 2.13 | 2.13 | 2.06 | 2.07 | 2.31 | 2.27 |
| TC & Freight | \$/t processed | 0.00 | 19.45 | 21.57 | 19.25 | 18.75 | 22.71 | 23.67 | 20.36 | 19.89 | 21.01 | 19.63 | 18.16 | 18.87 | 17.05 | 17.86 | 19.89 |
| Unit Costs | \$/t processed | 0.00 | 57.98 | 61.84 | 56.62 | 57.48 | 57.22 | 54.50 | 53.46 | 54.12 | 52.12 | 51.16 | 49.40 | 48.90 | 42.36 | 44.40 | 53.72 |
| C1 Cash Costs | US\$/lb | 0.00 | 0.87 | 0.83 | 0.87 | 0.81 | 0.55 | 0.41 | 0.50 | 0.56 | 0.39 | 0.41 | 0.60 | 0.50 | 0.32 | 0.24 | 0.59 |
| Total Cash Costs | US\$/lb | 0.00 | 0.96 | 0.85 | 0.88 | 0.81 | 0.55 | 0.44 | 0.52 | 0.57 | 0.42 | 0.43 | 0.60 | 0.50 | 0.32 | 0.24 | 0.60 |
23 Adjacent Properties
Note: Item 23 has no change from Previous NI43-101 Technical Report by Carew, et al, 2020
ScoZinc holds a number of adjacent exploration claims surrounding the Scotia Mine, including two prospects known as the Carrolls Farm prospect and the Carrolls Corner prospect. Both prospects have been explored and are known to host zinc and lead mineralization.
Located approximately 1.5 km and 2.2 km, respectively, along the south-western strike of the Scotia Mine, exploration program results have indicated that these prospects reflect a continuously mineralized trend of the Gays River Formation ("GRFM") carbonate bank complex at or near to surface. Although further extensions to the west have not been evaluated to date, both prospects have potential economic value as supplementary zinc and lead ore feed to the Scotia Mine. ScoZinc plans to conduct further exploration programs on these prospects for future mineral resource delineation.

Figure 23-1: Carrolls Farm and Carrolls Corner Prospects
24 Other Relevant Data
Note: Item 24 has no change from Previous NI43-101 Technical Report by Carew, et al, 2020
24.1 Mine Site Organization
The Scotia Mine organization structure has been established for a residential open-pit mining and concentrate processing operation in Canada. The ownership and management organizational structure for the Scotia Mine is provided in the figure overleaf, which shows key management positions and their operational business centres on the mine site. Existing offices, meeting rooms and washroom facilities are currently in place for all management and supervisory personnel.
24.1.1 Workforce Organization
The Scotia Mine workforce will be organized into three conventional departments, namely, mine, mill and administration. The major functions for each department are provided in the table below, as well as the chart of the workforce organization by department.
| Department | Key Functions |
|---|---|
| Mine | Mining operations |
| Mobile equipment maintenance | |
| Mine technical services | |
| Exploration | |
| Mill | Mill operations |
| Mill maintenance | |
| Metallurgy and laboratories | |
| Administration | Finance & general administration |
| Safety & training | |
| Human resources | |
| Procurement & Logistics |
Table 24-1: Scotia Mine Departments
Figure 24-1: Annual Average Workforce Levels


Figure 24-2: Ownership and Management Organizational Structure
24.1.2 Workforce Levels
Due to its convenient location in the Halifax Regional Municipality ("HRM"), the ScoZinc will operate the mine on a relatively-lean and highly-skilled workforce model. The Scotia Mine annual average workforce levels are provided in the figure below, with all personnel based within the HRM region.


From Year 1 onwards, the individual skilled and semi-skills positions within each Department are relatively stable starting at approximately 146. This number gradually increases to 165 after Year 4 due to additional equipment requirements for mining development.
The table overleaf shows the personnel numbers for role for each department for the first year of full commercial production.
| Department | Positions | Numbers |
|---|---|---|
| Mine | Mine Manager | 1 |
| Mine Superintendent | 1 | |
| Mobile Equipment Supervisor | 1 | |
| Chief Mining Engineer | 1 | |
| Senior Geologist | 1 | |
| Supervisors | 4 | |
| Trainers | 1 | |
| Surveyors | 1 | |
| General labourers | 2 | |
| Operators | 51 | |
| Utility/dewatering | 2 | |
| Samplers | 2 | |
| Mill | Mill Manager | 1 |
| Mill Foreman | 4 | |
| Senior Metallurgist | 1 | |
| Senor Assayer | 1 | |
| Operators | 28 | |
| Process water/utility | 0 | |
| Technicians | 4 | |
| Sample prep | 4 | |
| Trainer/Planner | 1 | |
| Millwrights | 6 | |
| Electricians | 3 | |
| Apprentices | 1 | |
| Administration | General Manager | 1 |
| Administration Manager | 1 | |
| Financial Controller | 1 | |
| Health & Safety Coordinator | 1 | |
| Environmental & Community Coordinator | 1 | |
| Procurement & Logistics Coordinator | 1 | |
| Accounts, HR, clerks & assistants | 6 | |
| Security guards | 3 | |
| Site services | 9 | |
| Total | 146 |
Table 24-2: Scotia Mine Positions (Year 1+)
24.1.3 Recruitment
ScoZinc intends to source the necessary skills and labour for its workforce from the Halifax Regional Municipality where the mine is located. Scotia Mine's administration department personnel will advertise and perform most of the recruitment processes, including the determination of salary and wage levels. External recruitment consultants may be engaged to recruit for positions that require certain skill sets not found locally.
24.2 Project Execution Strategy
ScoZinc personnel have completed preliminary plans and costings during the development of the Scotia Mine's life of mine plans as a detailed component to this Pre-Feasibility Study. Accordingly, ScoZinc has determined that a number of project execution phases are required for a successful commencement of commercial production, namely, a procurement phase, pre-commercial production phase, and a commercial production phase.
Due to ScoZinc's existing Environmental Assessment Approvals and Industrial Approvals, and high-level care and maintenance status, the Scotia Mine has however a relatively short time frame to commercial production of between 9 to 12 months. As such, the Scotia Mine is considered a near-term producer.
24.2.1 Procurement Phase
ScoZinc's Procurement Phase is the first phase of the Scotia Mine's re-start strategy, designed to provide final designs and pricing on a range of re-start requirements. Prices will be obtained via usual negotiation or formal fixed-price tenders.
Procurement items include the following:
- Jameson Cells and Filter Presses
- Primary 8MVA transformer
- Mobile mining fleet and support equipment
- Pit dewatering equipment
- Primary and Secondary crusher engineering and support equipment
- Crushing and grinding circuit equipment
- Cyclones system equipment
- Flotation circuit equipment
- Thickener tank equipment
- Concentrate handling facility equipment
- Air Compressors, Reagent systems, pumps, pipework and equipment
- Laboratory and sample preparation facility equipment
Ausenco has determined that the Jameson Cells (36 week lead time) and the Filter Presses (30-34 week lead time) are the major lead items that extend the whole processing implementation schedule to 11 – 12 months from just 4 months. ScoZinc however expects to reduce that time frame by upwards of 3 months by preordering immediately project financing has been committed, or alternatively, on the sale of certain current processing equipment not required under the new optimal processing systems determined in this prefeasibility study. ScoZinc anticipates that the advance lead item ordering would reduce the processing implementation schedule to 7-9 months, and the overall execution time period to 7-9 months.
Furthermore, ScoZinc has engaged a number of Nova Scotian equipment and labour suppliers, plus two international engineering companies to provide direct (or indirect) assistance with completing the procurement process over a 3 to 4-month timeframe. With the quantity of review and analysis on the Scotia Mine completed over the past 3 years, ScoZinc is of the view that a maximum procurement timeframe of 4 to 5 months is therefore highly plausible.
24.2.2 Pre-Commercial Production Phase
According to the life of mine plan, mining operations are scheduled to commence 5 months prior to commercial concentrate production in Year -1. The primary purpose of this lead time is to mine sufficient material from the pits to build a ROM ore stockpile for enable optimal ore grade blending and a sustained processing throughput of 2,700 tonnes per day after the 5th month. During this period, the mill refurbishment is also completed.
During the Pre-Production Phase, the Mine Department is scheduled to complete the following;
- Final commission of remaining mining equipment (1st Month)
- Recruitment and training of all mining personnel
- Full mining production operations by the 4th month of mine production
During the Pre-Production Phase of the plant, Ausenco has recommended and included in the PFS cash flow model that an engineering firm be engaged on an EPCM contract model basis to install the new equipment upgrades, with a construction management team ("CM") to self-perform the construction, i.e. the engineering firm will hire or subcontract specific contractors to undertake the installation of the works as part of the EPCM team. For the refurbishment and replacement of existing plant equipment, Ausenco recommends that an engineering firm provide an EP service for the upgrades, and ScoZinc will self-execute the installation work.
In summary, Ausenco estimates that the entire implementation schedule will take between 11 to 12 months, which includes a 3-4 month period of pre-engineering work and the completion of the following major items:
- Recruitment and training of processing plant personnel
- Installation of mobile primary crusher
- Installation of Secondary crusher and crushing infrastructure
- Installation of other crushing and grinding circuit upgrades
- Installation of the Jameson Cells
- Flotation circuit upgrades
-
Installation of concentrate filter presses
-
Completion of the concentrate load-out and concentration handling facility
- Installation of air compressors, reagent systems, and pumps
- Upgrade of laboratory and sample preparation equipment
- Soft commissioning
24.2.3 Commercial Production Phase
The Commercial concentrate Production Phase marks the 9th month completion of all preliminary and preproduction works to enable a consistent throughput of 2,700 tonnes per day. During the initial Commercial Production phase, the Scotia Mine is scheduled to complete the following over a 3-month period:
- Ramp up mill processing throughput and recoveries over a 3-month period
- Complete operational improvements to maintain 2,700 tonnes per day average throughput
During the 14-year mine life, it is expected that additional mill equipment and operational upgrades will be implemented to improve both throughput and recoveries. However, under the current life of mine plan and schedules, such potential improvements have not been included for the purposes of this Pre-Feasibility Study.
25 Conclusions
First, we repeat the conclusions from the 2020 Technical Report by Carrew et.al.
25.1 SRK Conclusions 2020 Technical
The December 2019 mineral resource update includes a total Measured and Indicated mineral resource of 25.4Mt at a Zn-equivalent grade of 2.84% (1.89% Zn and 0.99% Pb), at a cut-off grade of 0.9% Zn-equivalent. An additional Inferred mineral resource of 5.0 Mt at a Zn-equivalent grade of 2.13% (1.55% Zn and 0.66% Pb) is included.
Previous resource estimates were domained using a mineralized envelope (solid) within the carbonate material. Any mineralized carbonate material outside the domain was treated as zero grade carbonate waste. This had a negative impact on mine dilution. Previous production records show that most of the carbonate material from the hanging wall to the footwall contains mineralization to some degree. As a result, the approach taken with the new mineral resource was to domain the mineralization by lithology, where all composited assays inside the carbonate material were used in the block model grade interpolation. An optimized pit was then used to determine the reasonable prospects of eventual economic extraction of the new mineralized domain based on lithology.
Drill holes with missing intervals in between existing assay data in the same hole were assigned a background Pb & Zn % value, determined by statistical analysis, instead of being assigned a value of 0% as in previous estimates. This allows for a more realistic interpolation as it is known that most of the carbonate material is mineralized. In the case of drill holes that contained lithology information to construct the new mineralized domain but were missing all assay data, the grade interpolation was carried through over the missing intervals, but the affected volumes were classified as inferred resources.
There were 40 holes, located mostly in the North East zone, that were missing from the database that was used in previous mineral resource estimates. ScoZinc and SRK have found no reasoning as to why these holes were omitted. The 40 missing holes correspond well to the current geological model used in the new mineral resource estimate. Therefore, SRK used them in the new mineral resource estimate.
The topographic model ("topo") used to estimate the previous mineral resources in the main zone was recalculated. There was a portion of the current pit that was backfilled in 2009/2010 and the topo contains this backfill. When the previous mineral resource was calculated, this topo was used resulting in added mineralized tonnes as the backfill was occupying the same space that the in-situ carbonate mineralization once did. This has been corrected and an updated topo was used for the new mineral resource that accounts for the current carbonate mineralization conditions.
The area of carbonate reef between the Main Zone and the Getty Zone, now named Getty South, was not modelled in previous resource estimates despite a large amount of historic drilling in the area with mineralized intersects. The Getty South area carbonate is shallow with a horizontal orientation and a significantly lesser amount of overburden compared to the Main Zone with an average overburden thickness of 4 meters which has potential to support a low tonnage/low grade open pit. The Getty South area has been included in the new mineral resource estimate.
25.2 Ausenco Conclusions 2020 Technical Report
Historical metallurgical test data and plant operating data were reviewed to support study the engineering for the reopening of the ScoZinc operation. The data shows that high grade lead and zinc concentrates can be produced at high recoveries. The process plant design criteria have been selected according to the metallurgical data available are appropriate for a PFS level study. The process plant has been redesigned for a throughput of 0.99 Mt/a.
Throughout the development of the 2,700 t/d PFS, several opportunities and risks have been identified that are material to the project outcomes.
25.2.1 Processing Opportunities
- Conduct further testwork to identify ideal grind size for maximum floatation recovery performance. There is a potential to increase grind size therefore increase throughput with little to no capital expenditure.
- Conduct further financial simulations with varying life of mine and throughputs. There is an opportunity to further refine the economics of the project.
- Conduct a full refurbishment/replacement assessment on existing mill equipment. There is potential to save money on current high-level scoping cost assessment.
- Complete concentrate filtration tests to determine the optimal equipment selections. At the expected zinc and lead concentrate production rates, the use of one shared filter press is possible.
- Current market conditions in the process equipment sector have slowed down dramatically during the Covid-19 pandemic. There is an opportunity to reduce lead times on the long lead equipment. Namely the Jameson cells and the filter presses.
- There is an opportunity to procure a second-hand transformer. ScoZinc has identified a few local suppliers with an 8MVA transformer.
- There is an opportunity to defer the mechanical refurbishment and replacement costs over the first year of operations. Further investigation of equipment condition is required to understand which cost can be deferred.
- Reduce the schedule by procuring certified information for long lead equipment at the beginning of the project.
25.2.2 Mill Risks
Full assessment required for refurbishment/replacement costs. Current scoping estimate is based off high level review and ScoZinc quotations from vendors. In particular, it is recommended that a full detailed refurbishment/ replacement inspection be conducted to ensure that the three mills (one rod mill and 2 ball mills) have no hidden issues. Due to the lack of power supply to the mills, the mills were not turned to complete a full inspection program.
Lack of available skilled operators may prolong Mill ramp up. Development of training programs in advance of start-up is required to ensure production ramp up proceeds in an orderly manner.
25.3 Terrane Geotech Conclusions 2020 Technical Report
The Scotia Mine site is geotechnically and hydrogeologically challenging; however, with sufficient data collection, design, monitoring and maintenance, Terrane is of the opinion these challenges can be addressed. Overburden slopes on the site (up to 50 metres in height) are substantive and, without proper care and maintenance, could greatly affect open-pit development. Similarly, the gypsum and anhydrite are susceptible to ongoing weathering and erosion which could lead to rock mass instability with time.
From a hydrogeological perspective, ensuring drained conditions on-site in both the overburden and bedrock pit faces and waste pile will be important in maintaining the integrity of the pit slopes. Additionally, more work is required to address the location of Gays River in relation to open-pit development.
There are numerous historical underground workings present on site which would likely pose a hazard to the proposed open-pit development. Terrane's current assessment did not evaluate the effect of these workings on the proposed open-pit developments.
This study did not evaluate stable waste pile slopes and Terrane cautions using the overburden design herein. Overburden slopes around the open-pit will be largely undisturbed and waste piles will be disturbed.
As a result, they will have very different material properties.
Based on our assessment of the data and site experience from historical open-pit mining, we consider the slope design parameters herein adequate for a Pre-Feasibility level Study.
25.4 MineTech Conclusions 2020 Technical Report
The Scotia Mine carbonate hosted lead-zinc deposits are ready for development. ScoZinc has completed much of the engineering work and has obtained supplier quotes for mining equipment and estimates for mill equipment upgrades. Drawings for development and mining have been completed. An economic analysis has confirmed that the Scotia Mine Project is feasible at US\$1.20/ pound zinc and US\$0.90/ pound lead, over the life of the mine. The area has been explored sufficiently to provide good data for this Pre- Feasibility level Study.
The plan calls for a stockpiling of low, medium and high-grade ore before starting the mill. Pre-production overburden stripping and stockpile building is also necessary prior to production. The proposed budget is sufficient to employ this strategy. The estimated Proven and Probable Reserves are 13.66 million tonnes at 2.03% zinc and 1.10% lead, which has a zinc equivalent grade of 3.09%. There are also 5 million tonnes of Inferred Resources.
There is enough operational information available about the deposit to make informed decisions regarding operations. Additional drilling and sampling are not required to come to a decision to fund the Project.
25.5 Conclusions 2021 Updated Technical Report
The Scotia Mine is a carbonate hosted zinc-lead deposit of Early Carboniferous age. Block faulting created deep basins that were invaded by sea water. Marine sediments filled the basins, covering thick terrestrial sediments of that accumulated in an arid and dry oxidizing environment. There was no life on land at this time, but there was life in the oceans.
The deposit was mineralized by fluids flushing through the carbonate reef. The reef had formed a barrier between the Musquodoboit basin and the much larger Shubenacadie basin. Both basins eventually filled with evaporites in a series of transgressions and retreat of the ocean. Marine sedimentation continued in cycles of carbonate rocks followed by gypsum and anhydrite.
With the addition of the industrial mineral gypsum, the ScoZinc's Scotia Mine has an opportunity to vertically integrate as a producer of products for plastering, absorbents, agricultural fertilizer and soil conditioner, and of course exporting gypsum for wallboard.
The author considers the base metal Mineral Resources and base metal Mineral Reserves stated in the 2020 Pre- Feasibility Study to be current and these are unchanged from the values stated in the that report, which was prepared by Ausenco Engineering Canada Inc. ("Ausenco"), MineTech International Limited ("MineTech"), SRK Consulting (U.S.), Inc. ("SRK"), and Terrane Geoscience Inc. ("Terrane"), with assistance from ScoZinc technical personnel.
| Classification | Zone | Mass (kt) | Zn (%) | Pb (%) | ZnEQ (%) | |
|---|---|---|---|---|---|---|
| Getty | 60 | 1.38 | 1.25 | 2.58 | ||
| Main | 4,130 | 2.57 | 1.30 | 3.81 | ||
| Measured | North East | 130 | 3.18 | 1.88 | 4.98 | |
| Total | 4,320 | 2.57 | 1.32 | 3.83 | ||
| Getty | 8,090 | 1.24 | 0.81 | 2.02 | ||
| Getty South | 840 | 1.58 | 0.25 | 1.82 | ||
| Indicated | Main | 9,870 | 1.92 | 1.01 | 2.89 | |
| North East | 2,330 | 2.88 | 1.15 | 3.98 | ||
| Total | 21,130 | 1.75 | 0.92 | 2.64 | ||
| Getty | 8,150 | 1.24 | 0.82 | 2.03 | ||
| Getty South | 840 | 1.58 | 0.25 | 1.82 | ||
| Measured and Indicated |
Main | 14,000 | 2.11 | 1.09 | 3.16 | |
| North East | 2,460 | 2.89 | 1.19 | 4.04 | ||
| Total | 25,450 | 1.89 | 0.99 | 2.84 | ||
| Getty | 950 | 1.35 | 0.54 | 1.87 | ||
| Getty South | 770 | 1.53 | 0.25 | 1.77 | ||
| Inferred | Main | 2,980 | 1.49 | 0.79 | 2.25 | |
| North East | 310 | 2.01 | 0.74 | 2.72 | ||
| Total | 5,010 | 1.50 | 0.66 | 2.13 |
| Table 25-1: Zinc and lead Mineral Resource Base (Carrew et.al. 2020) | ||
|---|---|---|
Source: SRK, 2019
- Mineral Resources are not Mineral Reserves and do not have demonstrated economic viability. There is no certainty that any part of the Mineral Resources estimated will be converted into Mineral Reserves;
- Open pit resources stated as contained within a potentially economically minable open pit; pit optimization was based on assumed prices for zinc of US\$1.35/lb, and for lead of US\$1.14/lb, a Zn recovery of 86% and a Pb recovery of 93%, mining and processing costs varying by zone, and pit slopes of 45 degrees in rock and 22 degrees in overburden;
- Open pit resources are reported based on a Zinc Equivalent (ZnEq) grade of 0.90%. The ZnEq grade incorporates Zn and Pb sales costs of US\$0.19/lb and US\$0.11/lb respectively, and a 2% royalty charge;
- Numbers in the table have been rounded to reflect the accuracy of the estimate and may not sum due to rounding.
Mineral Reserve Estimate
The Scotia Mine Measured and Indicated Mineral Resources, calculated by SRK and dated December 2019, were converted into a Mineral Reserve estimate.
- The Scotia Mine Mineral Reserve Estimates are classified as either Proven Reserves or Probable Reserves and are provided overleaf.
- Total diluted Mineral Reserves are 13,650,000 tonnes with a Zinc Equivalent grade of 3.09 percent
| Mineral Zone | Classification | Tonnage (t) |
Zinc Grade (%) |
Lead Grade (%) |
Zinc Equivalent Grade (%) |
|---|---|---|---|---|---|
| Scotia Mine | Proven | 3,370,000 | 2.46 | 1.21 | 3.62 |
| Scotia Mine | Probable | 10,290,000 | 1.88 | 1.07 | 2.91 |
| Scotia Mine | Total | 13,650,000 | 2.02 | 1.10 | 3.09 |
Table 25-2: Zinc and lead Mineral Reserve Base (Carrew et.al. 2020)
Notes: 2020 Mineral Reserves are as of 01 May 2020 and based on a design cut-off grade of 1.5% ZnEq grade. Cut-off grades are based on a Zinc metal price of US\$1.10/lb, recovery of 89%, a Lead metal price of US\$0.95/lb, and mining recovery of 92%. Average unplanned dilution and mining recovery factors of 12% and 92%, respectively, are assumed.
The conversion of Measured and Indicated Mineral Resources to Proven and Probable Mineral Reserves is shown for the Scotia Mine deposit in the table below.
| Table 25-3: Conversion of Measured and Indicated Mineral Resources to Proven and Probable Mineral | |
|---|---|
| Reserves (Carrew et. a. 2020) |
| Scotia Mine | Mineral Resources | Mineral Reserves | Conversion Factor1 | |||||||
|---|---|---|---|---|---|---|---|---|---|---|
| Measured | Indicated | Total | Proven | Probable | Total | Measured/ Proven |
Indicated/ Probable |
Total | ||
| Tonnage (Mt) | 21.1 | 4.32 | 25.4 | 10.3 | 3.37 | 13.6 | 49 | 78 | 54 | |
| Zinc Grade (%) | 2.57 | 1.75 | 1.89 | 2.46 | 1.88 | 2.02 | 75 | 52 | 57 | |
| Lead Grade (%) | 1.32 | 0.92 | 0.99 | 1.21 | 1.07 | 1.10 | 71 | 57 | 60 |
To the base metal Resources we have added the following estimated gypsum Mineral Resources.
| Classification | Zone | Gypsum Tonnage (kt) |
Gypsum (%) |
|---|---|---|---|
| Getty | 0 | 0 | |
| Measured | Main | 1,310 | 93 |
| (M) | North East | 220 | 91.9 |
| Subtotal | 1,530 | 92.8 | |
| Getty | 0 | 0 | |
| Getty South | 0 | 0 | |
| Indicated | Main | 2,500 | 92.7 |
| (I) | North East | 1150 | 88.7 |
| Subtotal | 3,650 | 91.4 | |
| Getty | 0 | 0 | |
| Getty South | 0 | 0 | |
| Measured and Indicated | Main | 3,810 | 92.8 |
| North East | 1370 | 89.2 | |
| Subtotal | 5,180 | 91.8 | |
| Getty | 0 | 0 | |
| Getty South | 0 | 0 | |
| Inferred | Main | 250 | 92.2 |
| North East | 540 | 90.7 | |
| Subtotal | 790 | 91.2 |
Table 25-4: Estimated Gypsum Mineral Resources within the optimum pit outline at the Scotia Mine.
Lead Market
The Author has excepted the metal prices used for lead and zinc as acceptable for the economic study. Base metal markets will improve as the world goes to electric transport units. This recent note from Mining Engineering sees a bright future for electric vehicles in mines. The following two quotes are from recent publications supporting the view that the lead market will improve.
"Editor's note: Many mining operations around the world are switching from diesel engines to battery-powered electric vehicles. Mines in Canada are making the switch and Canada is becoming a leading source for the materials needed for this transition. According to Natural Resources Canada, "Canada is the only Western nation that has an abundance of cobalt, graphite, lithium, and nickel, that are essential to creating the batteries and electric vehicles of the future." The following article looks at the challenges and solutions to the move to battery-powered mines." (Editor, Mining Engineering , 2021, Vol. 73, No. 5).
Kateryna Klochko of the USGS explains why lead prices have fallen recently "According to the International Lead and Zinc Study Group,6 global refined lead production in 2020 decreased by 4% to 11.7 million tons, and metal consumption decreased by 7% to 11.4 million tons. In 2020, the quarantine-related restrictions imposed as a result of the global COVID-19 pandemic affected the mining industry in several countries, especially Bolivia, Kazakhstan, Mexico, and Peru.7 Consequently, world mine production fell by 7% in 2020 compared with the previous year. (U.S.G.S., Mineral Commodity Summaries, Lead, January 2021).
The sand and gravel can be separated using a water cannon and counter current decant structure. Hydraulic mining is used to gravity concentrate minerals in many parts of the world. They use hydraulic mining to break up Pleistocene tills and other overburden.
Cretaceous clay is found in the trench. This material is used to make bricks.
Limestone waste rock can be cleaned and used as agricultural lime.
Clean Goldenville quartzite is a valuable aggregate.
Scotia Mine is close to the metropolitan area of HRM with a demand for building materials and it is close to the ocean, so a large market is available.
Previous operators have had to put the operation on care and maintenance for a variety of reasons, chiefly the water difficulties underground and low metal price cycles. Working underground was exciting at times when a water containing cavity was intersected. Surface mining can be interrupted by heavy rainfalls, when the bottom of the pit fills.
There is a risk of subsidence where the deposit underlies the Gays River and Highway 224. There is a definite hydraulic connection as Taylor's Pond on the east side of the highway is pumped dry when the mine is operating.
This risk can be mitigated by close monitoring of the surface for any sign of subsidence, especially after a rain event. Grouting the area under the highway with a mixture of gypsum and backfill would eliminate this risk to the public travelling the highway.
The risk of falling base metal prices at the operation can be mitigated by adopting an attitude of adding value to any material that has to be moved: glacial till, carbonates, trench material gypsum and anhydrite. Hydraulic mining would allow Scozinc to sort the overburden till, thus saving space and providing some revenue.
26 Recommendations
26.1 2020 Technical Report Recommendations
The following are recommendations from the 2020 Technical Report (Carrew et.al. 2020)
26.1.1 SRK Recommendations 2020 Technical Report
SRK provides the following recommendations based on the outcome of this mineral resource update for the Scotia Mine Deposit:
- Additional drilling is recommended in areas of Inferred mineral resources to assess the potential for upgrading these areas to Indicated or Measured mineral resource categories
- Infill drilling is recommended in areas of historical drilling where sampling focused only on higher grade intervals to support underground mining. Additional drilling and sampling in these areas will be required to confirm the continuity of lower grade mineralization to support potential open-pit mining
- Recommendations provided in previous Technical Reports and economic studies should be reviewed within the context of this updated mineral resource estimate for the Scotia Mine Deposit
26.1.2 Ausenco Recommendations 2020 Technical Report
The following scopes of work are recommended in order to investigate potential opportunities, mitigate risks, and further define project requirements:
- Complete additional or deferred metallurgical test work, including: flotation testing of representative samples from the most recent mine production schedule to confirm recoveries and concentrate grades, and specific testing to support the selection of the proposed Jameson cell in the zinc flotation circuit
- Lead and zinc concentrate filtration tests to provide equipment selection parameters
- Testwork on Gypsum. Potential to add to revenue stream
- Continue engineering work to reduce EPCM costs and equipment lead times
- Secure long lead time equipment to reduce the procurement execution phase
- o Perform additional studies to evaluate:
- Compressed Natural Gas ("CNG") Power Generators vs. NS Power provider. There is a strong
- o Opportunity to reduce operating costs by using CNG generators for ScoZinc operations
- Grind size and impact on flotation kinetics. There is potential to marginally increase the throughput
- o Through the existing mill without increasing current equipment capacity
26.1.3 Terrane Recommendations, 2020 Technical Report
Terrane highlights some common operational considerations below.
Controlled Blasting – Rock strength can be greatly affected by blast disturbance which may influence the bench to overall pit scale stability. At the bench to inter-ramp scale, in bedrock, slope stabilities are often driven by on-going deterioration of the wall face. This deterioration or raveling is generally initiated by small, discontinuity bounded, rock blocks known as key blocks. To achieve the steepest possible bench faces it is imperative that such on-going deterioration be limited during blasting activities. As a result, we recommend controlled blasting be used at the Scotia Mine site.
Bench Maintenance – Soil Bench faces in overburden will be susceptible to erosion/gullying and surficial (<0.5 m) slumping. Overburden slopes should be seeded after excavation to limit deterioration. Further maintenance may be required to fix small scale slumping and/or gullying so it does not become a larger operational issue.
Bench Maintenance – Bedrock Bench faces should be regularly maintained during mining operations and where possible kept clear of debris to ensure they function as designed. Scaling is an important component of a bench face maintenance program and is generally conducted after blasting has occurred in areas where safe access is possible. A trough bench scaling program may present an opportunity to minimize bench widths due to the reduced volume of material to be controlled by the catch bench.
Groundwater and Slope Depressurization – Drainage control measures should be implemented so that any surface water is prevented from flowing into the pit during mining operations and saturating the pit slopes. Further, ponding of water within the pit and on catch benches should be controlled. Additionally, vibrating wire piezometers should be installed at regular intervals around each pit perimeter to allow for detailed monitoring of groundwater levels and pore-water pressures. If high pore-water pressures are encountered during mining, slope depressurization measures may need to be implemented. These typically consist of horizontal drains drilled into the slope allow for drainage of the slope.
Geotechnical Monitoring – Geotechnical monitoring and field data collection of the open-pit walls is recommended throughout the life of the open-pits. The following is recommended as part of a geotechnical monitoring program:
Geotechnical mapping and regular inspection of benches (overburden and rock). This should include tension crack mapping along the crest of bedrock benches
- Geological and major structures mapping
- Maintain an up-to-date lithological and structural model
- Implement a testing program (overburden and bedrock) to confirm all design values
- Complete regular 3rd party inspections and slope stability audits
- Terrane recommends the following future geotechnical and hydrogeological assessments:
Overburden
A detailed overburden subsurface investigation to collect further data for a Level 3 to Level 4 design. This investigation should include overburden drilling, sample collection (traditional and undisturbed), and field testing (e.g. standard penetration tests, cone penetration tests)
- Advanced laboratory soils testing (e.g. triaxial testing, liquid/plastic limit, direct shear, etc.)
- Developing a 3D overburden stratigraphy model
- Further, limit-equilibrium modelling (2D and 3D) and/or finite-element modelling with updated material properties
- Liquefaction analysis of sensitive soils
- Complete additional design work
- A detailed evaluation of overburden slopes within 30 m of Gays River, and
- Complete a waste dump assessment and design
Bedrock
- Oriented, geotechnical drilling to access the structural fabrics in the pit walls, this drilling should focus on the three main lithologies that underlie the Scotia Mine site
- Optical and acoustic televiewer surveying
- Evaluate the effects that historical underground workings may have on development
- Perform a suite of geomechanical testing on representative rock samples. This testing should include direct shear, triaxial, and additional UCS testing
- Develop a 3D structural geology model (persistent fabrics and major structures) for the site
- Perform a kinematic analysis on bench faces and inter-ramp angles
- Complete 3D limit-equilibrium modelling
Hydrogeology
- As part of the overburden subsurface investigation, field hydrogeological testing should be completed, including falling head tests and constant head tests (i.e. Packer testing)
- Laboratory analysis
- Piezometer and groundwater well installation in overburden
- Develop a 3D hydrogeological model
- Complete design specifications for pumping wells & any waste dumps
- Complete a geotechnical investigation of the proposed waste dump
- Index testing of the overburden stratigraphy underlying the waste dump
- Further numerical modelling and analysis to confirm the recommended waste dump design
- Develop a geotechnical instrumentation and monitoring program for the waste dump
26.1.4 MineTech Recommendations, 2020 Technical Report
A study should be done to determine if the tailings pond can be redesigned to allow water to flow to the South Gays River. The cost of this study would be in the order of \$15,000.
A 100 tonne bulk sample was sent by Esso to Lakefield in 1975 for metallurgical work and the design of the mill, which was done by Kilborn Engineering Limited. A record of this testwork should be available at the mine site. A thorough search of the Scotia Mine data records could save a lot of needless repeat of past work. The cost of such a search and a report on what is available would be approximately \$15,000.
Firm dealer quotes should be obtained and compiled, along with delivery times. This might take a month or more. The results should be reported in a final feasibility study report, which would take approximately 3 months and cost approximately \$50,000.
Additional sensitivity analysis should be included in the report mentioned above.
26.2 2021 Technical Report Recommendations
Calcining and screening tests for processing the gypsum into the higher value calcined gypsum are recommended.
Bench scale laboratory work to characterize the gypsum would be followed by a market study to determine the customer specifications and ideally, obtain letters of interest from end users for the calcined gypsum products. (Estimated cost \$10,000).
Study potential markets for the gypsum are cement plants, agricultural outlets and a plaster producing factory. A factory could be set up at the Scotia Mine site and the product sent by ocean transport in containers, as is planned for the lead and zinc concentrate. (Estimated cost \$25,000).
Sink-float testing is recommended for the base metals minerals. Samples can be taken from drill core and the waste pile, sent to the Mineral Engineering Centre for sink float test work. Six sample fractions should be created by crushing and screening. Fractions are assayed, and a number of tests are completed using heavy liquids to make a float product and a sink product. These are assayed and the data plotted. (Estimated cost \$15,000).
Table 26-1: Specific Gravities of the Scotia Mine minerals of value.
| Mineral relative to dolomite | S.G. | % difference | |
|---|---|---|---|
| Dolomite Rock | S.G. | 2.60 | 0 |
| Galena | 7.60 | 292% | |
| Sphalerite | S.G. | 4.10 | 158% |
| Pyrite | 5.00 | 192% | |
| Separating gypsum from anhydrite |
|||
| anhydrite | 2.92 | 127% | |
| gypsum | 2.30 | 79% |
Specific gravity for the minerals at Scotia Mine
Oxidation tests for sink float products. Zinc and lead oxides do not float well and it would be prudent to know how long the concentrate can be stored after HMS and washing. (Estimated cost \$10,000)
Preliminary heavy media plant design studies are recommended as much of the infrastructure on site may be used. (Estimated cost \$25,000).
It is recommended that the economic analysis be updated with a value for the industrial minerals. (Estimated cost: \$15,000)
Table 26-2: Recommendations, 2021 Report
| Item | Estimated Cost |
|---|---|
| Bench Scale Laboratory Work (Calcining gypsum) |
\$10,000 |
| Market Study into gypsum products, aggregate market, and plaster end products |
\$25,000 |
| Sink-Float Testing | \$15,000 |
| Oxidation Testing | \$10,000 |
| Preliminary Heavy Media Plant Design | \$25,000 |
| Economic Analysis Update | \$15,000 |
| Estimated Total Cost | \$100,000 |
The total cost of these recommendations is estimated to be \$100,000. If successful, additional laboratory work would be done on a larger sample set. If calcining the gypsum is successful, a sales team should be engaged.
27 References
Adams, 1991, "Gypsum and Anhydrite Resources in Nova Scotia" Nova Scotia Department of Natural Resources, Report Economic Geology Series ME 1991-1,
Akande, S.O. and Zentilli, M., 1983. Genesis of the lead‐zinc mineralisation at Gay River, Nova Scotia, Canada; International Conference on MVT Lead‐Zinc Deposits, University of Missouri‐Rolla, Rolla, Mo., USA.
U.S. Geological Survey, 1997–most recent, Mineral Commodity Summaries 1997–most recent. (Available via http://minerals.usgs.gov/minerals.)
Aston, T. and Lamb, T. (1993), "An evaluation of groundwater at the Gays River Mine, Halifax County, Nova Scotia," CIM Bulletin, Vol. 86, No. 975.
Baker, J. (2011), "Block Model Validation," MineTech International Limited, internal report prepared for Selwyn Resources Limited.
Brown, J. D. (1981), "Geotechnical investigation, Gays River Mine," Jacques, Whitford and Associates, Project No. 2192, for Canada Wide Mines.
Bruce, B. 2013: Disruptive innovation in gypsum; 13th Global Gypsum Conference and Exhibition 2013, Proceedings, p. 3.1
Campbell, Joe, Thomas, Derek and Hudgins, Bruce, 1992, Westminer Canada Limited, Seabright Operations, Gays River Pb/Zn Deposit, Nova Scotia, Canada; Resource Calculations.
Carew, T., T Gilman, T. R. Raponi, and P. Hannon, July 2020 "Scotia Mine Pre-Feasibility Study Technical Report" for ScoZinc Limited, Nova Scotia, Canada, filed on SEDAR at https://www.sedar.com.
Carew, T. J., 1998, Savage Resources Canada Co, Scotia Mine, Deposit Modelling and Open-Pit Reserve Evaluation, May 23, 1998.
CBCL (1999), "Geotechnical investigation and preliminary design, proposed river diversion dyke on Gays River for Open-Pit Mine," Prepared for Savage Resources.
CIM, 2020, "2020 CIM Guidance on Commodity Pricing and Other Issues related to Mineral Resource and Mineral Reserve Estimation and Reporting" Canadian Institute of Mining, Metallurgy and Petroleum
CRA (2006), "Phase I environmental site assessment update, Scotia Mine and mill facility," prepared for Acadian Gold Corp by Conestoga‐Rovers & Associates, March 2006.
Comeau, R.L. and Kuehnbaum, R.M., 2004, "Project Summary, Scotia Mine Zn+Pb deposit, Nova Scotia for OntZinc Corporation," A.C.A. Howe International Limited, Report No. 878.
Crangle, Robert D., United States Geological Survey, 2021, "Mineral Commodities Summaries – Gypsum"
Cullen, M. P., Kennedy, C. and Harrington, M., "Technical Report on a mineral resource estimate, Getty Deposit," for Selwyn Resources Ltd, March 2011.
Doyle E.N, 1970, "The Sink-Float Process in Lead-Zinc Concentration," Acting Superintendent, Sullivan Concentrator, Cominco Ltd., Kimberly, B.C., Canada, Chapter 40, World Symposium On Mining & Metallurgy Of Lead & Zinc Volume I , 1970, AIME
Demmich, J. 2018, "on the past and present supply situation in Europe", in 1st Global GypSupply Conference & Exhibition on gypsum supply trends and technology. 13 - 14 March 2018, Brussels, Belgium. Conference review found at https://www.globalgypsum.com › conferences/past
Exploration and Mining Division Ireland, 2004. Zinc and Lead in Ireland. Information brochure by Department of Communications, Marine and Natural Resources, Dublin.
Fallara, F., and Savard, M., 1998. A structural, petrographic, and geochemical study of the Jubilee Zn‐Pb deposit, Nova Scotia, Canada, and a new metallogenic model. Economic Geology, vol. 93, pp. 757‐778.
Flint, Ian, 2011, "Scotia Mine Performance Predictions Based on Historical Processing Analysis," MineTech International Limited, internal report prepared for Selwyn Resources Limited.
Fracflow Consultants Inc., Numerical investigation of groundwater inflow, Gays river Mine, N.S., for Westminer Canada Ltd.
Fralick, P.W. and Schenk, P.E., 1981. Molasse deposition and basin evolution in a wrench tectonic setting, the late Paleozoic, eastern Cumberland Basin, Maritime Canada; in Sedimen‐tation and Tectonics; in Alluvial Basins, ed. A.D. Miall; Geological Association of Canada Paper 23, p. 77‐98.
Giles, P.S., and Boehner, R.C., 1982. Geologic map of the Shubenacadie and Musquodoboit Basins, Central Nova Scotia. Nova Scotia Department of Mines and energy Map 82‐4, scale 1:50,000.
Government of Nova Scotia, Department of Energy and Mines, Geoscience and Mines Branch, "Mineral Production Report, ME 2019-001", February 2019
Hale, W. E., Ph. D., P. Eng. And Adams, K. D., M.Sc., 1985. Ore Reserves Estimates, Gays River Mine Property; Ecological and Resources Consultants Limited.
Hardy, Scott, P. Eng., 1998. Internal Memo to Dennis Fischer, Savage Resources Canada Company; Report on Scotia Pit Design; Mine Development Associates.
Kilborn Engineering Services, 1974. Memo to File; Imperial Oil – Gays River; 3rd Revision = Ore Reserves (Mineable Reserves).
Hannon, Patrick, M.A.Sc., P. Eng. & Roy Douglas, M.A.Sc., P. Eng.: Internal Memo; "ScoZinc Limited, Scotia Mine, 2004 Exploration, May 16, 2005."
https://www.inflationtool.com/canadian-dollar/2019-to-present-value
Digital Tectonic Activity Map of the Earth, Posted on November 29, 2011, via globalchange.umich.edu
.(https://leclercf.files.wordpress.com/2011/11/media\_httpwwwglobalch\_ogilb-scaled1000.jpg)
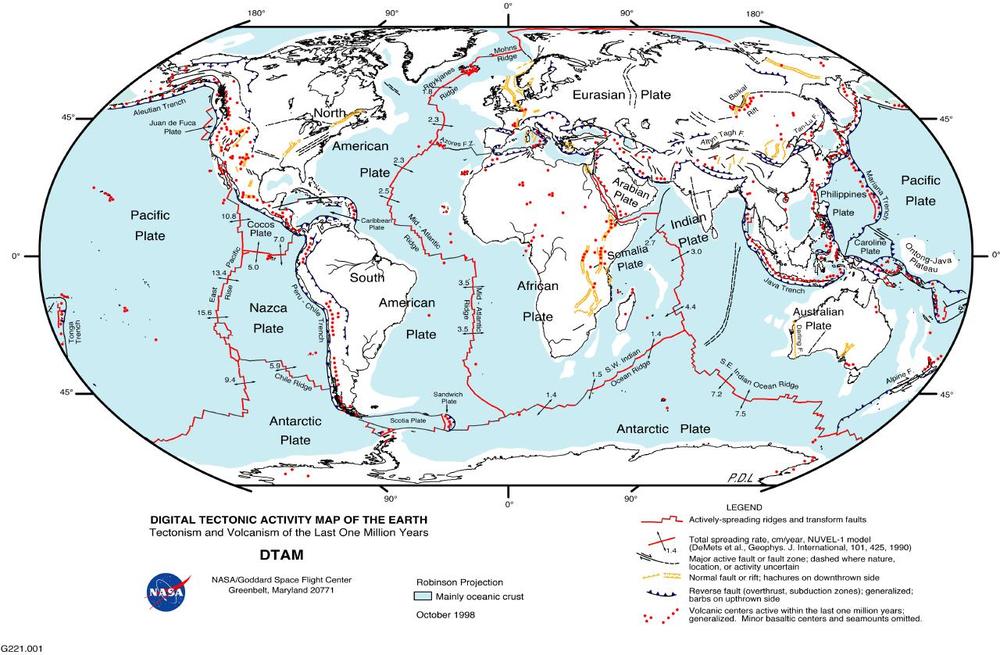
Jai Associates 2021, Plaster of Paris pricing at https://www.gypsumplaster.net/wall-and-ceilingplastering-service.html
Hudgins, B, & Lamb, T: Assessment report: Special License 1‐90 – Gays River: Getty Deposit; June 1992: for Westminer Canada Limited.
Kilborn Engineering, 1974. Memo to File, Imperial Oil – Gays River; 3rd Revision – Ore Reserves (Mineable Reserves).
Kontak, D.J., 1992. A preliminary report on geological, geochemical, fluid inclusion and isotopic studies of the Gays River Zn‐Pb deposit, Nova Scotia; Nova Scotia Department of Natural Resources, Open File Report 92‐ 014.
Kontak, D.J., 1998. A study of fluid inclusions in sulfide and nonsulfide mineral phases from a carbonate‐ hosted Zn‐Pb deposit, Gays River, Nova Scotia, Canada. Economic Geology, vol. 93, pp. 793‐817.
Kontak, 2000. The role of hydrocarbons in the formation of Pb‐Zn deposits in the basal Windsor Group of the Maritimes Basin of Nova Scotia, Canada: evidence from the Gays River (Pb‐Zn) and Walton (Ba‐Pb‐Zn‐Cu‐ Ag) deposits. Abstract for the 2000 convention of the Canadian Society of Exploration Geophysicists, posted on CSEG website.
Lekien, Bernard, 2018, "the giant scale of the European gypsum industry" in 1st Global GypSupply Conference & Exhibition on gypsum supply trends and technology. 13 - 14 March 2018, Brussels, Belgium. Conference review found at https://www.globalgypsum.com › conferences/past
MacDougall, J. 1. , D.B. Cann, and J. D. Hilchey, 1963, Report No. 13, Soil Survey od Halifax County Nova Scotia
MGI Limited, "Environmental registration document for the proposed Scotia open-pit mine and river diversion project," May 1999.
McKee, D. M. and Hannon, P. J. (1985), "The hydrogeological environment at the Gays River Mine," International Journal of Mine Water, Vol. 4.
MacEachern, S.B. and Hannon, 1974. The Gays River discovery‐a Mississippi valley type lead‐zinc deposit in Nova Scotia; Canadian Institute of Mining and Metallurgy Bulletin, October 1974, pp 61‐66.
The third annual Midwest Soil Improvement Symposium, 2013, accessed at http://www.gypsoil.com/symposium
Gypsum: Some things old and some things new Dr. Warren A. Dick, Professor School of Environmental and Natural Resources, The Ohio State University, Presentation /media-library/documents/36.pdf
The effects of calcium on soil physical properties and air-water management.Dr. Jerry Bigham, Professor (Emeritus) School of Environmental and Natural Resources, The Ohio State University Presentation /medialibrary/documents/45.pdf
Using gypsum for soil and water conservation. Dr. L. Darrell Norton, Professor (Emeritus) Purdue University & Soil Scientist (Retired) National Soil Erosion Research Laboratory, USDA-ARS, West Lafayette, IN Presentation /media-library/documents/47.pdf
Consultant panel - observations in advising growers in using gypsum. Moderated by John Volk, Principal, JV Associates, Clint Nester, Nester Ag, Bryan, OH, Presentation /media-library/documents/40.pdf
Greg Kneubuhler, G & K Concepts, Harlan, IN., Presentation /media-library/documents/38.pdf Current research activities for agricultural uses of gypsum in highly erodible soils.
Dr. H. Allen Torbert, Research Leader National Soil Dynamics Laboratory, USDA-ARS, Auburn, AL Presentation /media-library/documents/37.pdf
Gypsum curtains: edge-of-field phosphorus filtration. Dr. Ray Bryant, Research Soil Scientist Pasture Systems and Watershed Management Research Unit, USDA-Agricultural Research Service, University Park, PA Presentation /media-library/documents/46.pdf
US Soybean Board Gypsum Research Update Randall Reeder The Ohio State University Extension Presentation /media-library/documents/39.pdf
Keynote Presentation: "Dirt: The Erosion of Civilizations." Dr. David R. Montgomery, Professor University of Washington Presentation /media-library/documents/48.pdf
Ohio environmental projects: gypsum's impact on water quality. John Andersen, President Greenleaf Advisors, LLC Presentation /media-library/documents/42.pdf
FGD Gypsum: "How it's made, how we know its safe and how to apply it." Ron Chamberlain, Agronomist and Director of Gypsum Products GYPSOIL® Division of Beneficial Reuse Management Presentation /medialibrary/documents/50.pdf
Spreader Panel moderated by Ron Chamberlain Steve Songer, Songer Farms, Veedersburg, IN., Gary Pennell, Farmer's Elevator Grain and Supply, New Bavaria, OH., Travis Ulmer, New Haven, IN
Gypsum User Panel moderated by Karen Bernick, Principal, Karen Bernick Marketing Communications Jack Maloney, Little Ireland Farms, Brownsburg, IN Presentation /media-library/documents/49.pdf
Les Seiler, Fayette, OH Rodney Rulon, Rulon Enterprises, Arcadia, IN PDF presentation /medialibrary/documents/41.pdf
Murray, D.A., December 10, 2017. Limestones and dolomites of Nova Scotia. Pat 3, Colchester and Halifax Counties. Nova Scotia Department of Natural Resources, Mineral Resources Branch, Open File Report ME200‐ 3, with general geology summary by R.C. Boehner.
MineTech International Limited., Updated Mineral Resource Report for the Gays River Zinc-Lead Deposit, Including the Getty Deposit, Nova Scotia, Canada.
Nesbitt Thompson Inc., 1991. Sale of the Gays River lead‐zinc mine, Nova Scotia. Document prepared for Westminer Canada Ltd., October 1991.
Ochsenius, Carl, 1888, "On The Formation of Rock Salt Beds and Mother-Liquor Salts, Proceedings Natural Sciences of Philadelphia
Patterson, J.M., 1993. Metalliferous environments of Nova Scotia – base metals. Nova Scotia Department of Natural Resources, Mineral Resources Branch, Information Series ME 22.
Pasminco, approx. 2000. Savage Resources Canada Company, Executive Summary, Scotia Mine; Internal Memo.
Poulin, Claude, 1998 (1) Scotia Mine, Mineral Resource Status; Internal Memorandum; Claude Poulin, Senior Geologist, Savage Resources Canada Company.
Poulin, Claude, 1998 (2) Scotia Mine, Mineral Reserve Status; Internal Memorandum; Claude Poulin, Senior Geologist, Savage Resources Canada Company.
RBC, 2005, "Metal prospects, 2006 zinc market outlook," December 6, 2005.
Rajeev, S., 2006, "Fundamental Metals Monthly – July," Fundamental Research Corp, July 11, 2006.
Ravenhurst, W.R., 1987. Stirling, Richmond County, Nova Scotia, Report on geology, drilling, drill core geochemistry and downhole Em and ground EM surveys, Crone Geophysics for Wilco Mining; Nova Scotia Department of Natural Resources, Assessment Report 87‐061.
Roberts, H., 2006, "Recent developments in global lead and zinc markets and outlook to 2012," Internal Report Prepared for MineTech International Limited.
Roy, W. Douglas, Carew, Tim and Comeau, Reg (2006), "Resource, Reserve and Pre‐Feasibility Report for the Purchase and Operation of Scotia Mine," MineTech International Limited, prepared for Acadian Gold Corp.
Roy, W. Douglas, "Scotia Mine Reclamation Plan," MineTech International Limited, prepared for ScoZinc Limited, March 25, 2011.
Sangster, D.F., Savard, M.M. and Kontak, D.J., 1998. A generic model for mineralisation of Lower Windsor (Viséan) carbonate rocks of Nova Scotia. Economic Geology, vol. 93, pp. 932‐952.
Savard, M.M., and Chi, G., 1998. Cation study of fluid inclusion decrepitates in the Jubilee and Gays River (Canada) Zn‐Pb deposits – characterization of ore‐forming brines. Economic Geology, vol. 93, pp. 920‐931.
Selwyn Resources, Press Release, "Selwyn's ScoZinc (Restart) Project Delivers Robust Economic Results", August 30, 2011.
Scotese, C.R., Richard K. Bambach, Colleen Barton, Rob Van der Voo and Alfred M. Ziegler, 1979, "Paleozoic Base Maps" in The Journal of Geology, Volume 87, Number 3,May 1979. The University of Chicago Press Journal
Smith, Joshua (2007). Borderland Smuggling: Patriots, Loyalists, and Illicit Trade in the Northeast, 1780- 1820. Gainesville, FL: UPF. pp. passim. ISBN 0-8130-2986-4., Plaster War posted at https://en.m.wikipedia.org/wiki/Hants\_County,\_Nova\_Scotia, 19th century - shipbuilding and confederation
Wallace, J, Strohmay, S and Cameron, K, 2015, "McArthur River Mine heavy medium plant – the benefits of applying modern coal plant design principles to base metal heavy medium separation", in Proceedings MetPlant 2015, pp 311–323 (The Australasian Institute of Mining and Metallurgy: Melbourne).
Thornton, E. (2006 (1)), Past Mill Superintendent for Scotia Mine, personal communication.
U.S. Geological Survey, 2013, Metal prices in the United States through 2010: U.S. Geological Survey Scientific Investigations Report 2012–5188, 204 p., available only at http://pubs.usgs.gov/sir/2012/5188.
Verhoogen, Turner, Weiss, Warhrhaftig and Fyfe, 1970, The Earth, an Introduction to Physical Geology, Holt, Rinehart, and Winston, Inc.
Whiteway, J. P.. 2014: in Mineral Resources Branch, Report of Activities 2012; Nova Scotia Department of Natural Resources, Report ME 2013-001, p. 117-120.
Whiteway, J. P. 2014: in Mineral Resources Branch, Report of Activities 2013; Nova Scotia Department of Natural Resources, Report ME 2014-001, p. 139-143.
Whiteway, J.P. 2018: in Geoscience and Mines Branch, Report of Activities 2017-2018; Nova Scotia Department of Energy and Mines, Report ME 2018-001, p. 102.
Whiteway, J. P. 2018 Gypsum Program; http://novascotia.ca/natr/meb/geologymatters/ GM12Program.asp. Presented at the 1st Gypsum Supply Conference and Exhibition 2018, Brussels, Belgium, March 13, 2018.
U.S. Geological Survey, 2014, Gypsum statistics, in Kelly, T.D., and Matos, G.R., comps., Historical statistics for mineral and material commodities in the United States: U.S. Geological Survey Data Series 140, accessed [date], at http://minerals.usgs.gov/minerals/pubs/historical-statistics/.
Suite 1250, 3500 de Maisonneuve Blvd. West Westmount, Quebec H3Z 3C1 CANADA Tel.: (514) 939-2710 Fax: (514) 939-2714 mrmr.cim.org | www.cim.org
WMC International Limited, 1995. Sale of the Gays River Lead‐Zinc Mine, Nova Scotia, Canada.
Ward, K. 2018, "Beyond Board: How Nova Scotia can Add Value" https://slidetodoc.com › beyond-boardhow-nova-scotia.
"Global zinc concentrate market to flip to surplus in 2021, says Antaike", Reuters, Nov 12, 2020 post
https://financialpost.com/pmn/business-pmn/global-zinc-concentrate-market-to-flip-to-surplus-in-2021 says-antaike
Barrera, Priscila, 2020, "Zinc Outlook 2021: Concentrates Market to Remain Tight", Zinc Investment News, December 29th, 2020 posted at: https://investingnews.com/daily/resource-investing/base-metalsinvesting/zinc-investing/zinc-outlook/
28 Glossary
Many of the defined geological terms below are from Jennifer Bates's "Gold in Nova Scotia" (Bates, 1987)" and from "A Dictionary of Earth Sciences, third edition, 2008" published by the Oxford University Press, edited by Michael Allaby, 654 pages. The definitions have been edited slightly in that extraneous material that is not relevant to this assessment report, has been left out. Mineral Resource and Reserve terms are from "CIM DEFINITION STANDARDS - For Mineral Resources and Mineral Reserve's", Prepared by the CIM Standing Committee on Reserve Definitions Adopted by CIM Council on May 10, 2014. Mining terms are mainly from the Underground Mining Methods Handbook, W.A. Hustrulid, Ed., Society of Mining Engineers of the American Institute of Mining, Metallurgy, and Petroleum Engineers, Inc. New York, 1982.
| Word | Definition |
|---|---|
| Adjacent Property | Means a property: (a) in which the issuer does not have an interest; (b) that has a boundary reasonably proximate to the property being reported on; and (c) that has geological characteristics similar to those of the property being reported on. |
| Adsorption | Physical adherence of chemicals to substrates without chemical reaction, in this case soluble gold complexes to activated carbon. |
| Advanced Property | A property that either has mineral reserves, or has mineral resources with potential economic viability as supported by a preliminary economic assessment, a pre feasibility study, or a feasibility study. |
| Agglomerate (vb.) | The act of binding fine particles together to create coarse particles as part of a mineral processing activity. |
| Alabaster | A compact, very fine grained variety of rock gypsum prized by sculptors for its uniform workability and occasionally is found within commercial deposits. |
| Anticline | A fold, generally convex upward, whose core contains the stratigraphically older rocks. Antonym of Syncline. |
| Arenite | A general name for sedimentary rocks composed of sand-sized fragments irrespective of composition; e.g., sandstone, graywacke, arkose, and calcarenite. |
| Assay Laboratory | A facility in which the proportions of metal in rocks or concentrates are determined using analytical techniques. |
| Auriferous | Containing gold; gold-bearing. |
| Back | The roof or overhead rock surface of an underground opening. |
| Bed | The smallest distinctive division of a stratified series, marked by a more or less well defined surface or plane from its neighbours above and below; a layer or stratum. |
| Bias | A measurement procedure or estimator is said to be biased if, on the average, it gives an answer that differs from the truth. The bias is the average (expected) difference between the measurement and the truth. For example, if you get on the scale with clothes on, that biases the measurement to be larger than your true weight (this would be a positive bias). The design of an experiment or of a survey can also lead to bias. Bias can be deliberate, but it is not necessarily so (Glossary of Statistical Terms). |
| Billion | One thousand million (10^9). |
| Breast | The vertical end or face of a horizontal cut. The breast is a mining face that is generally as wide as the mineralized rock body and as high as the cut height. |
|---|---|
| Bouma Sequence | Idealized sequence of sedimentary structures observed in *turbidity current deposits. It is named after the geologist, Arnold H. Bouma, who first emphasized its generality (Sedimentology of Some Flysch Deposits, Elsevier, Amsterdam, 1962). The lowest unit, A, a massive or graded sand, is overlain progressively by the B (lower division of parallel lamination), C (ripple or convolute laminations), D (upper division of plane parallel laminations), and E (pelagic shale) units. Examples showing the entire sequence are not common. The sequence can be interpreted in terms of deposition under waning current conditions. |
| Cambro-Ordovician | Geological timeframe; between the Cambrian and Ordovician periods (approximately 560 million and 440 million years ago). |
| Caps | Round or square timbers generally greater than 200mm in diameter, placed perpendicular to the vein for wall and back support. Caps are part of a timber set. |
| Carbonate Rocks | Sedimentary rocks composed mainly of calcium carbonate. USGS OFR 97-536-A. |
| Carbonic Acid | A mild acid formed when water and carbon dioxide chemically combine in the atmosphere and soil. USGS OFR 97-536-A. |
| Cash Cost | A measure of the average cost of producing an ounce of gold, calculated by dividing the total working costs in a period by the total gold production over the same period. Working costs represent total operating cost less depreciation and amortization and other non-cash items. In determining the cash cost of different elements of the operations, it is necessary to allocated overheads. |
| Cave | A natural opening in rock large enough to be entered by man and extending to points where daylight does not penetrate. USGS OFR 97-536-A. |
| Cave System | A cave or caves having a complex network of interconnected chambers and passages that constitute an underground drainage system. USGS OFR 97-536-A. |
| Dissolution | (Also called chemical solution) - The process of chemical weathering of bedrock in which the combination of water and acid slowly removes mineral compounds from solid bedrock and carries them away in liquid solution. USGS OFR 97-536-A. |
| Centrifugal Separation | The separation of different particles by centrifugal action as used in cyclone separators and centrifuges. |
| Chute | The loading arrangement that utilizes gravity flow in moving broken rock from a higher elevation to a lower elevation. A gate is used to control the flow. Chute is often used for the wooden tube extending upward into the stope. |
| Concentrate | A powdery product containing the valuable mineralized rock mineral from which most of the waste material has been eliminated. |
| Concentrate | The clean product recovered in froth flotation. |
| Contained Ounces | Represents ounces in the ground without the reduction of ounces not recovered by the applicable metallurgical process. |
| Cross Section | A diagram or drawing that shows features transected by a vertical plane drawn at right angles to the longer of the axis of a geologic feature. |
| Crosscut | A nominally horizontal tunnel, generally driven at right angles to the strike of the vein. |
| Crown Land | Land held by the state; synonymous with Public Land. Formally, land held by the monarch acting as the head of state. |
| Cut | The volume of the orebody that is mined and filled in one cut and fill cycle. |
| The lowest grade of mineralized material considered economic to extract that returns the highest net present value; the cutoff grade is used in the calculation of the mineralized rock volume and quality of a given deposit. The cutoff grade is adjusted to present conditions as costs are sunk and opportunities arise. |
|---|
| A sloping underground opening for machine access from level to level or from surface; also called a ramp. |
| A natural occurrence of a useful mineral, or an ore, in sufficient extent and degree of concentration to invite exploitation. |
| The initial stages of opening up a new mine. |
| Drilling with a hollow bit with a diamond cutting rim to produce a cylindrical core that is used for geological study and assays. Used in mine exploration. Infill diamond drilling at shorter intervals between existing holes, used to provide greater geological detail and to help establish reserve estimates. |
| The contamination of mineralized rock with waste rock during mining, decreasing the overall grade of the ore. |
| The angle that a structural surface, i.e. a bedding or a fault plane, makes with the horizontal measured perpendicular to the strike of a structure. |
| Said of a mineral deposit (esp. of metals) in which the desired minerals occur as scattered particles in the rock, but in sufficient quantity to make the deposit an ore. Some disseminated deposits are very large. |
| (also called chemical solution) - The process of chemical weathering of bedrock in which the combination of water and acid slowly removes mineral compounds from solid bedrock and carries them away in liquid solution. USGS OFR 97-536-A. |
| Down from the point of dip as described above. |
| A nominally horizontal tunnel, generally driven parallel to or coincident with a vein. |
| (verb) "to judge or approximate the value, worth, or significance of; to determine the size, extent, or nature of". (noun) "an approximate calculation; a numerical value obtained from a statistical sample and assigned to a population parameter". |
| Prospecting, sampling, mapping, diamond drilling and other work involved in searching for ore. |
| The process of fracturing that produces a displacement in the rock strata. |
| A Feasibility Study is a comprehensive technical and economic study of the selected development option for a mineral project that includes appropriately detailed assessments of applicable Modifying Factors together with any other relevant operational factors and detailed financial analysis that are necessary to demonstrate, at the time of reporting, that extraction is reasonably justified (economically mineable). The results of the study may reasonably serve as the basis for a final decision by a proponent or financial institution to proceed with, or finance, the development of the project. The confidence level of the study will be higher than that of a Pre-Feasibility Study. |
| A group of common rock-forming minerals that includes microcline, orthoclase, plagioclase and others. |
| A process by which some mineral particles are induced to become attached to bubbles and float, and other particles to sink, so that the valuable minerals are concentrated and separated from the worthless gangue or waste. |
| Flowsheet | A diagram showing the progress of material through a preparation or treatment plant. It shows the crushing, screening, cleaning, or refining processes to which the material is subjected from the run-of-mine state to the clean and sized products. The size range at the various stages may be shown. |
|---|---|
| Fluvial | Pertaining to a river or rivers. USGS OFR 97-536-A. |
| Footwall | The underlying side of a fault, an orebody, or mine workings. |
| Froth Flotation | A flotation process in which the minerals floated gather in and on the surface of bubbles of air or gas driven into or generated in the liquid in some convenient manner. |
| G&A | General & Administrative Costs. |
| Gangue | Waste material that is mixed or associated with a desired mineral. |
| Geophysics | A branch of physics dealing with the Earth, including its atmosphere and hydrosphere. It includes the use of seismic, gravitational, electrical, thermal, radiometric, and magnetic phenomena to elucidate processes of dynamical geology and physical geography, and makes use of geodesy, geology, seismology, meteorology, oceanography, magnetism, and other Earth sciences in collecting and interpreting Earth data. |
| Gold | A chemical element with the symbol Au (from its Latin name aurum) and atomic number 79. It is a highly sought-after precious metal which has been used as money, a store of value and in jewelry since the beginning of recorded history. The metal occurs as nuggets or grains in rocks, underground "veins" and in alluvial deposits. It is one of the coinage metals. Gold is dense, soft, shiny and the most malleable and ductile substance known. |
| Grab Sample | A sample taken from a particular area at a particular time without undue reference to any specific sampling program. |
| Grade | The amount of valuable mineral in each ton of ore, expressed as troy ounces per ton or grams per tonne for precious metals and as a percentage for other metals. |
| Gram | Metric system unit of mass. 1/1000 kg = 1 gram. |
| Gravity Separation | The use of differential specific gravities to separate denser material (e.g. gold) from lighter material (waste). |
| Graywacke (Greywacke) | An old rock name that has been variously defined but is now generally applied to a dark gray, firmly indurated, coarse-grained sandstone that consists of poorly sorted, angular to subangular grains of quartz and feldspar, with a variety of dark rock and mineral fragments embedded in a compact clayey matrix having the general composition of slate and containing an abundance of very fine-grained illite, sericite, and chloritic minerals. |
| Ground Water | Water below the levels at which all voids in the rock are completely filled with water. USGS OFR 97-536-A. |
| Hanging Wall | The overlying side of a fault, an orebody or mine workings. |
| Haul Truck | A self-propelled vehicle used to transport material. |
| Heading | The working face of a drift, crosscut or ramp. In timber sets, a heading is a bundle of wooden boards placed between a cap and the wall rock. |
| Hectare | Metric system unit of area. Equal to 10,000 square metres. |
| Hinge | The locus of maximum curvature or bending in a folded surface, usually a line. |
| Historical Estimate | Means an estimate of the quantity, grade, or metal or mineral content of a deposit that an issuer has not verified as a current mineral resource or mineral reserve, and which was prepared before the issuer acquiring, or entering into an agreement to acquire, an interest in the property that contains the deposit. |
|---|---|
| In Situ | In place, i.e. within unbroken rock. |
| Indicated Mineral Resource | An Indicated Mineral Resource is that part of a Mineral Resource for which quantity, grade or quality, densities, shape and physical characteristics are estimated with sufficient confidence to allow the application of Modifying Factors in sufficient detail to support mine planning and evaluation of the economic viability of the deposit. |
| Geological evidence is derived from adequately detailed and reliable exploration, sampling and testing and is sufficient to assume geological and grade or quality continuity between points of observation. |
|
| An Indicated Mineral Resource has a lower level of confidence than that applying to a Measured Mineral Resource and may only be converted to a Probable Mineral Reserve. |
|
| Induced Polarization | The production of a double layer of charge at a mineral interface, or production of changes in double-layer density of charge, brought about by application of an electric or magnetic field (induced electrical or magnetic polarization). Induced electrical polarization is manifested either by a decay of voltage in the Earth following the cessation of an excitation current phase, or by a frequency dependence of the apparent resistivity of the Earth. |
| Industrial Mineral | An Industrial Mineral is any rock, mineral or other naturally occurring substance of economic value, exclusive of metallic ores, mineral fuels and gemstones; that is, one of the non-metallic minerals. |
| Indurated | Said of rock or soil hardened or consolidated by pressure, cementation, or heat. |
| Inferred Mineral Resource | An Inferred Mineral Resource is that part of a Mineral Resource for which quantity and grade or quality are estimated on the basis of limited geological evidence and sampling. Geological evidence is sufficient to imply but not verify geological and grade or quality continuity. |
| An Inferred Mineral Resource has a lower level of confidence than that applying to an Indicated Mineral Resource and must not be converted to a Mineral Reserve. It is reasonably expected that the majority of Inferred Mineral Resources could be upgraded to Indicated Mineral Resources with continued exploration. |
|
| Interbedded | Occurring between beds or lying in a bed parallel to other beds of different material. |
| Karst | A distinctive topography that indicates dissolution of underlying soluble rocks by surface water or ground water. … The development of all karst landforms requires the presence of rock which is capable of being dissolved by surface water or ground water. The term karst describes a distinctive topography that indicates dissolution (also called chemical solution) of underlying soluble rocks by surface water or ground water. … The degree of development of karst landforms varies greatly from region to region. Large drainage systems in karst areas are likely to have both fluvial (surface) and karst (underground) drainage components. USGS OFR 97-536-A |
| Karst Development in Limestone | |
|---|---|
| Kilograms | Base unit of mass in the metric system. 1 kg = 1,000 grams = 2.2046 pounds. |
| Kilometre | One thousand metres. |
| Level | The workings of a mine which are on the same horizontal place. |
| Ligneous | Rocks solidified from molten material often produced as result of volcanic activity. |
| Lode | A mineral deposit consisting of a zone of veins. |
| London Price (or Fixing) | The twice daily (a.m. or p.m.) gold price fixing determined by the London Gold Market. |
| Matrix | The rock material in which a fossil, crystal, or mineral is embedded. |
| Measured Mineral Resource |
A Measured Mineral Resource is that part of a Mineral Resource for which quantity, grade or quality, densities, shape, and physical characteristics are estimated with confidence sufficient to allow the application of Modifying Factors to support detailed mine planning and final evaluation of the economic viability of the deposit. Geological evidence is derived from detailed and reliable exploration, sampling and testing and is sufficient to confirm geological and grade or quality continuity between points of observation. A Measured Mineral Resource has a higher level of confidence than that applying to either an Indicated Mineral Resource or an Inferred Mineral Resource. It may be converted to a Proven Mineral Reserve or to a Probable Mineral Reserve. |
| Meta- | A prefix that, when used with the name of sedimentary or igneous rock, indicates that the rock has been metamorphosed, e.g. metabasalt. |
| Metallurgical Recovery | Proportion of metal in mill feed which is recovered by a metallurgical process or processes. |
| Metallurgy | The science and art of separating metals and metallic minerals from their ores by mechanical and chemical processes; the preparation of metalliferous materials from raw ore. |
| Metamorphism | The mineralogical, chemical, and structural adjustment of solid rocks to physical and chemical conditions that have generally been imposed at depth below the surface zones of weathering and cementation, and that differ from the conditions under which the rocks in question originated. |
| Metre | Base unit of length in the metric system. 1 m = 3.28084 feet. |
| Mil | One thousandth of an inch. |
| Mill | A mineral treatment plant in which crushing, wet grinding, and further treatment of mineralized rock is conducted. Also, separate components, such as ball mill, hammer mill, and rod mill. |
| Mineable | That portion of a resource for which extraction is technically and economically feasible. |
|---|---|
| Mineralized | Rock which has undergone mineralization. |
| Mineral Claim | Title issued by the Government concerned to an individual or group, which grants that individual or group the right to explore for or exploit mineral wealth in a specified area by approved methods in accordance with the ruling laws and regulations. |
| Mineral Reserve | A Mineral Reserve is the economically mineable part of a Measured and/or Indicated Mineral Resource. It includes diluting materials and allowances for losses, which may occur when the material is mined or extracted and is defined by studies at Pre-Feasibility or Feasibility level as appropriate that include application of Modifying Factors. Such studies demonstrate that, at the time of reporting, extraction could reasonably be justified. |
| The reference point at which Mineral Reserves are defined, usually the point where the ore is delivered to the processing plant, must be stated. It is important that, in all situations where the reference point is different, such as for a saleable product, a clarifying statement is included to ensure that the reader is fully informed as to what is being reported. |
|
| The public disclosure of a Mineral Reserve must be demonstrated by a Pre Feasibility Study or Feasibility Study. |
|
| Mineral Resource | A Mineral Resource is a concentration or occurrence of solid material of economic interest in or on the Earth's crust in such form, grade or quality and quantity that there are reasonable prospects for eventual economic extraction. |
| The location, quantity, grade or quality, continuity and other geological characteristics of a Mineral Resource are known, estimated or interpreted from specific geological evidence and knowledge, including sampling. |
|
| Mineralization | The process or processes by which a mineral or minerals are introduced into a rock, resulting, in a valuable or potentially valuable deposit. |
| Mineralized Zone | Any mass of host rock in which minerals of potential commercial value occur. |
| NI 43-101 | National Instrument 43-101 Standards of Disclosure for Mineral Projects. |
| NSR | Net Smelter Royalty or Net Smelter Return, a royalty based on the price of metal (gold) realized after deducting the cost of refining. |
| Open-Pit/ Open-Cut | Surface mining in which the mineralized rock is extracted from a pit. The geometry of the pit may vary with the characteristics of the orebody. |
| Ore | Rock that contains one or more minerals or metals, at least one of which has commercial value, and which can be recovered at a profit. |
| Orebody | A continuous well-defined mass of mineralized rock of sufficient volume to make extraction economically feasible. |
| Permeability | The property of rock or soil that permits water to pass by flowing through interconnected voids (spaces). Permeable bedrock makes a good aquifer, a rock layer that yields water to wells. USGS OFR 97-536-A. |
| Podzol soils | Podzolic soils are forested soils found primarily on sandy deposits in ecozones (or parts of ecozones) where the mean annual precipitation is above 700 mm. Coniferous-dominated plant communities are the major vegetation type found on Podzolic soils. Podzolic soils have B horizons that are enriched with amorphous material composed of humified organic matter, aluminum and iron. These soils generally have organic surface horizons, a light coloured eluvial horizon (which may be absent), and a reddish to black B horizon with an abrupt upper boundary. |
| Porosity | The volume of void space (space filled with air or water) in soil or bedrock. When these voids are interconnected, water or air (or other fluids) can migrate from void to void. Thus interconnected pores make the soil or bedrock permeable. USGS OFR 97-536-A. |
||
|---|---|---|---|
| Percussion Drilling | A drilling method which involves advancing the hole by means of a pneumatically operated hammer. |
||
| Pound | Avoirdupois pound. An imperial system unit of mass, commonly referred to as the 'pound'. 1 pound = 0.45359237 kg. |
||
| Precambrian | All geological time and the corresponding rocks before the beginning of the Paleozoic Era (i.e. older than approximately 570 million years). |
||
| Preliminary Economic Assessment |
Means a study, other than a Pre-Feasibility or Feasibility Study, that includes an economic analysis of the potential viability of mineral resources. |
||
| Preliminary Feasibility Study |
A Pre-Feasibility Study is a comprehensive study of a range of options for the technical and economic viability of a mineral project that has advanced to a stage where a preferred mining method, in the case of underground mining, or the pit configuration, in the case of an open-pit, is established and an effective method of mineral processing is determined. It includes a financial analysis based on reasonable assumptions on the Modifying Factors and the evaluation of any other relevant factors which are sufficient for a Qualified Person, acting reasonably, to determine if all or part of the Mineral Resource may be converted to a Mineral Reserve at the time of reporting. A Pre-Feasibility Study is at a lower confidence level than a Feasibility Study. |
||
| Pre-stripping | Removal of overburden in advance of beginning operations to remove mineralized rock in an open-pit operation. |
||
| Probable Mineral Reserve | A Probable Mineral Reserve is the economically mineable part of an Indicated, and in some circumstances, a Measured Mineral Resource. The confidence in the Modifying Factors applying to a Probable Mineral Reserve is lower than that applying to a Proven Mineral Reserve. |
||
| Proven Mineral Reserve | A Proven Mineral Reserve is the economically mineable part of a Measured Mineral Resource. A Proven Mineral Reserve implies a high degree of confidence in the Modifying Factors. |
||
| Qualified Person | Means an individual who (a) is an engineer or geoscientist with a university degree, or equivalent accreditation, in an area of geoscience, or engineering, relating to mineral exploration or mining; (b) has at least five years of experience in mineral exploration, mine development or operation, or mineral project assessment, or any combination of these, that is relevant to his or her professional degree or area of practice; (c) has experience relevant to the subject matter of the mineral project and the technical report; (d) is in good standing with a professional association; and (e) in the case of a professional association in a foreign jurisdiction, has a |
| membership designation that (i) requires attainment of a position of responsibility in their profession that requires the exercise of independent judgment; and (ii) requires |
|
|---|---|
| A. a favourable confidential peer evaluation of the individual's character, professional judgement, experience, and ethical fitness; or B. a recommendation for membership by at least two peers and demonstrated prominence or expertise in the field of mineral exploration or mining. |
|
| Quotational Period | The "quotational period" or the period during which the metal prices are established is usually stated in the metal payment clause. The quotational period may vary from calendar month prior to shipment to third or fourth calendar month following date of delivery. |
| Reagent | A chemical substance used to induce a chemical reaction. |
| Reclamation | The process by which lands disturbed as a result of mining activity are reclaimed back to a beneficial land use. Reclamation activity includes the removal of buildings, equipment, machinery and other physical remnants of mining, closure of tailings impoundments, leach pads and other mine features, and contouring, covering and revegetation of waste rock piles and other disturbed areas. |
| Recovery Rate | A term used in process metallurgy to indicate the proportion of valuable material obtained in the processing of an ore. It is generally stated as a percentage of the material recovered compared to the total material present. |
| Refining | The final stage of metal production in which final impurities are removed from the molten metal by introducing air and fluxes. The impurities are removed as gases or slag. |
| Refractory Ore | Any mineralized rock that does not respond to conventional mineral processing (cyanidation) to produce acceptable product recoveries without an intermediate step to address its refractory attributes (usually, but not always, some form or oxidation). |
| Reverse Circulation Drilling | A drilling method employing double walled drill rods. The drilling fluid (usually air or water) is pushed down the annulus between the rods. The cuttings are blown up in the middle. |
| Run-of-the-Mine (ROM) | Rock of various sizes resulting from blasting activities within the stone before any further processing is undertaken on it. |
| Saddle Reef | A mineral deposit associated with the crest of an anticlinal fold and following the bedding planes, usually found in vertical succession, esp. the gold-bearing quartz veins of Australia. |
| Sampling | Samples of soils, stream sediments or rock chips taken to determine the quantities of trace and minor elements. |
| Sedimentary | Formed by the deposition of solid fragmental material that originates from weathering of rocks and is transported from its source to a site of deposition. |
| Settling Pond | A pond, natural or artificial, for recovering the solids from a washery effluent. |
| Shaft | A vertical or inclined excavation in rock for the purpose of providing access to an orebody. Usually equipped with a hoist at the top, which lowers and raises a conveyance for handling workers and materials. |
| Sinkholes | (also known as dolines) - A closed surface depression draining underground in karst landscape. Sinkholes are often "bowl-shaped" and can be a few to many hundreds of metres in diameter. USGS OFR 97-536-A. |
| Siltstone | An indurated silt having the texture and composition of shale but lacking its fine lamination or fissility; a massive mudstone in which the silt predominates over the lay; a nofissile silt shale. |
| Slate | A compact, fine-grained metamorphic rock that possesses slaty cleavage and hence can be split into slabs and thin plates. Most slate was formed from shale. |
|---|---|
| Slime | Extremely fine sediment (0 mesh), produced in the processing of mineralized rock or rock, especially phosphate rock, which remains suspended in water indefinitely. Consists chiefly of clay. |
| Slurry | A fluid comprising fine solids suspended in a solution (generally water containing additives). |
| Smelter | An establishment where ores are smelted to produce metal. |
| Smelting | Thermal process whereby molten metal is liberated from a concentrate, with impurities separating into a lighter slag. |
| Soil sampling | Samples of soils taken to explore for mineral deposits. |
| Stockpile | A store of unprocessed mineralized material or marginal grade material. |
| Stratigraphic | Pertaining to the composition, sequence, and correlation of stratified rocks. |
| Strike Length | Horizontal distance along the direction that a structural surface takes as it intersects the horizontal. |
| Sump | Reservoir to collect fluids for pumping. |
| Syncline | A fold in which the core contains the stratigraphically younger rocks; it is generally concave upward. Antonym of Anticline. |
| Tailings | The gangue and other refuse material resulting from the washing, concentration, or treatment of ground ore. |
| Tailings Pond | Area closed at lower end by constraining wall or dam to which mill effluents are run. Clear water may be returned after settlement in a dam, via penstock(s) and piping. |
| Technical Report | Means a report prepared and filed in accordance with this Instrument [NI 43-101] and Form 43-101F1 Technical Report that includes, in summary form, all material scientific and technical information in respect of the subject property as of the effective date of the technical report |
| Ton | Short ton. An imperial system unit of mass, commonly referred to as the 'ton'. 1 ton = 2,000 pounds = 907.18474 kg. |
| Tonne | Also called the 'metric tonne'. 1 tonne = 1,000 kilograms = 2,204.6 pounds. |
| Total Cash Cost per Ounce (TCC) |
A measure of the average cost of producing an ounce of gold, calculated by dividing the total operating costs in a period by the total gold production over the same period. |
| Thermal Stress | Temperature changes cause the body to expand or contract. The amount of linear change depends upon the material and the constraints to movement. |
| Turbidite | A sediment or rock deposited from, or inferred to have been deposited from, a turbidity current. It is characterized by graded bedding, moderate sorting, and well developed primary structures. |
| Turbidity Current | A density current in water, air, or other fluid, caused by different amounts of matter in suspension, such as dry-snow avalanche or a descending cloud of volcanic dust; specifically, a bottom-flowing current laden with suspended sediment, moving swiftly (under the influence of gravity) down a subaqueous slope and spreading horizontally on the floor of the body of water. |
| VLF-EM | Very Low Frequency Electromagnetics. A geophysical technique that relies on VLF broadcasts inducing secondary responses in rock. |
| Waste | Rock lacking sufficient grade and/or other characteristics of mineralized rock to be economic. |
| Water Table | The surface between the zone of pure saturation and zone of pure aeration underground. USGS OFR 97-536-A. |
| Zinc chloride | Chemical compounds with the formula ZnCl2 and its hydrates. Zinc chlorides, of which nine crystalline forms are known, are colorless or white, and are highly |
|---|---|
| soluble in water. |