AI Terminal
MONTANARO EUROPEAN SMALLER C.TSTPLC
Interim / Quarterly Report • Oct 31, 2025
5187_ir_2025-10-31_904d1fc8-7d1b-4b6c-92e5-897690804622.html
Interim / Quarterly Report
Open in ViewerOpens in native device viewer
National Storage Mechanism | Additional information 
RNS Number : 5686F
Montanaro European Smaller C.TstPLC
31 October 2025
| Montanaro European Smaller Companies Trust plc |
| LEI: 213800CWSC5B8BG3RS21 |
| Unaudited Half-Yearly Report for the Six Months Ended 30 September 2025 |
The Board of Montanaro European Smaller Companies Trust plc (the 'Company' or 'MESCT') announces the unaudited half-yearly results of the Company for the six months ended 30 September 2025.
Highlights
Performance
| 6 months | 1 year | 3 year | 5 year | 10 year | MAM* | |
| Capital Returns%² | ||||||
| Share price | 13.5% | 16.2% | 56.9% | 20.1% | 225.9% | 427.8% |
| Net Asset Value ('NAV') per Ordinary share** | 13.1% | 10.9% | 47.6% | 27.7% | 221.3% | 435.9% |
| Benchmark (Composite) ¹** | 13.2% | 13.0% | 38.2% | 30.6% | 116.5% | 222.0% |
| Total Returns%² | ||||||
| Share price | 14.1% | 17.1% | 60.6% | 24.3% | 254.8% | 556.4% |
| NAV per Ordinary share** | 13.7% | 11.7% | 50.7% | 31.8% | 247.0% | 551.4% |
| Benchmark (Composite)¹** | 15.4% | 15.8% | 48.5% | 45.7% | 164.0% | 368.7% |
Sources: Morningstar Direct, Association of Investment Companies ('AIC'), Montanaro Asset Management Limited ('MAM' or 'Montanaro').
| As at 30 September 2025 |
As at 30 September 2024 |
12 month % change |
As at 31 March 2025 (Audited) |
6 month % change |
|
| Ordinary share price | 168.5p | 145.0p | 16.2% | 148.5p | 13.5% |
| NAV per Ordinary share** | 183.2p | 165.2p | 10.9% | 162.0p | 13.1% |
| Discount to NAV² | (8.0)% | (12.2)% | (8.3)% | ||
| Net assets** (£'000s) | 273,166 | 313,020 | (12.7)% | 291,508 | (6.3)% |
| Market capitalisation** (£'000s) | 251,243 | 274,670 | (8.5)% | 267,188 | (6.0)% |
| Net gearing employed² | 6.1% | 1.7% | 2.1% |
| 6 months ended 30 September 2025 |
6 months ended 30 September 2024 |
% change | 12 months ended 31 March 2025 (Audited) |
|
| Revenue return per Ordinary share | 1.80p | 1.56p | 15.4% | 1.50p |
| Dividends per Ordinary share | 0.4p | 0.3p | 1.26p | |
| Ongoing charges (annualised)² | 1.0% | 1.0% | 1.0% | |
| Portfolio turnover (annualised)** | 33.0% | 10.0% | 14.0% |
*From 5 September 2006, when MAM was appointed as Investment Manager.
**Details provided in the Glossary below.
1 From 5 September 2006, the benchmark was the MSCI Europe SmallCap Index. The benchmark was changed on 1 June 2009 to the MSCI Europe SmallCap (ex-UK) Index (in sterling terms).
2 Refer to Alternative Performance Measures below.
Chairman's Statement
Performance
In the first six months of the financial year the Net Asset Value of your Company rose by 13.1% to 183.2p per share. In comparison the Company's Benchmark (MSCI Europe SmallCap (ex-UK) Index) rose by 13.2%.
During the period, the share price discount to NAV narrowed from 8.3% to 8.0%. As a result, the share price rose by 13.5%, resulting in a total return of 14.1%. The total return of the Benchmark was 15.4%.
Since Montanaro were appointed in September 2006, the annualised NAV total return has been 10.3 %, 1.9% p.a. ahead of the Company's Benchmark.
Montanaro have a long-term investment approach, exclusively focused on investing in high quality, growing companies. Recently, style headwinds have persisted and weighed on relative returns: for example, during this reporting period, Quality has lagged the broader European market by more than 5%, as investors favoured lower-quality, more cyclical names. Despite this backdrop, the Board believes stock selection - adjusted for these style swings - remains positive which is the key determinant of long term future success.
Earnings and Dividends
Revenue earnings per share rose to 1.80p in the period (2024: 1.56p). To reflect the increased underlying earnings from the portfolio the Board has declared a first interim dividend relating to the year ending 31 March 2026 of 0.35p per Ordinary share (2024: 0.3p per share). Additionally, the Board has also declared a third interim dividend relating to the year ended 31 March 2025 of 0.05p per Ordinary share. Both dividends are payable together on 5 January 2026 to shareholders on the register on 5 December 2025.
Share Buybacks and Treasury Shares
During the period, the Company bought back 30,819,178 Ordinary shares. As a result the Company held 40,322,099 Ordinary shares in Treasury as at 30 September 2025. The buyback activity has helped the Trust to maintain a single-figure discount throughout the last six months. Our stated policies on share buybacks and share issuances are set out in the Annual Report. It is worth noting that while this activity has raised the stated portfolio turnover of the Company, the underlying name turnover remains low in line with Montanaro's long-term investment approach.
Borrowings
At the end of the period, the Company had gearing, net of cash, of 6.1% (31 March 2025: 2.1%). The Company's borrowing facilities are due to mature on 13 September 2026, when they are expected to be renewed.
Regular Tenders
As previously announced on 27 March 2025, the Board has introduced twice-yearly tender offers to provide shareholders with the opportunity to realise part of their investment and enhance liquidity. The documentation for the first Tender Offer was sent to shareholders on 20 October 2025.
Shares will be repurchased at a 5% discount to NAV, with each offer capped at 5% of shares in issue to balance liquidity and protect existing shareholders. This initiative is in addition to the Company's ongoing share buyback programme, offering shareholders increased flexibility and complementing the Company's long-term approach to shareholder value.
Shareholders wishing to participate in the first Tender Offer should complete and submit their Tender Form to the Company's Registrar Equiniti by 13:00 GMT on 19 November 2025 to ensure participation in the tender.
The Board
As previously announced, I intend to retire as Chairman and from the Board on 31 December 2025. We are very fortunate that Gordon Neilly has agreed to assume the role of Chairman. With his extensive experience of the investment trust sector there can be no better person to lead our Company in the future.
Investor Presentation
Gordon Neilly, non-executive Director and Chairman Designate, and George Cooke, manager of MESCT and Head of Investments at Montanaro, will provide a live presentation relating to the publication of the Interim Results via Investor Meet Company ("IMC") on Tuesday, 4 November 2025 at 11:00 GMT.
The presentation is open to all existing and potential shareholders of the Company. Shareholders are invited to submit written questions via the platform in advance of the meeting via the IMC dashboard up until 09:00 GMT on 4 November 2025 or at any time during the meeting.
Investors can sign up to IMC for free and register for the presentation via:
https://www.investormeetcompany.com/companies/montanaro-european-smaller-c-tst-plc/rns
Outlook
The valuation of European SmallCap continues to look cheap both relative to its own history and to the wider European market. This is despite SmallCap modestly outperforming LargeCap over the last one and two years. It may prove too early to call a decisive turning point and resumption of the longer-term historical trend of SmallCap outperformance, but the preconditions for it look increasingly favourable.
After a relatively prolonged period in which the Company's Quality Growth style has been out of favour, it is natural to ask when this headwind might abate or reverse. It is impossible to say with precision, but we note that Growth companies have now recorded their longest and deepest period of underperformance relative to Value since before the Great Financial Crisis, while Quality has seen similarly historic drawdowns both in Europe and wider global markets. It is of course when assets are most out of favour that they can represent the best long term investment opportunities.
The investment process at Montanaro continues to identify profitable, high return businesses that are off the beaten track for most investors ("hidden gems"). The quality of the companies in your portfolio remains as high as ever (and the Board and manager remain mindful of the risks of style drift). Montanaro also continues to deepen resources in support of their long-standing, experienced research team which provides a real competitive advantage.
It has been a privilege to serve as both a Non-Executive Director and Chairman of your Company over the last decade, during a period of extraordinary change for the investment trust sector. I leave it in good hands under the care of my fellow Directors and the team at Montanaro and we can all look forward to the future of the Company with great confidence.
Portfolio Summary
Twenty Largest Holdings
As at 30 September 2025
| Holding | Country | Description | Value £'000 |
% of Net Assets |
| Kitron | Norway | Electronics manufacturing services | 14,120 | 5.17% |
| ATOSS Software | Germany | Workforce management software | 11,441 | 4.19% |
| Plejd | Sweden | Smart lighting controls | 10,900 | 3.99% |
| Belimo | Switzerland | Actuators, sensors and valves | 10,873 | 3.98% |
| MTU Aero Engines | Germany | Aircraft engine components | 10,207 | 3.74% |
| NCAB | Sweden | Printed circuit boards | 9,655 | 3.53% |
| CTS Eventim | Germany | Event ticketing solutions | 9,460 | 3.46% |
| Reply | Italy | IT consulting services | 7,936 | 2.91% |
| VZ Holding | Switzerland | Independent wealth management | 7,766 | 2.84% |
| ChemoMetec | Denmark | Cell counters, lab instruments | 7,281 | 2.67% |
| Merlin Properties | Spain | Spanish commercial REIT | 7,258 | 2.66% |
| Kardex | Switzerland | Automated storage solutions | 7,220 | 2.64% |
| Sectra | Sweden | Medical imaging and cybersecurity | 6,771 | 2.48% |
| AAK | Sweden | Specialty vegetable oils | 6,758 | 2.47% |
| Brembo | Netherlands | Automotive braking systems | 6,668 | 2.44% |
| Carel | Italy | HVAC/R controls, humidification | 6,537 | 2.39% |
| Viscofan | Spain | Sausage casings manufacturer | 6,534 | 2.39% |
| IMCD | Netherlands | Specialty chemical distribution | 6,529 | 2.39% |
| Melexis | Belgium | Automotive sensors | 6,449 | 2.36% |
| Tobii Dynavox | Sweden | Assistive communication devices | 6,321 | 2.32% |
| Twenty Largest Holdings | 166,684 | 61.02% |
Geographical Analysis
As at 30 September 2025
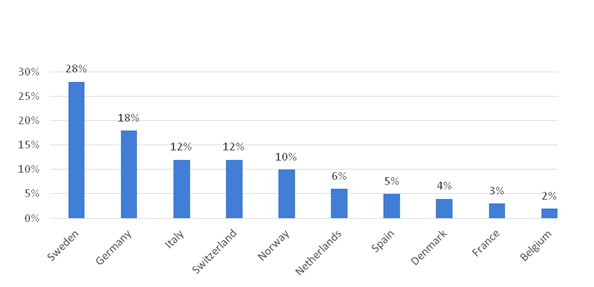
Source: Juniper Partners Limited
Sector Analysis
As at 30 September 2025
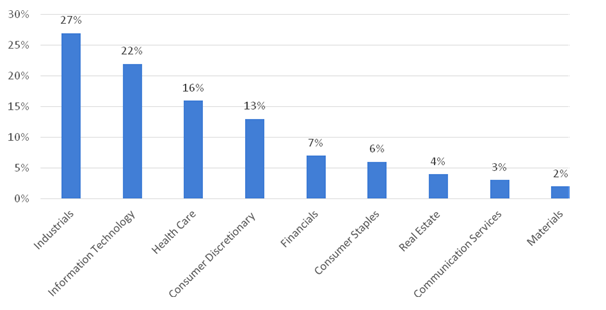
Source: Juniper Partners Limited
Interim Management Report
The important events that have occurred during the period under review and the key factors influencing the financial statements are set out in the Chairman's Statement above.
Statement of Principal Risks and Uncertainties
Most of the principal risks that could threaten the Company's objective, strategy, future returns and solvency are market related and comparable to those of other investment trusts investing primarily in quoted securities. The principal risks faced by the Company are investment and strategic, gearing, financial, discount volatility, regulatory, operational, cyber security, ESG and manager risks. These risks and the way in which they are mitigated are described in more detail under the heading 'Principal and Emerging Risks and Uncertainties and Risk Mitigation' within the Business Model and Strategy section on pages 19 to 22 of the Company's Annual Report for the year ended 31 March 2025. The Company's principal risks and uncertainties have not changed materially since the date of that report and are not expected to change materially for the remaining six months of the Company's financial year.
Related Party Transactions
Related party transactions are disclosed in note 13 below. There have been no material changes to the related party transactions described in the last Annual Report.
Going Concern
The Directors are satisfied that the Company has sufficient resources to continue in operation for the foreseeable future and for a period of at least 12 months from the date of this report. Accordingly, they continue to adopt the going concern basis in preparing the condensed financial statements.
Directors' Responsibility Statement in respect of the Half-Yearly Report
We confirm that to the best of our knowledge:
· the condensed set of financial statements have been prepared in accordance with IAS 34 'Interim Financial Reporting' and give a true and fair view of the assets, liabilities, financial position and profit or loss of the Company;
· the Interim Management Report includes a fair review of the information required by the Disclosure Guidance and Transparency Rule ('DTR') 4.2.7R, being an indication of important events that have occurred during the first six months of the financial year and their impact on the financial statements;
· the Statement of Principal Risks and Uncertainties shown above is a fair review of the information required by DTR 4.2.7R; and
· the Chairman's Statement, together with the condensed set of financial statements, include a fair review of the information required by DTR 4.2.8R, being related party transactions that have taken place in the first six months of the financial year and that have materially affected the financial position or performance of the Company during the period, and any changes in the related party transactions described in the last Annual Report that could do so.
The Half-Yearly Report and Accounts were approved by the Board and the above responsibility statement was signed on its behalf by:
R M CURLING
Chairman
30 October 2025
Condensed Income Statement (unaudited)
for the six months to 30 September 2025
| Six months to 30 September 2025 £'000 |
Six months to 30 September 2024 £'000 |
Year to 31 March 2025 (audited) £'000 |
||||||||
| Note | Revenue | Capital | Total | Revenue | Capital | Total | Revenue | Capital | Total | |
| £'000 | £'000 | £'000 | £'000 | £'000 | £'000 | £'000 | £'000 | £'000 | ||
| Gains/(losses) on investments at | ||||||||||
| fair value through profit or loss | - | 33,015 | 33,015 | - | (50) | (50) | - | (5,074) | (5,074) | |
| Exchange (losses)/gains | - | (776) | (776) | - | 61 | 61 | - | (52) | (52) | |
| Revenue | ||||||||||
| Investment income 3 | 4,365 | - | 4,365 | 4,386 | - | 4,386 | 5,182 | - | 5,182 | |
| Total income | 4,365 | 32,239 | 36,604 | 4,386 | 11 | 4,397 | 5,182 | (5,126) | 56 | |
| Expenditure | ||||||||||
| Management expenses 4 | (385) | (716) | (1,101) | (431) | (800) | (1,231) | (865) | (1,608) | (2,473) | |
| Other expenses | (456) | - | (456) | (370) | - | (370) | (761) | - | (761) | |
| Total expenditure | (841) | (716) | (1,557) | (801) | (800) | (1,601) | (1,626) | (1,608) | (3,234) | |
| Return before finance costs and taxation | 3,524 | 31,523 | 35,047 | 3,585 | (789) | 2,796 | 3,556 | (6,734) | (3,178) | |
| Finance costs | (151) | (283) | (434) | (85) | (159) | (244) | (183) | (340) | (523) | |
| Return before taxation | 3,373 | 31,240 | 34,613 | 3,500 | (948) | 2,552 | 3,373 | (7,074) | (3,701) | |
| Taxation | (475) | - | (475) | (547) | - | (547) | (536) | - | (536) | |
| Return after taxation | 2,898 | 31,240 | 34,138 | 2,953 | (948) | 2,005 | 2,837 | (7,074) | (4,237) | |
| Return per share 5 | 1.80p | 19.43p | 21.23p | 1.56p | (0.50p) | 1.06p | 1.50p | (3.75p) | (2.25p) | |
The total column of this statement represents the Company's Income Statement and Statement of Comprehensive Income, prepared in accordance with UK-adopted International Accounting Standards in conformity with the Companies Act 2006.
The supplementary revenue return and capital return columns are both prepared under guidance published by the AIC.
All revenue and capital items in the above statement derive from continuing operations. No operations were acquired or discontinued during the period.
Condensed Balance Sheet (unaudited) as at 30 September 2025
| Note | As at 30 September 2025 £'000 |
As at 30 September 2024 £'000 |
As at 31 March 2025 £'000 (audited) |
|
| Non-current assets | ||||
| Investments held at fair value through profit or loss | 7 | 288,582 | 318,654 | 296,829 |
| Current assets | ||||
| Trade and other receivables | 2,866 | 812 | 1,592 | |
| Cash and cash equivalents | 2,380 | 2,804 | 14,816 | |
| 5,246 | 3,616 | 16,408 | ||
| Total assets | 293,828 | 322,270 | 313,237 | |
| Current liabilities | ||||
| Trade and other payables | (1,484) | (983) | (839) | |
| Revolving credit facility | 8 | (10,477) | - | (12,560) |
| Interest-bearing bank loan | 8 | (8,701) | - | - |
| (20,662) | (983) | (13,399) | ||
| Non-current liabilities | ||||
| Interest-bearing bank loan | 8 | - | (8,267) | (8,330) |
| Total liabilities | (20,662) | (9,250) | (21,729) | |
| Net assets | 273,166 | 313,020 | 291,508 | |
| Capital and reserves | ||||
| Ordinary share capital | 9 | 9,471 | 9,471 | 9,471 |
| Share premium account | 44,057 | 44,057 | 44,057 | |
| Capital redemption reserve | 2,212 | 2,212 | 2,212 | |
| Capital reserve | 211,027 | 251,573 | 230,745 | |
| Revenue reserve | 6,399 | 5,707 | 5,023 | |
| Total shareholders' funds | 273,166 | 313,020 | 291,508 | |
| Net asset value per share | 10 | 183.2p | 165.2p | 162.0p |
Condensed Statement of Changes in Equity (unaudited)
for the six months ended 30 September 2025
| Share capital £'000 |
Share premium account £'000 |
Capital redemption reserve £'000 |
Capital reserve £'000 |
Revenue reserve £'000 |
Total £'000 |
|
| As at 1 April 2025 | 9,471 | 44,057 | 2,212 | 230,745 | 5,023 | 291,508 |
| Return after taxation | - | - | - | 31,240 | 2,898 | 34,138 |
| Dividends paid | - | - | - | - | (1,522) | (1,522) |
| Share buybacks | - | - | - | (50,958) | - | (50,958) |
| Balance at 30 September 2025 | 9,471 | 44,057 | 2,212 | 211,027 | 6,399 | 273,166 |
for the six months ended 30 September 2024
| Share capital £'000 |
Share premium account £'000 |
Capital redemption reserve £'000 |
Capital reserve £'000 |
Revenue reserve £'000 |
Total £'000 |
|
| As at 1 April 2024 | 9,471 | 44,057 | 2,212 | 252,521 | 4,459 | 312,720 |
| Return after taxation | - | - | - | (948) | 2,953 | 2,005 |
| Dividends paid | - | - | - | - | (1,705) | (1,705) |
| Balance at 30 September 2024 | 9,471 | 44,057 | 2,212 | 251,573 | 5,707 | 313,020 |
for the year ended 31 March 2025 (audited)
| Share capital £'000 |
Share premium account £'000 |
Capital redemption reserve £'000 |
Capital Reserve £'000 |
Revenue reserve £'000 |
Total £'000 |
|
| As at 1 April 2024 | 9,471 | 44,057 | 2,212 | 252,521 | 4,459 | 312,720 |
| Return after taxation | - | - | - | (7,074) | 2,837 | (4,237) |
| Dividends paid | - | - | - | - | (2,273) | (2,273) |
| Share buybacks | - | - | - | (14,702) | - | (14,702) |
| Balance at 31 March 2025 | 9,471 | 44,057 | 2,212 | 230,745 | 5,023 | 291,508 |
Condensed Statement of Cash Flows (unaudited)
for the six months ended 30 September 2025
| Six months to 30 September 2025 £'000 |
Six months to 30 September 2024 £'000 |
Year to 31 March 2025 (audited) £'000 |
|
| Net cash inflow from operating activities | 42,654 | 5,515 | 20,526 |
| Net cash outflow from financing activities | (55,185) | (2,792) | (5,744) |
| (12,531) | 2,723 | 14,782 | |
| Exchange gains/(losses) | 95 | (161) | (208) |
| (Decrease)/increase in cash and cash equivalents | (12,436) | 2,562 | 14,574 |
| Reconciliation of profit before finance costs and taxation to net cash inflow from operating activities | |||
| Return before taxation | 34,613 | 2,552 | (3,701) |
| (Gains)/losses on investments held at fair value | (33,015) | 50 | 5,074 |
| Exchange losses/(gains) | 776 | (61) | 52 |
| Finance costs | 434 | 244 | 523 |
| Withholding tax | (475) | (567) | (557) |
| Purchases of investments | (6,458) | (12,113) | (22,379) |
| Sales of investments | 46,943 | 15,308 | 41,415 |
| Changes in working capital and other non-cash items | (164) | 102 | 99 |
| Net cash inflow from operating activities | 42,654 | 5,515 | 20,526 |
Notes to the Accounts (unaudited )
1. The condensed unaudited financial statements have been prepared in accordance with International Financial Reporting Standard ('IFRS') IAS 34 'Interim Financial Reporting' and the accounting policies set out in the statutory accounts of the Company for the year ended 31 March 2025. The condensed financial statements do not include all the information required for a complete set of IFRS financial statements and should be read in conjunction with the financial statements of the Company for the year ended 31 March 2025, which were prepared in accordance with the requirements of the Companies Act 2006 and in accordance with UK-adopted international accounting standards.
2. Earnings for the first six months should not be taken as a guide to the results for the full year.
3. Income for the period is derived from:
| Six months to 30 September 2025 £'000 |
Six months to 30 September 2024 £'000 |
Year to 31 March 2025 (audited) £'000 |
|
| Overseas dividend income | 4,335 | 4,353 | 5,102 |
| Exchange losses | (6) | (6) | (4) |
| Other income | 36 | 39 | 84 |
| Total | 4,365 | 4,386 | 5,182 |
4. Management fee
As set out in the Company's Annual Report, the management fee is linked to the size of the Company, as follows:
· 0.825% p.a. of the amount of the Company's market capitalisation up to £500 million;
· 0.70% p.a. of the amount of the Company's market capitalisation between
£500 million and £750 million; and
· 0.65% p.a. of the amount of the Company's market capitalisation above £750 million.
The management fee is payable quarterly in arrears.
5. Return per share
Earnings per share is based on a weighted average of 160,779,892 Ordinary shares in issue during the period (year ended 31 March 2025: 188,678,279 and six months ended 30 September 2024: 189,427,600), excluding those shares bought back and held in treasury.
6. Dividends
The Board has declared a first interim dividend relating to the year ending 31 March 2026 of 0.35p per Ordinary share (2024: 0.3p per share). Additionally, the Board has also declared a third interim dividend relating to the year ended 31 March 2025 of 0.05p per Ordinary share. Both dividends are payable on 5 January 2026 to shareholders on the register on 5 December 2025. In accordance with IFRS, these dividends have not been recognised in these financial statements.
A second interim dividend relating to the year ended 31 March 2025 of 0.96p per Ordinary share was paid during the six months to 30 September 2025 and amounted to £1,522,000.
7. Investments at fair value through profit or loss
| 30 September 2025 £'000 |
30 September 2024 £'000 |
31 March 2025 £'000 (audited) |
|
| Opening book cost | 195,905 | 193,353 | 193,353 |
| Holding gains | 100,924 | 128,323 | 128,323 |
| Opening fair value | 296,829 | 321,676 | 321,676 |
| Purchases at cost | 6,881 | 12,333 | 22,379 |
| Sales - proceeds | (48,143) | (15,305) | (42,152) |
| Gains/(losses) on investments | 33,015 | (50) | (5,074) |
| Closing fair value | 288,582 | 318,654 | 296,829 |
| Closing book cost | 186,310 | 195,943 | 195,905 |
| Holding gains | 102,272 | 122,711 | 100,924 |
| Closing valuation | 288,582 | 318,654 | 296,829 |
8. Borrowings
Revolving credit facility
| Six months to 30 September 2025 £'000 |
Six months to 30 September 2024 £'000 |
Year to 31 March 2025 £'000 (audited) |
|
| Opening balance | 12,560 | 856 | 856 |
| Repaid loan | (8,507) | (859) | (859) |
| Draw down loan | 5,903 | - | 12,539 |
| Foreign currency exchange gain | 521 | 3 | 24 |
| Closing balance | 10,477 | - | 12,560 |
The Company has a three-year secured revolving credit facility with ING Bank N.V. ('ING') which will mature on 13 September 2026.
Drawdowns from the facility are charged at margin over the relevant EURIBOR rate. As at 30 September 2025, €12.5 million (£10,477,000) of the facility was drawn (30 September 2024: nil, 31 March 2025: €15 million (£12,560,000), at a rate of 3.68%.
Interest bearing bank loans
| Six months to 30 September 2025 £'000 |
Six months to 30 September 2024 £'000 |
Year to 31 March 2025 (audited) £'000 |
|
| Opening balance | 8,330 | 8,473 | 8,473 |
| Amortisation of set-up costs | 15 | 16 | 33 |
| Non-cash foreign currency movements | 356 | (222) | (176) |
| Closing balance | 8,701 | 8,267 | 8,330 |
The Company has a €10 million three year secured loan at a fixed rate of 5.105% per annum with ING Bank N.V. ('ING'). This loan will mature on 13 September 2026.
The carrying value of the balances above approximates to fair value.
9. Share capital
| 30 September 2025 | 31 March 2025 | |||
| (unaudited) | (audited) | |||
| Number of shares | £'000 | Number of shares | £'000 | |
| Ordinary shares of 5p | ||||
| Ordinary shares in issue at the beginning of the period | 179,924,679 | 8,996 | 189,427,600 | 9,471 |
| Ordinary shares bought back to treasury during the period | (30,819,178) | (1,541) | (9,502,921) | (475) |
| Ordinary shares in issue at the end of the period | 149,105,501 | 7,455 | 179,924,679 | 8,996 |
| Treasury shares (Ordinary shares 5p) | ||||
| Treasury shares in issue at the beginning of the year | 9,502,921 | 475 | - | - |
| Ordinary shares bought back to treasury during the year | 30,819,178 | 1,541 | 9,502,921 | 475 |
| Treasury shares in issue at the end of the year | 40,322,099 | 2,016 | 9,502,921 | 475 |
| Total Ordinary shares in issue and in treasury at the end of the year | 189,427,600 | 9,471 | 189,427,600 | 9,471 |
10. Net Asset Value per Ordinary Share
The NAV per Ordinary Share was based on 149,105,501 Ordinary shares in issue at the end of the period (31 March 2025: 179,924,679 and 30 September 2024: 189,427,600), excluding those shares bought back and held in treasury. As at 30 September 2025, there were 40,322,099 Ordinary shares held in treasury (31 March 2025: 9,502,921 and 30 September 2024: nil).
11. Fair Value Hierarchy
The Company measures fair values using the following fair value hierarchy that reflects the significance of the inputs used in making the measurements.
Categorisation within the hierarchy has been determined on the basis of the lowest level input that is significant to the fair value measurement of the relevant assets as follows:
· Level 1 - valued using quoted prices unadjusted in active markets for identical assets or liabilities.
· Level 2 - valued by reference to valuation techniques using observable inputs for the asset or liability other than quoted prices included within Level 1.
· Level 3 - valued by reference to valuation techniques using inputs that are not based on observable market data for the asset or liability.
The tables below set out fair value measurements of financial instruments as at the period end, by the level in the fair value hierarchy into which the fair value measurement is categorised.
| Level 1 £'000 |
Level 2 £'000 |
Level 3 £'000 |
Total £'000 |
|
| 30 September 2025 | ||||
| Investments | 288,582 | - | - | 288,582 |
| 30 September 2024 | ||||
| Investments | 318,654 | - | - | 318,654 |
| 31 March 2025 (audited) | ||||
| Investments | 296,829 | - | - | 296,829 |
There were no transfers between levels during the period ended 30 September 2025 (year ended 31 March 2025 and period ended 30 September 2024: None).
Other aspects of the Company's financial risk management objectives and policies are consistent with those disclosed in the financial statements, as at and for the year ended, 31 March 2025.
12. Rates of exchange (to sterling)
| 30 September 2025 |
30 September 2024 |
31 March 2025 (audited) |
|
| Danish Krone | 8.55 | 8.95 | 8.90 |
| Euro | 1.15 | 1.20 | 1.19 |
| Norwegian Krone | 13.42 | 14.10 | 13.56 |
| Swedish Krona | 12.65 | 13.58 | 12.96 |
| Swiss Franc | 1.07 | 1.13 | 1.14 |
13. Related parties
The following are considered related parties: the Board of Directors and the Manager. The Directors of the Company received fees for their services and dividends from their shareholdings in the Company as outlined below.
The amount charged by the Manager during the period was £1,101,000 (six months to 30 September 2024: £1,231,000; year to 31 March 2025: £2,473,000). At 30 September 2025, the amount due to the Manager, included in creditors, was £543,000. The existence of an independent Board of Directors demonstrates that the Company is free to pursue its own financial and operating policies and therefore, under the AIC SORP, the Manager is not considered to be a related party.
Directors' emoluments
At 30 September 2025, the Board consisted of four non-executive Directors. All Directors are considered to be independent of the Manager. None of the Directors has a service contract with the Company. The Chairman receives an annual fee of £43,000, the Chair of the Audit Committee receives an annual fee of £37,500 and non-executive Directors receive £31,000 per annum.
At 30 September 2025, the amount outstanding in respect of Directors' fees was £nil (31 March 2025: £nil).
At 30 September 2025, the interests of the Directors in the Ordinary shares of the Company were as follows:
| 30 September 2025 | 31 March 2025 | |
| No. of shares | No. of shares | |
| R M Curling | 150,000 | 150,000 |
| C A Roxburgh | 70,498 | 70,169 |
| G Neilly | 62,701 | 62,701 |
| H Williams | 6,255 | - |
No changes occurred in the Directors' interests between 30 September 2025 and the date of this report.
14. Statutory accounts
These are not statutory accounts in terms of Section 434 of the Companies Act 2006 and have not been audited or reviewed by the Company's Auditor. The information for the year ended 31 March 2025 has been extracted from the latest published financial statements and which have been filed with the Registrar of Companies. The Auditor's report on those accounts was not qualified, did not include a reference to any matters to which the auditor drew attention by way of emphasis without qualifying the report and did not contain statements under section 498 (2) or (3) of the Companies Act 2006. No statutory accounts in respect of any period after 31 March 2025 have been reported on by the Company's Auditor or delivered to the Registrar of Companies.
Alternative Performance Measures ("APMs")
The Company uses the following APMs:
Share Price and NAV Returns
Capital Return measures the effect of any rise or fall in the share price or NAV, excluding any dividends paid.
Total Return measures the effect of any rise or fall in the share price or NAV, plus dividends paid which are reinvested at the prevailing NAV or share price on the ex- dividend date.
| Share Price Return calculations as at 30 September 2025 | ||
| Share price as at 30 September 2025 | 168.5 | (a) |
| Share price as at 31 March 2025 | 148.5 | (b) |
| Share price Capital Return | 13.5% | ((a-b)/b) |
| Impact of dividends reinvested | 0.6% | (Note 1) |
| Share Price Total Return | 14.1% |
| Note 1 - Share Price impact of dividends reinvested | ||||
| Dividend | PPS | Dividend XD date | Share price at dividend XD date | Impact of dividend reinvested |
| (a) | (b) | (a)/(b) | ||
| Second interim dividend | 0.96 | 26 June 2025 | 171.5 | 0.6% |
| NAV Return calculations as at 30 September 2025 | ||
| NAV per share as at 30 September 2025 | 183.2 | (a) |
| NAV per share as at 31 March 2025 | 162.0 | (b) |
| NAV Capital Return | 13.1% | ((a-b)/b) |
| Impact of dividends reinvested | 0.6% | (Note 1) |
| NAV Total Return | 13.7% |
| Note 1 - NAV impact of dividends reinvested | ||||
| Dividend | PPS | Dividend XD date | NAV at dividend XD date | Impact of dividend reinvested |
| (a) | (b) | (a)/(b) | ||
| Second interim dividend | 0.96 | 26 June 2025 | 184.1 | 0.6% |
Discount or Premium to NAV
If the share is less than its NAV per share, the shares are trading at a discount. If the share price is greater than the NAV per share, the shares are trading at a premium.
As at 30 September 2025, the NAV per share was 183.2p and the share price was 168.5p. The discount is therefore calculated at 8.0%.
Net gearing employed
Unlike open-ended investment companies, investment trusts have the ability to borrow to invest. This term is used to describe the level of borrowings that an investment trust has undertaken and is stated as a percentage of shareholders' funds. The higher the level of borrowings, the higher the gearing ratio.
Net gearing is calculated as total debt, net of cash and cash equivalents, as a percentage of the total shareholders' funds.
As at 30 September 2025, interest bearing bank loans were £19,178,000, cash and cash equivalents were £2,380,000 and net assets were £273,166,000. As at 30 September 2025, net gearing employed was therefore equal to 6.1%.
Ongoing charges (expressed as a percentage)
Ongoing charges are the Company's revenue and capital expenses (excluding finance costs and certain non-recurring items) expressed as a percentage of the average daily net assets of the Company during the period.
Ongoing charges calculation
| Six months to 30 September 2025 £'000 |
Six months to 30 September 2024 £'000 |
Year to 31 March 2024 £'000 (audited) |
||
| Total expenditure | (a) | 1,531¹ | 1,601 | 3,234 |
| Average daily net assets | (b) | 292,144 | 307,401 | 308,082 |
| Ongoing charges (c = a/b)² | (c) | 1.0% | 1.0% | 1.0% |
¹ This figure has been adjusted to ensure that one-off expenses incurred in the six months to 30 September 2025 are not annualised.
² 30 September 2025 and 30 September 2024 figures annualised for comparison (c = (a/b) x 2).
| Glossary of terms | |
| AIFMD Alternative Investment Fund Managers Directive. Issued by the European Parliament in 2012 and 2013, the Directive requires that all investment vehicles in the European Union, including investment trusts, must, with effect from 22 July 2014, appoint a Depositary and an AIFM. The board of directors of an investment trust, nevertheless, remains fully responsible for all aspects of the Company's strategy, operations and compliance with regulations. |
|
| AIC The Association of Investment Companies is the trade body for Closed-end Investment Companies (www.theaic.co.uk). |
|
| Benchmark This is a measure against which an investment trust's performance is compared. The benchmark of the Company is the MSCI Europe SmallCap (ex-UK) Index (in sterling terms). The index averages the performance of a defined selection of companies listed in European smaller company stock markets and gives an indication of how those markets have performed in any period. |
|
| Closed-end Investment Company A company, including an investment trust, with a fixed issued ordinary share capital which is traded on an exchange at a price not necessarily related to the NAV of the company and where shares can only be issued or bought back by the company in certain circumstances. This contrasts with an open-ended investment company, which has units not traded on an exchange but issued or bought back from investors at a price directly related to the NAV. |
|
| Custodian A specialised financial institution responsible for safeguarding, worldwide, the listed securities and certain cash assets of the Company, as well as the income arising therefrom, through provision of custodial, settlement and associated services. The Company's Custodian is Bank of New York Mellon SA/NV (London branch). |
|
| Depositary Under the AIFMD, the Company must appoint a Depositary, whose duties in respect of investments, cash and similar assets include: safekeeping; verification of ownership and valuation; and cash monitoring. The Depositary has strict liability for loss of any investments or other assets where it has safekeeping duties. The Depositary's oversight duties include, but are not limited to, oversight of share buybacks, dividend payments and adherence to investment limits. The Company's Depositary is The Bank of New York Mellon (International) Limited. |
|
| Dividend The income from an investment. Some investment trusts pay dividends on a quarterly or monthly basis. The Company currently pays dividends twice a year. |
|
| Gearing Gearing is calculated as total liabilities less current assets divided by net assets. |
|
| International Accounting Standards UK-adopted International Accounting Standards in conformity with the requirements of the Companies Act 2006. |
|
| Investment Manager The Company's Investment Manager is Montanaro Asset Management Limited. |
|
| Investment Trust A closed-end investment company which satisfies the requirements of Section 1158 of the Corporation Tax Act 2010. Companies which meet these criteria are exempt from having to pay tax on the capital gains they realise from sales of the investments within their portfolios. |
|
| Leverage As defined under the AIFMD rules, Leverage is any method by which the exposure of an AIF is increased through borrowing of cash or securities or leverage embedded in derivative positions. Leverage is broadly equivalent to Gearing, but is expressed as a ratio between the assets (excluding borrowings) and the net assets (after taking account of borrowings). Under the gross method, exposure represents the sum of the Company's positions after deduction of cash and cash equivalents, without taking account of any hedging or netting arrangements. Under the commitment method, exposure is calculated without the deduction of cash and cash equivalents and after certain hedging and netting positions are offset against each other. |
|
| Marked to Market Accounting for the fair value of an asset or liability that can change over time and reflects its current market value rather than its book cost. |
|
| Market Capitalisation The stock market value of a company as determined by multiplying the number of shares in issue, excluding those shares held in treasury, by the market price of the shares. |
|
| Net Asset Value ("NAV") per Ordinary Share This is calculated as the net assets of an investment trust divided by the number of shares in issue, excluding those shares held in treasury. |
|
| Net Assets (or Shareholders' Funds) This is calculated as the value of the investments and other assets of an investment trust, plus cash and debtors, less borrowings and any other creditors. It represents the underlying value of an investment trust at a point in time. |
|
| Net Gearing Net Gearing is calculated as total debt, net of cash and cash equivalents, as a percentage of the total shareholders' funds. |
|
| Ordinary Shares The main type of equity capital issued by conventional investment trusts. Shareholders are entitled to their share of both income, in the form of dividends paid by the investment trust, and any capital growth. The Company has only Ordinary shares in issue. |
|
| Portfolio Turnover Calculated using total sales proceeds as a percentage of the average monthly net assets during the period, annualised. |
|
| Related Party Transactions Under the UK Listing Rules, the Manager is regarded as a related party of the Company. |
|
| Share Price The value of a share at a point in time as quoted on a stock exchange. The shares of the Company are quoted on the Main Market of the London Stock Exchange. |
|
| SORP Statement of Recommended Practice "Financial Statements of Investment Trust Companies and Venture Capital Trusts" issued by the AIC. |
|
| Total Assets This is calculated as the value of the investment and other assets of an investment trust, plus cash and debtors. |
|
| Montanaro European Smaller Companies Trust plc Registered in Scotland No. SC074677 An investment company as defined under section 833 of the Companies Act 2006 |
|
| Directors R M Curling (Chairman) G Neilly C A Roxburgh H Williams |
Registered Office 28 Walker Street Edinburgh EH3 7HR |
| Principal Advisers | |
| AIFM and Investment Manager Montanaro Asset Management Limited 53 Threadneedle Street London EC2R 8AR Tel: 020 7448 8600 [email protected] www.montanaro.co.uk |
Depositary The Bank of New York Mellon (International) Limited One Canada Square London E14 5AL |
| Company Secretary and Administrator Juniper Partners Limited 28 Walker Street, Edinburgh EH3 7HR Tel: 0131 378 0500 Contact: [email protected] |
Custodian Bank of New York Mellon SA/NV One Canada Square London E14 5AL |
| Auditor PricewaterhouseCoopers LLP Atria One 144 Morrison Street Edinburgh EH3 8EX Stockbroker Cavendish One Bartholomew Close London EC1A 7BL |
Registrar Equiniti Limited Aspect House, Spencer Road, Lancing West Sussex BN99 6DA Registrar's Shareholder Helpline Tel: 0371 384 2030* *Lines are open 8.30am to 5.30pm, Monday to Friday, excluding UK public holidays |
| Sources of Further Information Information on the Company, including this Half-Yearly Report is available on the Company's website: https://montanaro.co.uk/trust/montanaro- european-smaller-companies-trust/ |
|
| Neither the contents of the Company's website nor the contents of any website accessible from hyperlinks on this announcement (or any other website) is incorporated into, or forms part of, this announcement. |
This information is provided by RNS, the news service of the London Stock Exchange. RNS is approved by the Financial Conduct Authority to act as a Primary Information Provider in the United Kingdom. Terms and conditions relating to the use and distribution of this information may apply. For further information, please contact [email protected] or visit www.rns.com.
RNS may use your IP address to confirm compliance with the terms and conditions, to analyse how you engage with the information contained in this communication, and to share such analysis on an anonymised basis with others as part of our commercial services. For further information about how RNS and the London Stock Exchange use the personal data you provide us, please see our Privacy Policy.
END
IR FDAFMSEISELS