Unlock the Power of Price-to-Sales Ratio Analysis
The Price-to-Sales ratio, or P/S ratio, shows how much investors value a company compared to its revenue. It's found by dividing the share price by the sales per share. This ratio helps investors see if a company is worth its price.
Kenneth L. Fisher created the P/S ratio. It helps investors understand the cost of a company based on its revenue. This is very useful for companies that haven't made a profit yet.
The price to sales ratio is key in financial analysis. It lets investors see if a company's market value matches its revenue. A low P/S ratio might mean a company is cheap, while a high ratio could mean it's overpriced.
Each industry has its own P/S ratio range. So, comparing companies within the same sector is more accurate. Knowing the price to sales ratio is vital for smart investment choices.
Key Takeaways
- The Price-to-Sales ratio is a valuation metric used to compare a company's market value to its total revenue generated.
- The P/S ratio is calculated by dividing the share price by the sales per share.
- A low P/S ratio may indicate undervaluation, while a high ratio could suggest overvaluation.
- The P/S ratio is useful for comparing companies within the same industry sector.
- The price to sales ratio can vary daily and is not the actual valuation of the company but a metric for comparison within the industry.
- Understanding the P/S ratio is critical for making informed investment decisions, mainly for companies that may not yet be profitable.
- The P/S ratio serves as a valuable tool for evaluating company valuations and comparing them to industry peers.
Introduction to Price-to-Sales Ratio
The price-to-sales ratio shows how much investors pay for each dollar of a company's sales. It's found by dividing the company's market value by its sales over a certain time. A lower best ps ratio means investors pay less for each dollar of sales.
To find a good price to sales ratio, look at the company's industry. For example, Amazon's p sales ratio has been between 2 and 6 in the last five years. On the other hand, grocery stores might have a psr ratio as low as 0.1 or 0.2.
Here are some important things to think about when looking at a company's best ps ratio:
- The p sales ratio shows what investors expect for future sales growth.
- A lower psr ratio is usually seen as a better investment, as it means paying less for sales.
- Psr ratio changes a lot between different sectors. They're best for comparing similar stocks in the same sector.
| Company | Price-to-Sales Ratio |
|---|---|
| Amazon | 2-6 |
| Grocery Store Stocks | 0.1-0.2 |
Calculating the Price-to-Sales Ratio
The price to sales ratio formula is key for checking a company's market value against its sales. To find this ratio, you divide the company's market capitalization by its sales over 12 months. Market capitalization is found by multiplying the company's shares by its current price.
The formula for the price to sales ratio is: P/S Ratio = Market Capitalization / Total Sales. This shows a company's value clearly. It helps investors see if a company is over or undervalued. This makes it a great tool for making investment choices.
For instance, if a company's market capitalization is $100 million and sales are $50 million, its ratio is 2. This shows investors are ready to pay $2 for each dollar of sales. Comparing this ratio with others in the industry helps investors understand the company's value better.
Understanding the Significance of P/S Ratio
The price to sales ratio is a key financial metric. It compares a company's stock price to its total revenue. This ratio shows what investors think about a company's ability to make money.
Investors often wonder what makes a good P/S ratio. It helps figure out if a stock is cheap or too expensive.
A low P/S ratio might mean the stock is a good deal. But a high ratio could mean it's overpriced. This ratio is very useful for companies that don't make money yet or have changing profits.
For example, tech companies usually have high P/S ratios, around 10. Retail businesses have lower ratios, between 1 and 2.
Interpreting High and Low P/S Values
When looking at P/S values, think about the industry and market. A high P/S ratio might mean the stock is too expensive. A lower ratio could mean it's a good value.
Here's a simple guide to P/S ratios:
| Industry | P/S Ratio Range |
|---|---|
| Tech | 5-15 |
| Retail | 1-2 |
| Healthcare | 4-6 |
Understanding the P/S ratio helps investors make better choices. It's great for checking growth, comparing similar businesses, and looking at new tech companies.
Comparing Price-to-Sales Across Industries
The price to sales ratio varies widely across different industries. This is due to several factors like growth prospects, risk levels, profit margins, and competition. To find a good price to sales ratio, comparing companies in the same industry is key. For example, tech and biotech firms often have higher ratios because of their growth and profit margins.
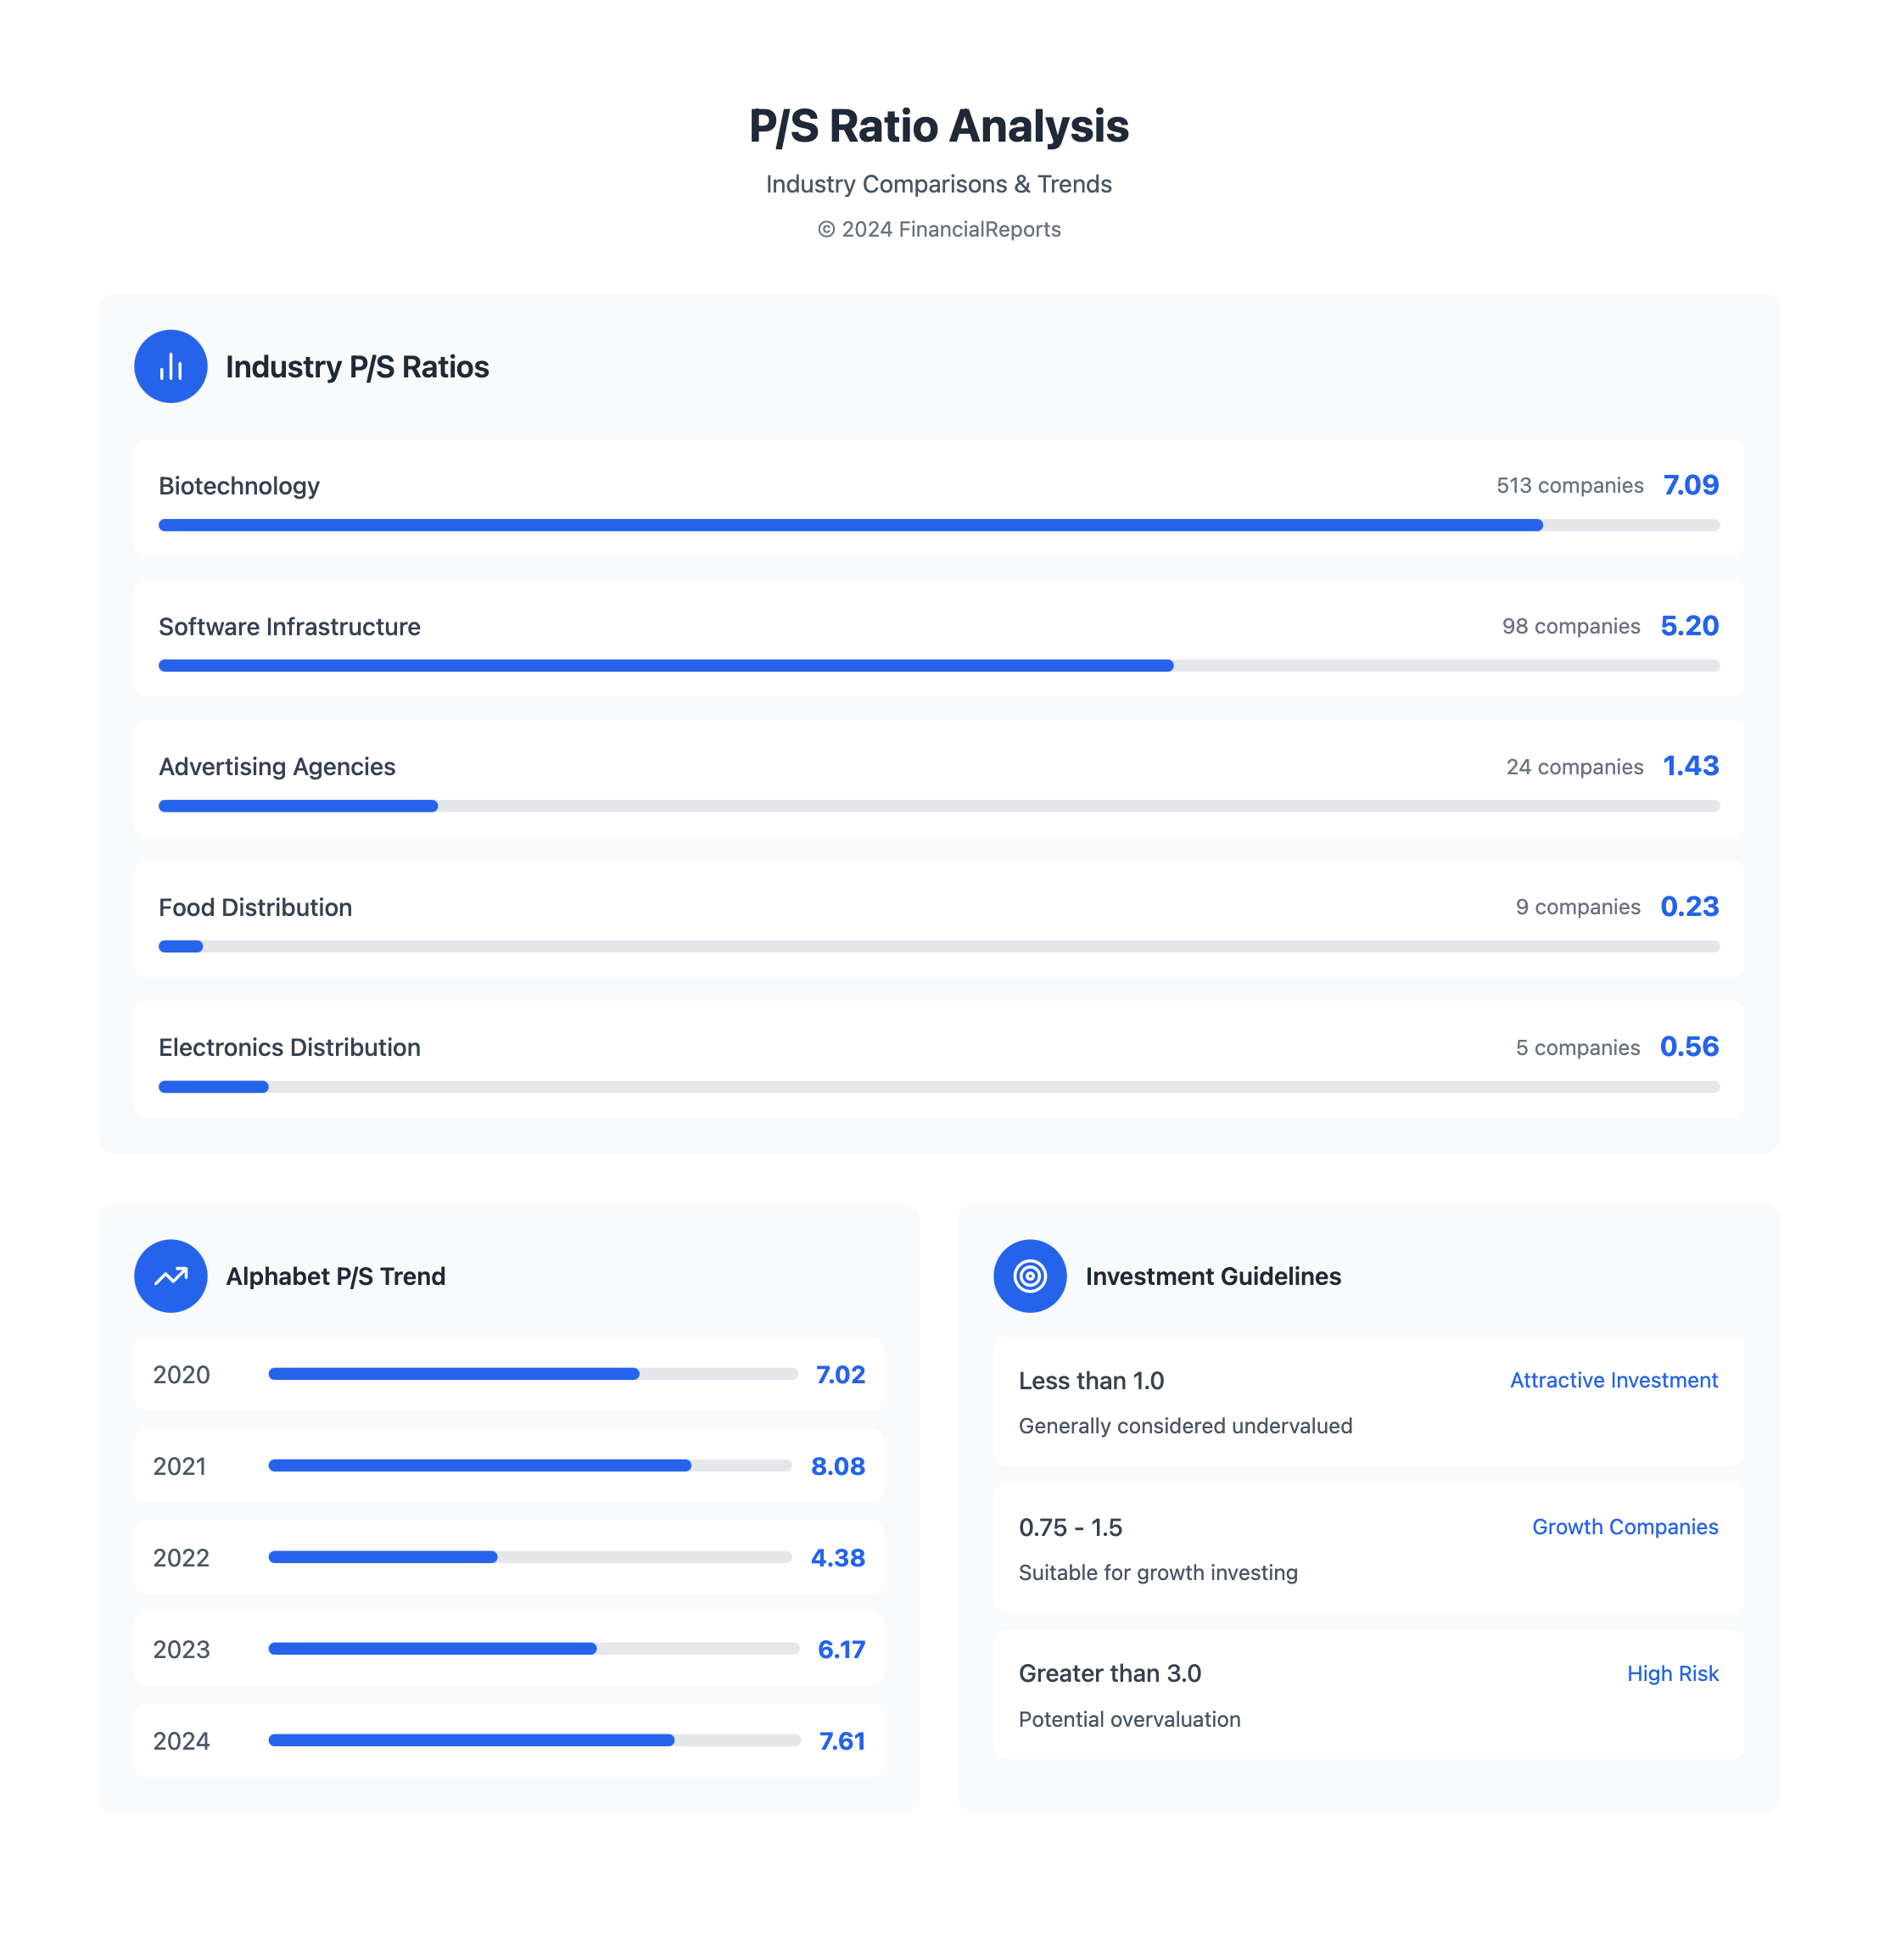
Using industry benchmarks for P/S ratios helps assess a company's performance. Here's a table showing average P/S ratios for various industries:
| Industry | Average P/S Ratio | Number of Companies |
|---|---|---|
| Biotechnology | 7.09 | 513 |
| Software - Infrastructure | 5.2 | 98 |
| Advertising Agencies | 1.43 | 24 |
| Food Distribution | 0.23 | 9 |
| Electronics & Computer Distribution | 0.56 | 5 |
By comparing a company's P/S ratio to the industry average, investors can understand its valuation and growth prospects. It's important to consider profitability, debt, and future growth when making investment choices.
Limitations of Price-to-Sales Ratio
The price to sales ratio is a useful tool for investors. Yet, it has its downsides. It doesn't show if a company makes profits or if it will in the future. So, a low ratio doesn't always mean a company is a good investment.
Another issue is that it ignores a company's debt and balance sheet health. Companies with lots of debt might have a low ratio but could face financial trouble. To truly understand a company, investors need to look at other financial metrics too.
Some industries don't fit well with the price to sales ratio. For example, tech companies might have high ratios because of their growth. But this doesn't mean they're overvalued. In such cases, other metrics like the price to earnings ratio are more helpful.
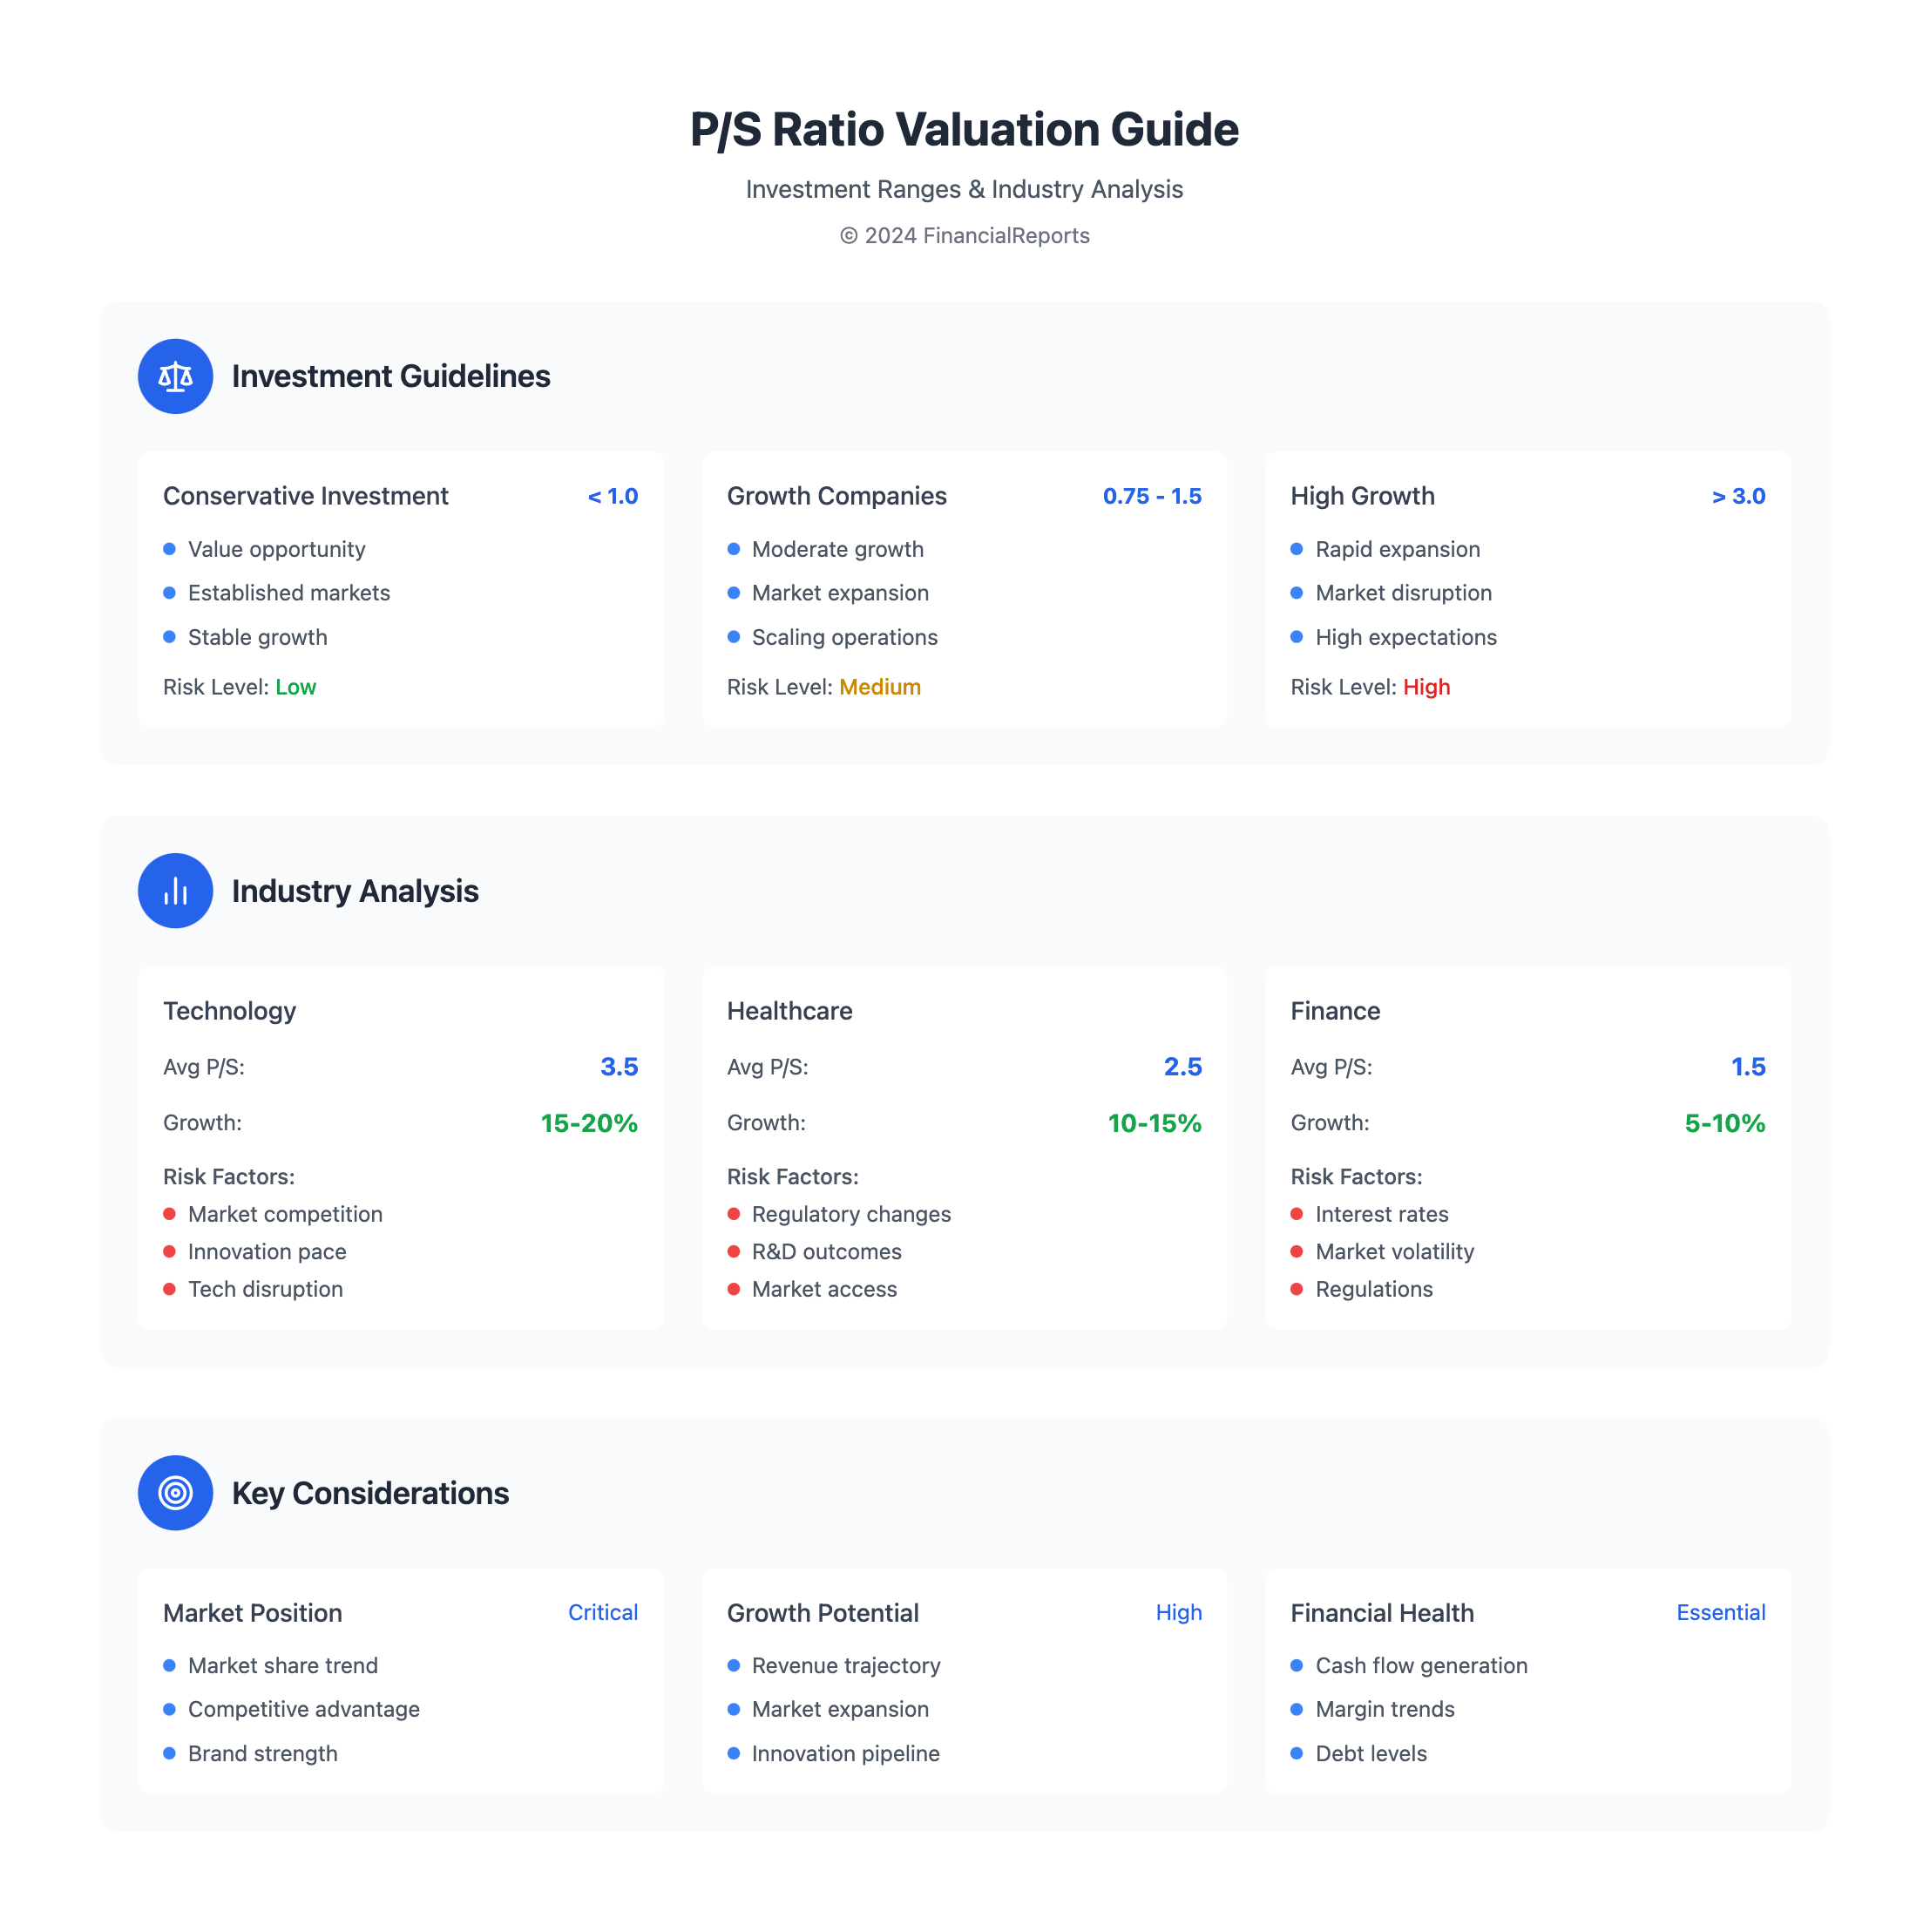
| Industry | Average Price to Sales Ratio |
|---|---|
| Technology | 3.5 |
| Healthcare | 2.5 |
| Finance | 1.5 |
In summary, the price to sales ratio is useful but not perfect. It should be used with other metrics to fully understand a company's health. By knowing its limitations, investors can make better choices and avoid risks.
Enhancing Investment Decisions with P/S Ratio
The price to sales ratio is a key tool for investors. It shows how a company's value compares to its sales. To find out what is a good ps ratio, look at the industry average and the company's growth. A lower ratio means a company might be a better investment.
When screening stocks, use the P/S ratio with other metrics like P/E and enterprise value/sales ratio. This method helps spot undervalued companies and avoid risks. For instance, Kenneth Fisher's strategy uses the P/S ratio to find companies with strong sales growth.
Here are some key points about the P/S ratio:
- A P/S ratio less than 1.0 is generally considered a better investment
- A P/S ratio between 0.75 and 1.5 is suitable for growth companies
- A P/S ratio greater than 3 is considered high-risk
Using the price to sales ratio in investment decisions offers a deeper look at a company's value and growth. This leads to more informed choices.
| P/S Ratio Range | Investment Implication |
|---|---|
| Less than 1.0 | Attractive investment opportunity |
| 0.75-1.5 | Suitable for growth companies |
| Greater than 3 | High-risk investment |
Price-to-Sales Ratio vs. Other Valuation Metrics
The price to sales ratio is a key tool for checking a company's value. But, it's not the only thing to look at. To really understand a company's worth, it's smart to compare it with other metrics like the price-to-earnings (P/E) ratio and the price-to-book (P/B) ratio.
The price to sales ratio doesn't look at a company's debt. The enterprise value-to-sales ratio (EV/Sales) is similar but uses enterprise value. This gives a clearer view of a company's value. Knowing how the price to sales ratio stacks up against others is vital for smart investing.
Here are some main differences between the price to sales ratio and other metrics:
- Price-to-Earnings (P/E) ratio: This metric is based on a company's earnings and can be affected by accounting choices.
- Price-to-Book (P/B) ratio: This metric looks at a company's book value and can be influenced by asset values.
- Enterprise Value-to-Sales (EV/Sales) ratio: This metric includes a company's debt, giving a fuller view of its valuation.
Looking at several valuation metrics, including the price to sales ratio, helps investors understand a company's value better. This leads to more informed investment choices.
Historical Trends in Price-to-Sales Ratio
The price to sales ratio is key for investors, helping them see the value of growth stocks. It's important to look at past trends to know what's good. The S&P 500's current ratio is 3.038, up 31.52% from last year's 2.31.
Different industries have different ratios. For example, Electronics & Computer Distribution has a ratio of 0.2867, while Biotechnology has a ratio of 10.3003. Ratios under 0.75 are good for non-cyclical and tech firms. Ratios between 0.75-1.5 are strong buys. But, ratios over three are risky.
Over the last five years, Price-to-Sales ratios have gone up a lot. Here's a table showing Alphabet's P/S ratio over the last 10 years:
| Year | P/S Ratio |
|---|---|
| 2024 | 7.61 |
| 2023 | 6.17 |
| 2022 | 4.38 |
| 2021 | 8.08 |
| 2020 | 7.02 |
By studying these trends, investors can better understand the price to sales ratio. This helps them make smarter choices when looking at stocks.
Case Studies of P/S Ratio Applications
The price to sales ratio is key in checking a company's value. It shows how much investors pay for each dollar of sales. To see how the price to sales ratio works, let's look at real examples.
Successful Investors Using P/S Ratio
Investors look at the P/S ratio to find good deals. If a company's P/S ratio is lower than its peers, it might be a bargain. What is ps ratio is a big question for investors. Knowing its value helps make smart choices.
Real-World Examples of P/S in Action
Here's a table showing the P/S ratio of different companies:
| Company | Industry | P/S Ratio |
|---|---|---|
| Company A | Technology | 5.2 |
| Company B | Healthcare | 3.1 |
| Company C | Finance | 2.5 |
By looking at the P/S ratio, investors can understand a company's worth. This ratio is a powerful tool in making investment choices. Knowing how to use it can improve your investment results.
Tools and Resources for P/S Ratio Analysis
Calculating the price to sales ratio formula needs the right tools and resources. The formula divides a company's market capitalization by its total sales over a set period. Financial professionals can use various platforms for this, as they offer P/S ratio data and more.
Top financial data platforms give real-time data, customizable dashboards, and advanced analytics. They help investors and analysts make better choices with accurate, up-to-date data. Online calculators and spreadsheet templates also make it easier to work with the P/S ratio.
Choosing the right tools for P/S ratio analysis is key. Look for data accuracy, user-friendly interface, and functionality. These tools help financial pros make smart investment choices and stay on top of financial changes.
Some important features in financial data platforms include:
- Real-time data updates
- Customizable dashboards and reports
- Advanced analytics and modeling capabilities
- Integration with other financial metrics and tools
Using these tools, investors and analysts can better understand the price to sales ratio formula. This helps them make more informed investment decisions.
Future Predictions for Price-to-Sales Ratio
The financial world is changing fast, and so is how we look at the price-to-sales (P/S) ratio. With more tech and service companies around, and a focus on revenue, the P/S ratio's role is set to change. This shift is expected to guide the P/S ratio's future.
Market Trends Influencing P/S Ratio
The financial sector's profit margins have been rising, affecting the S&P 500's overall earnings. This trend, along with the growth of tech and materials sectors, will shape the P/S ratio's future. Analysts believe these sectors will see higher earnings growth, making revenue-based valuations more important.
Expert Opinions on P/S Ratio Outlook
Financial experts say the P/S ratio will keep being key for valuing companies, mainly in growth-driven industries. But, its importance might change. Investors might value forward-looking P/S ratios more, using projected sales. Accurate forecasting will help investors make better choices about stocks.
FAQ
What is the Price-to-Sales Ratio?
The Price-to-Sales (P/S) Ratio compares a company's stock price to its sales. It's found by dividing the company's market value by its sales over a set time.
Why is the P/S Ratio important for valuation?
The P/S Ratio is great for companies that aren't making money yet. It looks at how much money a company makes, not just its profits. It shows what investors think about the company's future.
How does the P/S Ratio differ from other valuation metrics?
Unlike the Price-to-Earnings (P/E) Ratio, the P/S Ratio focuses on sales, not profits. This makes it better for companies that are not yet profitable or have changing earnings.
How is the P/S Ratio calculated?
To find the P/S Ratio, you divide the company's market value by its sales over a year. The market value is the stock price times the number of shares.
What do high and low P/S Ratio values signify?
A high P/S Ratio means the stock might be too expensive compared to sales. A low P/S Ratio could mean the stock is a good deal. But, these values mean different things in different markets.
Why do P/S Ratios differ across industries?
P/S Ratios change a lot between industries. This is because of things like growth rates, profit margins, and how competitive the market is. For example, tech companies often have higher ratios than retail or utilities.
What are the limitations of the P/S Ratio?
The P/S Ratio isn't perfect for every company. It works best for companies with normal business models and profit margins. It's best used with other metrics for a full picture.
How can the P/S Ratio be used in investment decision-making?
The P/S Ratio can help find good investments, like in growing sectors. It's also good when used with other metrics to make a stronger investment plan.
How does the P/S Ratio compare to other valuation metrics?
The P/S Ratio can be compared to other metrics like P/E and P/B Ratios. The Enterprise Value-to-Sales (EV/Sales) Ratio also shows a company's debt. This gives a fuller view of a company's value.
What are the historical trends and evolution of the P/S Ratio?
The P/S Ratio has changed over time. It reflects changes in markets, investors, and the economy. Looking at its history helps understand today's valuations and investment strategies.