Understanding the Lowest P/E Ratio: A Guide for Savvy Investors
The Price-to-Earnings (PE) ratio is a key tool for investors. It helps figure out if a stock is overvalued, undervalued, or priced right. To find the PE ratio, you divide the stock's current price by its earnings per share. This can help spot undervalued stocks and guide investment choices.
To grasp the PE ratio, start with the trailing PE. It's based on the last 12 months' earnings per share. Then, compare it to the forward PE, which looks at the next 12 months' earnings. This comparison sheds light on a company's growth and future earnings. The formula is vital for this analysis, helping investors spot the best deals.
Key Takeaways
- The Price-to-Earnings (PE) ratio is a key metric for stock valuation.
- Knowing how to calculate the PE ratio is key for smart investing.
- The lowest PE ratio might show a stock is undervalued or has slow growth.
- The formula for the PE ratio is simple: current price divided by earnings per share.
- Comparing the trailing and forward PE ratios can reveal a company's growth chances.
- Keep in mind the PE ratio's limits, like earnings manipulation and industry differences.
- Forward PE analysis can predict future performance and guide investments.
What is the Price to Earnings Ratio?
The Price to Earnings (P/E) ratio is a way to value a company. It compares the current share price to earnings per share. To find the P/E ratio, you need the market price and earnings per share (EPS). The formula is P/E = Market Price per Share / Earnings Per Share (EPS).
Knowing how to find PE and understanding eps vs pe ratio is key. It helps investors make smart choices.
Looking at the P/E ratio gives insight into a company's value. A high P/E ratio might mean a growth stock. A low P/E ratio could mean a value stock.
For example, on Feb. 9, 2024, FedEx Corporation (FDX) had a P/E ratio of 14.40. Hess Corporation (HES) had a P/E ratio of 31.64. To see if a stock is undervalued or overvalued, compare its P/E ratio to the industry average and its past P/E ratios.
Here are some key points to consider when analyzing P/E ratios:
- The P/E ratio can be categorized into two types: trailing P/E and forward P/E.
- The trailing P/E is based on past earnings per share, while the forward P/E is calculated using future estimated EPS.
- Investors should compare a company's P/E ratio with its historical P/E values or with competitors' P/E ratios within the same industry.
| Company | P/E Ratio |
|---|---|
| FedEx Corporation (FDX) | 14.40 |
| Hess Corporation (HES) | 31.64 |
| Marathon Petroleum Corporation (MPC) | 7.19 |
Understanding the P/E ratio helps investors make better choices. It's a useful tool, but use it with other financial analysis tools to value stocks and make investment decisions.
Types of P/E Ratios
There are different ways to calculate the price earnings ratio. You can use the trailing or forward P/E ratio. The trailing P/E ratio is found by dividing the current share price by the last 4 quarterly EPS. This method uses the balance sheet.
The forward P/E ratio is calculated differently. It divides the current share price by the projected EPS for the next 4 quarters. Knowing how to calculate these ratios helps investors make better choices.
When looking at P/E ratios, keep these points in mind:
- Average P/E ratios vary by industry, like the Health Information Services industry with an average of 49.85
- Relative P/E ratios help compare a company's performance to its past or a benchmark
- It's important to look at other metrics, like financial health and management team, along with the P/E ratio
| Industry | Average P/E Ratio |
|---|---|
| Health Information Services | 49.85 |
| Software - Application | 44.4 |
| Marine Shipping | 7 |
Significance of the Lowest P/E Ratio
A low P/E ratio can signal undervalued stocks, which is key for investors looking for good deals. The lowest pe ratio stocks often come from mature industries like utilities. These industries usually have slower growth. Yet, a low P/E ratio might also mean the company is facing challenges or is in a slow-growth field.
Looking at the lowest pe stocks can tell us about market sentiment. It gives us clues about what investors think and the state of the market. By studying the best pe stocks and low p e stocks, investors can spot chances to invest wisely. Here are some important things to think about when looking at lowest pe ratio stocks:
- Trailing Twelve Months (TTM) PE is found by dividing the current share price by the last 4 quarterly EPS.
- Forward PE is calculated by dividing the current share price by the projected EPS for the next 4 quarters.
- Relative PE compares the current absolute PE to past PEs over a certain time period.
By looking at these points and examining the lowest pe stocks, investors can make smart choices. They might find undervalued stocks to invest in.
Analyzing Companies with Low P/E Ratios
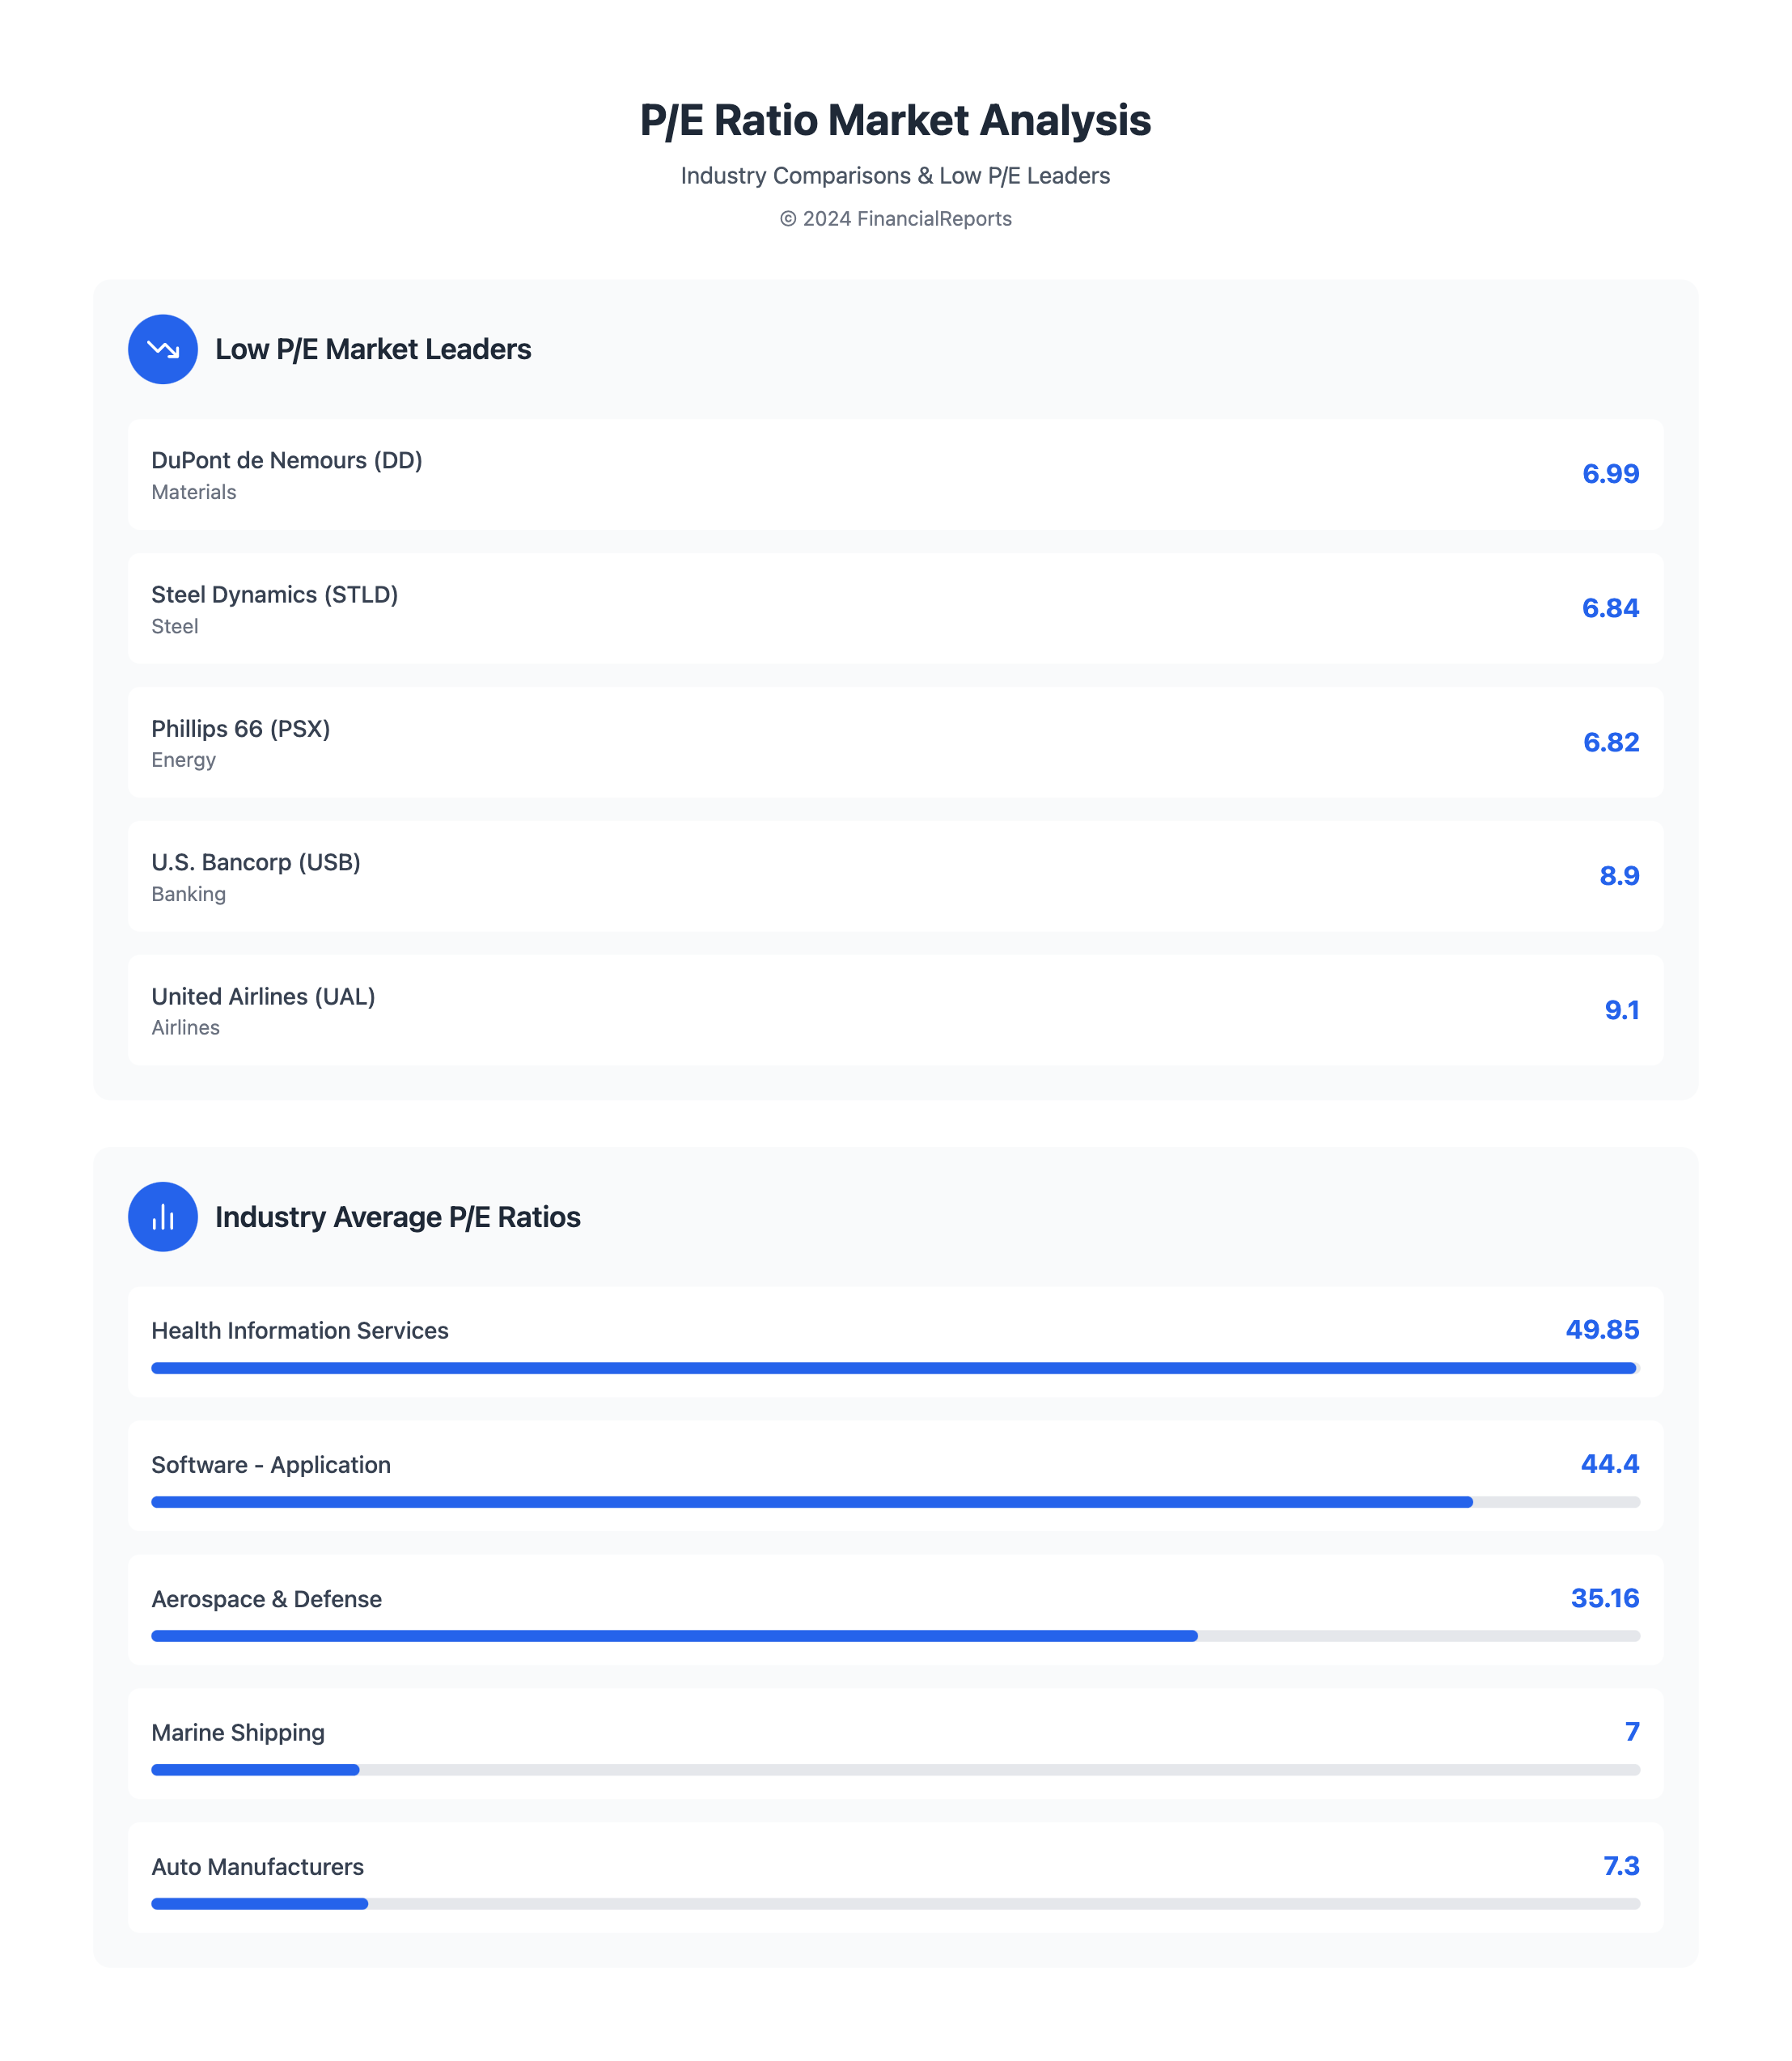
When looking at companies with low P/E ratios, it's key to compare sectors. For example, Health Information Services has the highest average P/E ratio at 49.85. Software - Application is second at 44.4. On the other hand, Marine Shipping has the lowest at 7, with Auto Manufacturers at 7.3.
Companies like United Airlines (UAL) with a P/E of 9.1 and 5.0 forward P/E might be undervalued. General Motors (GM) with a P/E of 5.7 and 5.9 forward P/E could also be a good investment. But, it's important to look at risk and past performance to make smart choices.
Some companies with low P/E ratios include:
- U.S. Bancorp (USB) with a trailing P/E of 8.9 and a forward P/E of 7.3
- CVS Health (CVS) with a trailing P/E of 23.0 and a forward P/E of 8.0
- Verizon Communications (VZ) with a trailing P/E of 7.0 and a forward P/E of 7.7
By studying these companies and their sectors, investors can spot chances and make informed choices.
| Company | Trailing P/E | Forward P/E |
|---|---|---|
| United Airlines (UAL) | 9.1 | 5.0 |
| General Motors (GM) | 5.7 | 5.9 |
| U.S. Bancorp (USB) | 8.9 | 7.3 |
How to Find the Lowest P/E Ratios
To find stocks with the lowest P/E ratios, investors can use financial news and analysis tools. These tools give updates on P/E ratios, helping investors make smart choices. For example, to find low pe stocks, look for companies with a P/E ratio below the industry average.
Stock screeners and research platforms are key for finding low pe shares. They let investors filter stocks by criteria like P/E ratio, market size, and sector. This way, investors can make a list of low pe stocks to study further.
Key Financial Statements to Review
When looking at low pe stocks, it's important to check key financial statements. The income statement shows a company's revenue, net income, and EPS, which are needed for the P/E ratio. The balance sheet gives insights into debt, cash, and other financials that affect the P/E ratio.
Some important metrics to watch include:
- Trailing P/E ratio: Good for those who like historical data.
- Forward P/E ratio: Useful for predicting future P/E ratios.
- Debt levels: Lower debt can help a company's P/E ratio.
By using these tools and metrics, investors can find the lowest P/E ratio stocks. This helps them make better investment choices.
Potential Pitfalls of Low P/E Investing
Investing in low pe ratio stocks comes with risks. Low P/E ratios might not always show a company's true worth. For example, companies with low P/E ratios could have a lot of debt or be in declining industries. This makes them less appealing than they seem at first.
Market volatility is another big concern. During economic uncertainty, investors might get scared and sell stocks quickly. This can cause prices of low P/E stocks to swing wildly. Investors who aren't ready for these changes could lose money unexpectedly.
When looking at low P/E stocks, keep these points in mind:
- Earnings manipulation: Companies can change their earnings through accounting tricks, making the P/E ratio unreliable.
- Industry differences: The P/E ratio changes between industries, making it hard to compare companies in different sectors.
- Growth rates: The P/E ratio doesn't consider how fast companies are growing.
- Debt levels: Companies with a lot of debt might have P/E ratios that are not accurate.
Investors should be careful with stocks that have a good P/E ratio. They might not always be the best deal. By looking at these factors and other metrics, investors can make smarter choices and avoid common mistakes.
| Company | P/E Ratio | Industry |
|---|---|---|
| Company A | 15 | Technology |
| Company B | 20 | Finance |
| Company C | 10 | Healthcare |
Best Practices for Utilizing P/E Ratios
When looking at low p e ratio stocks, it's key to think about many factors. A good practice is to spread out your investments. This helps balance the risk by mixing low P/E stocks with other options.
Using P/E ratios with other numbers like earnings per share and dividend yield is smart. This way, you get a full picture of a stock. It helps spot undervalued stocks and guides better choices.
Keeping an eye on market trends is also vital. P/E ratios change with the economy and sector performance. By watching the market and adjusting plans, you can boost your earnings and cut losses.
Some important tips for using P/E ratios well include:
- Looking at P/E ratios against industry norms and similar companies
- Checking if earnings are strong and growing
- Thinking about the market and the economy's state
By following these tips and keeping up with market news, investors can use P/E ratios wisely. This helps reach their investment goals.
Case Studies of Low P/E Stocks
Investors looking for the lowest price to earnings ratio often focus on companies with growth chances. Recent data shows companies like DuPont de Nemours, Inc. (NYSE:DD) with a P/E ratio of 6.99. Steel Dynamics, Inc. (NASDAQ:STLD) has a P/E ratio of 6.84, and Phillips 66 (NYSE:PSX) is at 6.82.
These companies show the promise of investing in low P/E stocks. For example, Delta Air Lines, Inc. (NYSE:DAL) had EPS of $2.03 in Q3, showing solid financial health. Citigroup Inc. (NYSE:C) also did well, with a 8.8% year-over-year revenue increase to $20.1 billion.
| Company | P/E Ratio |
|---|---|
| DuPont de Nemours, Inc. (NYSE:DD) | 6.99 |
| Steel Dynamics, Inc. (NASDAQ:STLD) | 6.84 |
| Phillips 66 (NYSE:PSX) | 6.82 |
By studying these examples, investors can better understand the lowest price to earnings ratio. This knowledge helps in making smarter investment choices.
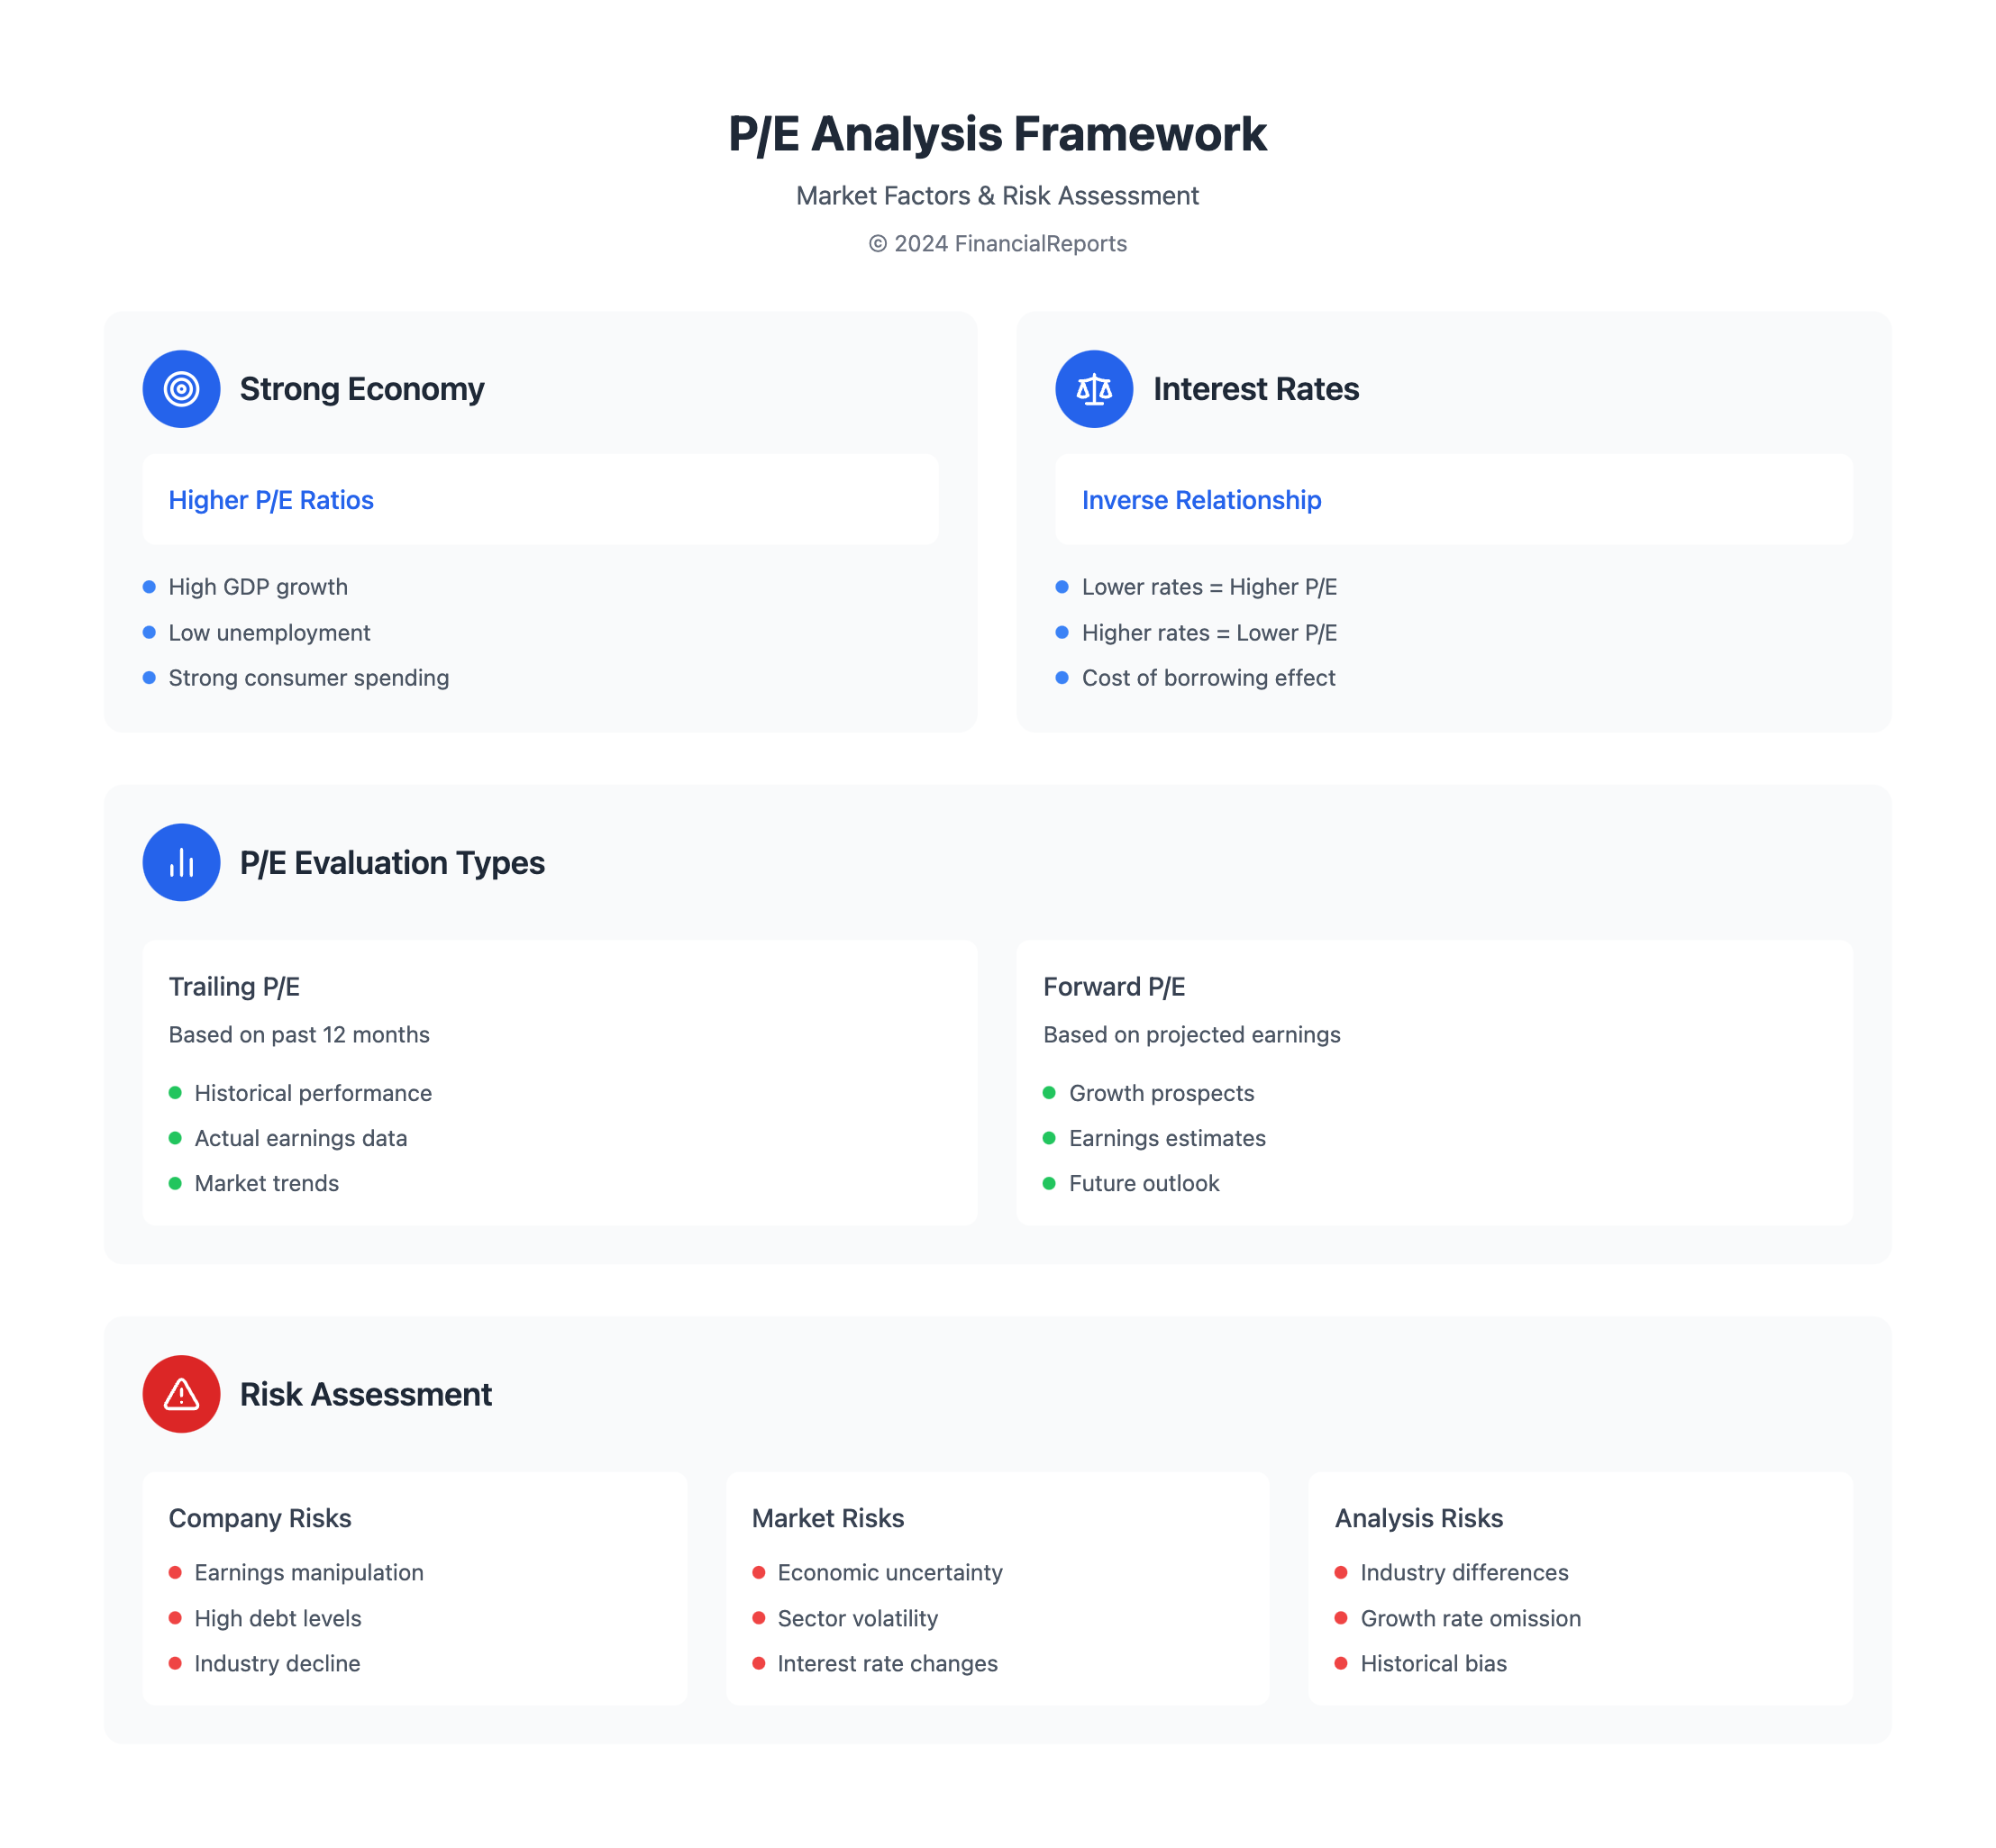
The Role of Market Conditions
Market conditions are key to understanding P/E ratios. Economic indicators like GDP growth, inflation, and employment rates matter. For example, a booming economy with high GDP and low unemployment can boost P/E ratios. This is because investors get more optimistic about future earnings.
Interest rates also play a part. Lower rates mean higher P/E ratios, while higher rates lower them. This is because lower rates make borrowing cheaper, increasing stock demand and prices. Global events and politics can also sway market reactions and P/E ratios. Knowing these factors helps investors pick the best stocks.
Some important things to think about when looking at market conditions and P/E ratios include:
- GDP growth and its impact on earnings expectations
- Inflation rates and their effect on interest rates and valuations
- Employment figures and their influence on consumer spending and economic growth
- Interest rates and their role in shaping P/E ratios
- Global events and geopolitical factors that can impact market sentiment and P/E ratios
By considering these factors and understanding how market conditions affect P/E ratios, investors can make better choices. They can find opportunities for growth in stocks with the lowest P/E ratios.
| Market Condition | Impact on P/E Ratio |
|---|---|
| Strong economy with high GDP growth | Higher P/E ratio |
| Low interest rates | Higher P/E ratio |
| Global events and geopolitical factors | Variable impact on P/E ratio |
Future Trends in P/E Ratio Analysis
Looking ahead, technology will change how we analyze the lowest price to earnings ratio. Big data and artificial intelligence will give us better tools for this. Investors will make smarter choices with these new tools.
More companies are now considering Environmental, Social, and Governance (ESG) factors. This means investors look at more than just numbers. The focus on the lowest price to earnings ratio will grow as a result.
Technology Impact on Valuation Metrics
Technology is making P/E ratio analysis more precise. For instance, the S&P 500's average P/E ratio is 36.5, up 79.2% from the average. This data helps spot trends, guiding investors to better choices.
Evolving Market Strategies
Investors must keep up with market changes. By using the lowest price to earnings ratio with ESG and industry trends, they gain a deeper understanding. Key trends include:
- Average P/E ratios for various industries, such as 10.11 for Advertising/Marketing services and 35.16 for Aerospace & defense companies
- The growing importance of ESG factors in company valuations
- The increasing use of big data and artificial intelligence in investment analysis
By keeping up with these trends, investors can thrive in a changing market.
Conclusion: Making Informed Investment Decisions
The lowest price to earnings ratio is key for smart investors looking for undervalued stocks. It helps them understand the P/E ratio's details and how to use it. But, remember, the P/E ratio is just one part of evaluating a company's future.
Summary of Key Takeaways
This article showed how the P/E ratio helps check a company's value. It's also important to compare ratios within the same industry. But, be careful not to rely only on this metric. The lowest P/E ratios might mean a stock is undervalued, but look at other financial signs too.
Final Thoughts on P/E Ratios
The P/E ratio is a useful tool for investors, but it needs careful thought. Mix P/E insights with a deep understanding of the market, industry, and company growth. This way, investors can make better, more informed choices. Always stay open to learning and adapting in the changing financial world.
FAQ
What is the Price to Earnings Ratio?
The Price to Earnings (P/E) Ratio is a key financial tool. It shows how much investors pay for a company's earnings. It's found by dividing the stock price by earnings per share (EPS).
How is the P/E Ratio calculated?
To find the P/E Ratio, divide the stock price by earnings per share (EPS). The formula is: P/E Ratio = Stock Price / Earnings per Share.
How can I interpret P/E Ratios?
A lower P/E ratio is good, meaning the stock might be cheap. A higher ratio could mean it's overpriced. Investors use P/E ratios to compare stocks and see if they're fairly priced.
What are the different types of P/E Ratios?
There are several P/E Ratios. The Trailing P/E uses past earnings, while the Forward P/E looks at future earnings. The Shiller P/E, or CAPE ratio, averages earnings over 10 years for a broader view.
Why is the lowest P/E Ratio important for investors?
Finding stocks with low P/E ratios can lead to good investments. These stocks might be undervalued, giving investors a chance to buy at a low price.
How can I analyze companies with low P/E Ratios?
When looking at low P/E stocks, compare them to peers and historical averages. Check the company's financial health and growth prospects. Looking at financial statements can also help understand the company's value.
What are the potentially risks of investing solely based on low P/E Ratios?
Low P/E ratios can be a good starting point but are not enough. They might hide problems or financial issues. Market changes and economic conditions can also affect P/E ratios, leading to risks.
How can I effectively utilize P/E Ratios in my investment strategies?
To use P/E ratios well, diversify your investments. Combine P/E analysis with other metrics. Always watch market trends and conditions. This approach helps find real undervalued stocks and avoid risks.