Understanding the Average PE Ratio for ETFs
The Price-to-Earnings (P/E) ratio is a key financial tool. It helps investors compare company values, including ETFs. The average PE ratio for ETFs is a mix of the values of the companies in the fund. It's vital for investors to grasp ETF values and make smart choices.
The PE ratio is found by dividing the current share price by the past year's earnings per share (EPS). Investors use it to judge if ETFs and stocks are fairly valued. A high PE ratio might mean higher risks, leading to quick market drops.
The PE ratio shows if an investment is under or overvalued. This helps investors make better choices. Knowing the average PE ratio for ETFs is key to navigating financial markets wisely.
Key Takeaways
- The PE ratio is a widely used financial metric that helps investors understand and compare company valuations when applied to ETFs.
- The average PE ratio for ETFs is a composite figure derived from the valuations of the underlying companies held by the fund.
- Investors can use the PE ratio to compare fair valuations of ETFs and stocks, assisting in investment decisions.
- A higher PE ratio may indicate higher risk levels, potentially leading to sharper market sell-offs for companies and ETFs.
- The PE ratio provides insights on undervaluation or overvaluation compared to other investment opportunities, aiding in decision-making.
- Understanding the average PE ratio for ETFs is crucial for investors to make informed decisions and navigate the complex world of financial markets.
- The price per earnings ratio is an essential tool for investors to evaluate the valuation of ETFs and make informed investment decisions.
What is a PE Ratio and Why It Matters for ETFs?
The price to earnings (PE) ratio is a key metric for valuing companies or ETFs. It's found by dividing the stock price by earnings per share. Knowing the pe ratio meaning is vital for investors. It shows if a stock is overvalued or undervalued.
A high PE ratio might mean the stock could grow a lot. On the other hand, a low PE ratio could mean it's a good buy.
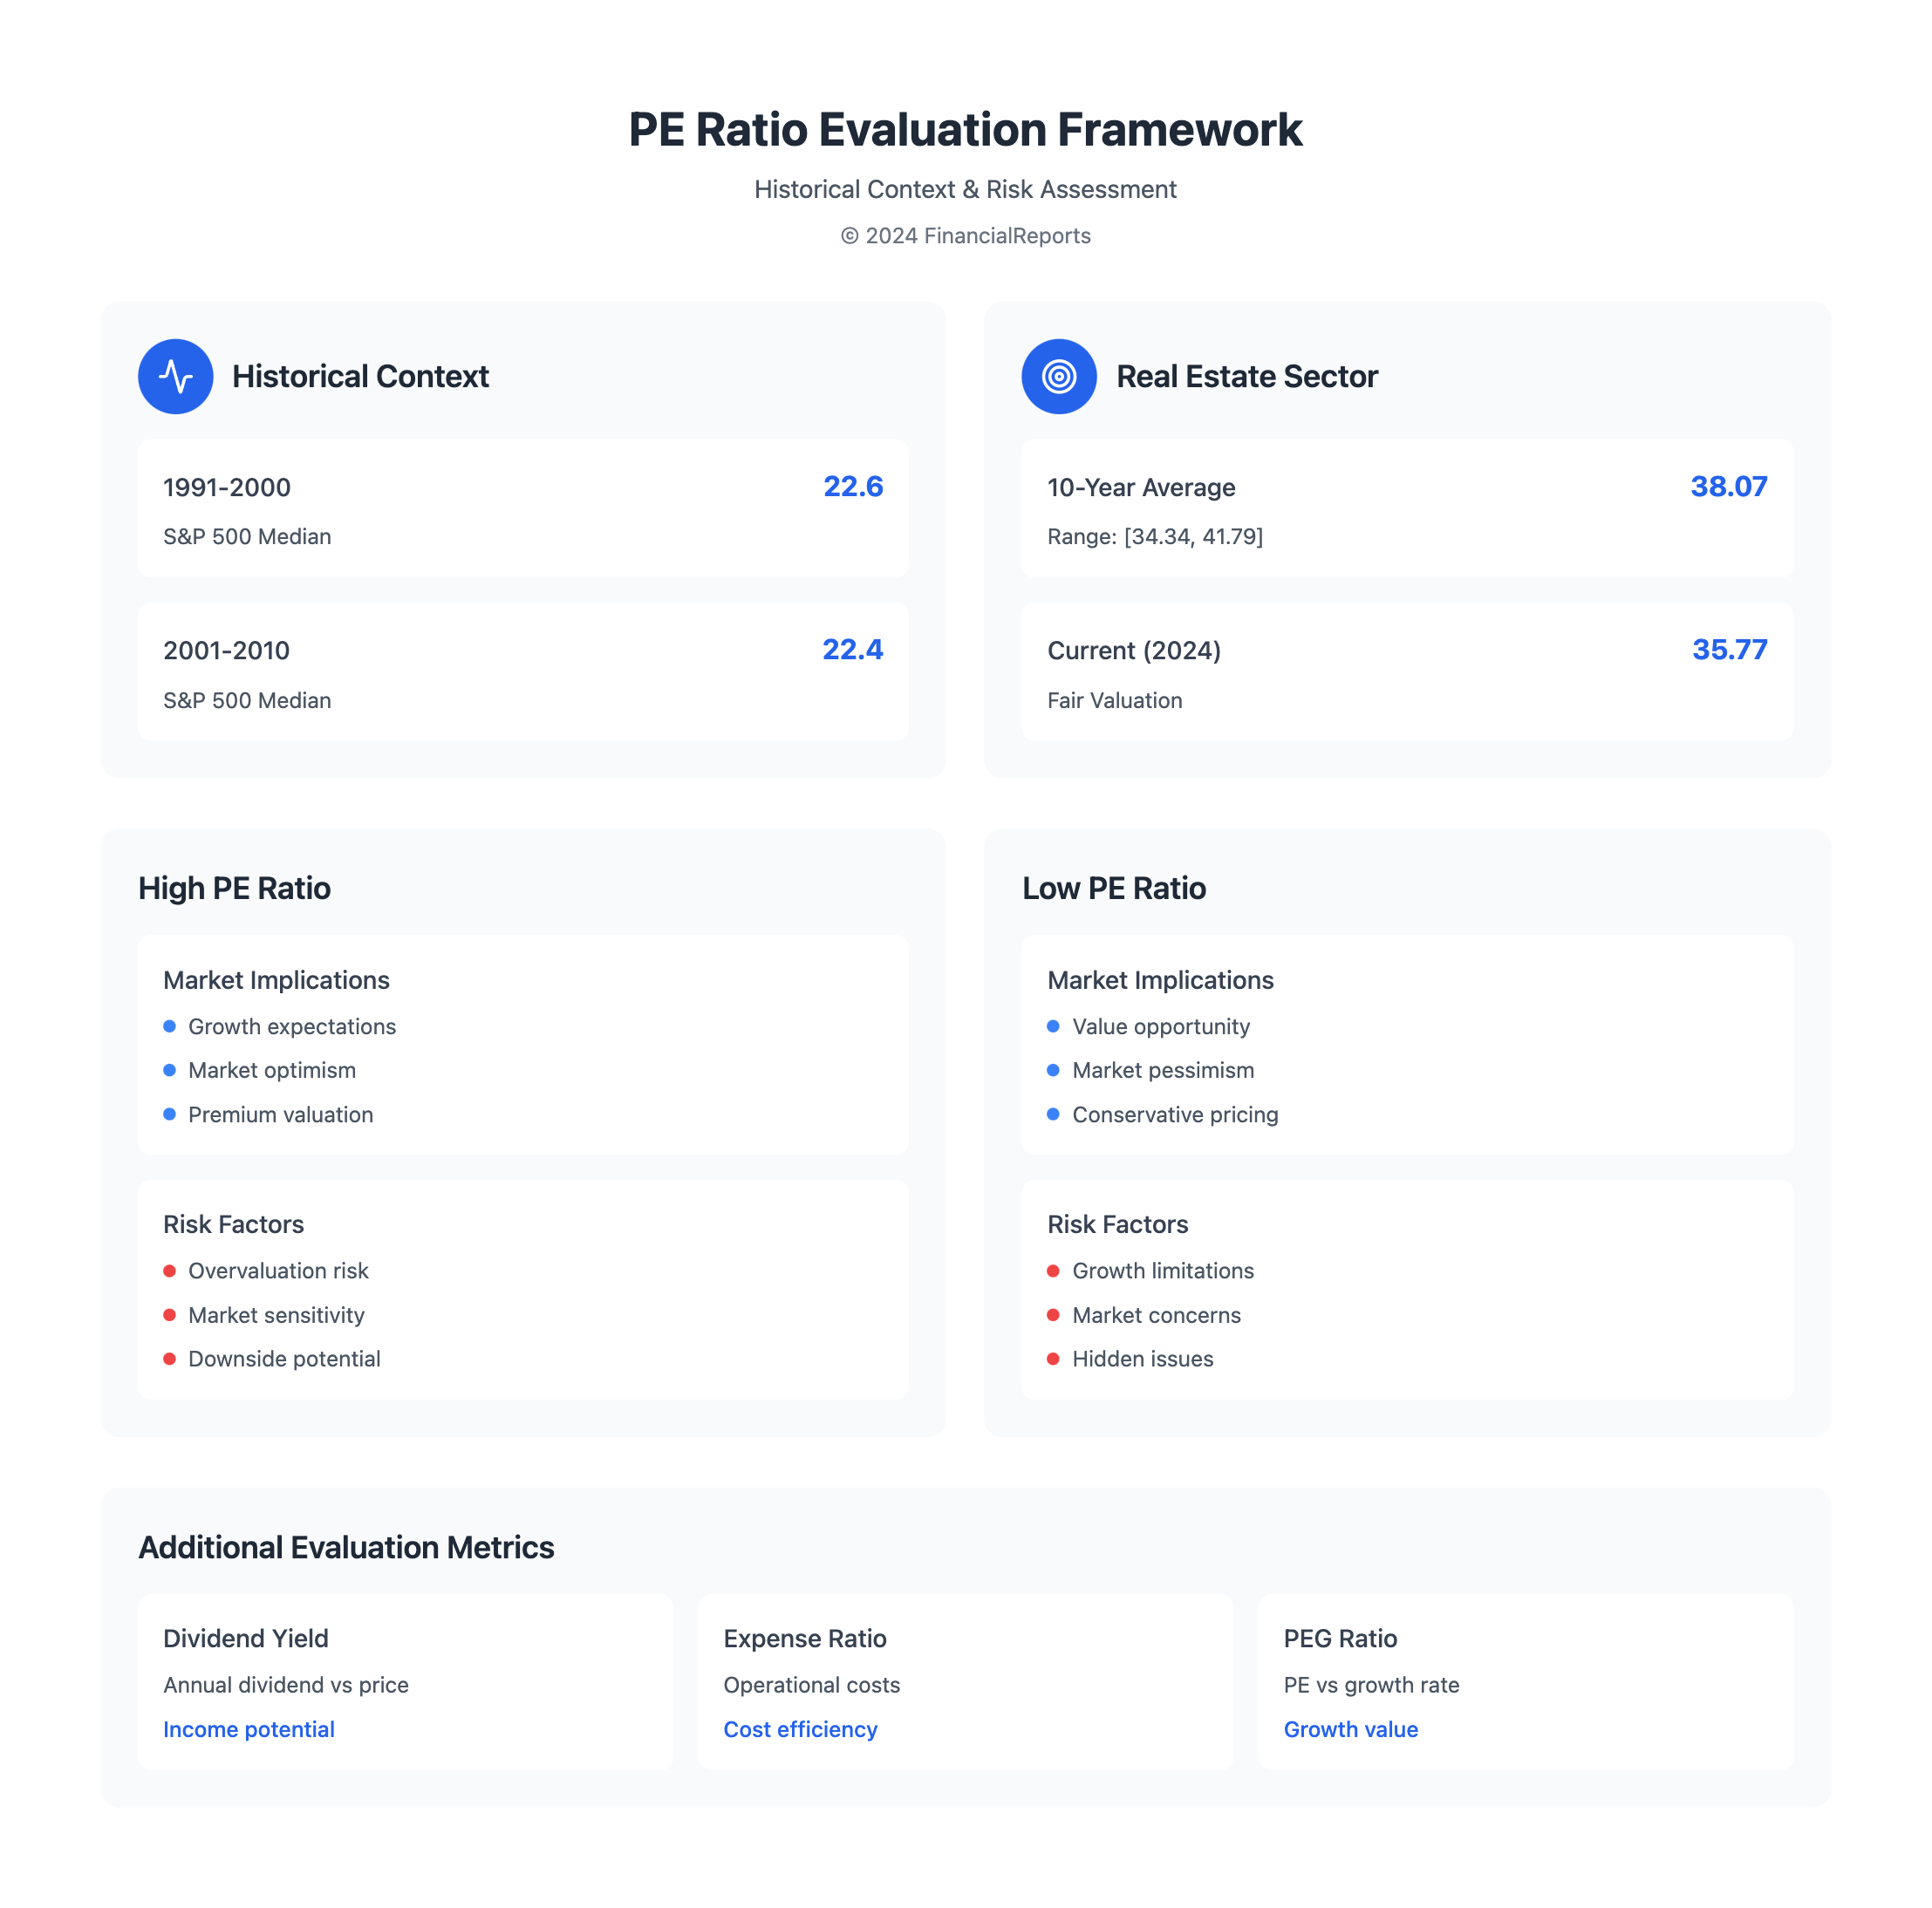
When checking ETFs, the sp500 pe ratio is often used as a guide. The S&P 500 Index's PE ratio changes over time. For instance, it was 22.6 from 1991 to 2000 and 22.4 from 2001 to 2010.
To find out if a PE ratio is good, look at the industry average. Also, consider the company's growth and the market's state.
Here are some important points about PE ratios:
- The PE ratio compares a company's current stock price to its earnings per share (EPS).
- Trailing PE ratios are based on historical data, while forward PE ratios use future estimates.
- A high PE ratio can indicate overvaluation or strong growth prospects for a stock.
- A low PE ratio may suggest undervaluation or pessimism regarding a company's future earnings.
| Index | Median PE Ratio |
|---|---|
| S&P 500 | 22.6 (1991-2000), 22.4 (2001-2010) |
Calculating the Average PE Ratio for ETFs
To find the average PE ratio for ETFs, investors need to follow a few steps. They must first grasp what a price earnings multiple is and how to use the p ratio formula. The PE ratio is found by dividing the stock price by the earnings per share (EPS). For ETFs, this ratio is a mix of the valuations of the companies in the fund.
Investors can look up P/E ratios for ETFs in several ways. They can check ETF provider factsheets, free finance websites, or their brokerage accounts. It's important to use trustworthy data sources and know the limits of each method. A good PE ratio changes based on market conditions and the ETF itself. By looking at the PE ratio, investors can see if a stock is overvalued, undervalued, or fairly priced compared to its earnings.
Some important things to remember when calculating the average PE ratio for ETFs include:
- Understanding the p ratio formula and how it applies to ETFs
- Using reliable data sources to determine the PE ratio
- Considering the limitations of different calculation methods
- Evaluating the PE ratio in the context of market conditions and the specific ETF
Historical Context of PE Ratios in ETFs
The s and p 500 pe ratio has changed over time. This reflects shifts in market mood and economic conditions. To grasp the history of PE ratios in ETFs, we must look at the formula and how to calculate them. The calculation involves dividing the stock price by earnings per share, showing what the market expects for future growth.
When we look at PE ratio history, it's key to know how they're calculated. Different sources might give different PE ratios for the same ETF. For example, the S&P 500's median P/E was 15.00 in June 2024. This shows why it's important to understand the calculation method.
Several factors can change PE ratios. These include:
- Market conditions: Bull and bear markets can greatly affect PE ratios. Investors often pay more for stocks when the market is growing.
- Economic cycles: During economic downturns, PE ratios can drop. This shows investors' reduced confidence.
- Sector-specific events: Changes in certain sectors, like new regulations or trends, can also influence PE ratios.
Understanding the history of PE ratios in ETFs helps investors make better choices. The calculation and formula are key, but we must also consider the wider market and economy. This gives us a clearer view of trends and patterns.
Average PE Ratio Across Different Sectors
The average PE ratio changes a lot between sectors. Companies that grow fast, like tech ones, often have higher P/Es. This means investors are ready to pay more for these stocks now because they expect them to grow more in the future.
To grasp the pe multiple meaning, it's key to look at the average PE ratios for each sector.
The sp500 pe multiple is a key benchmark for the S&P 500 index's average PE ratio. To figure out the PE ratio, you can use the how to calculate pe formula. This involves dividing the stock's current price by its earnings per share. The s and p pe ratio is also vital for investors. It shows the overall market's value.
Here is a table showing the sector-specific P/E ratios:
| Sector | P/E Ratio |
|---|---|
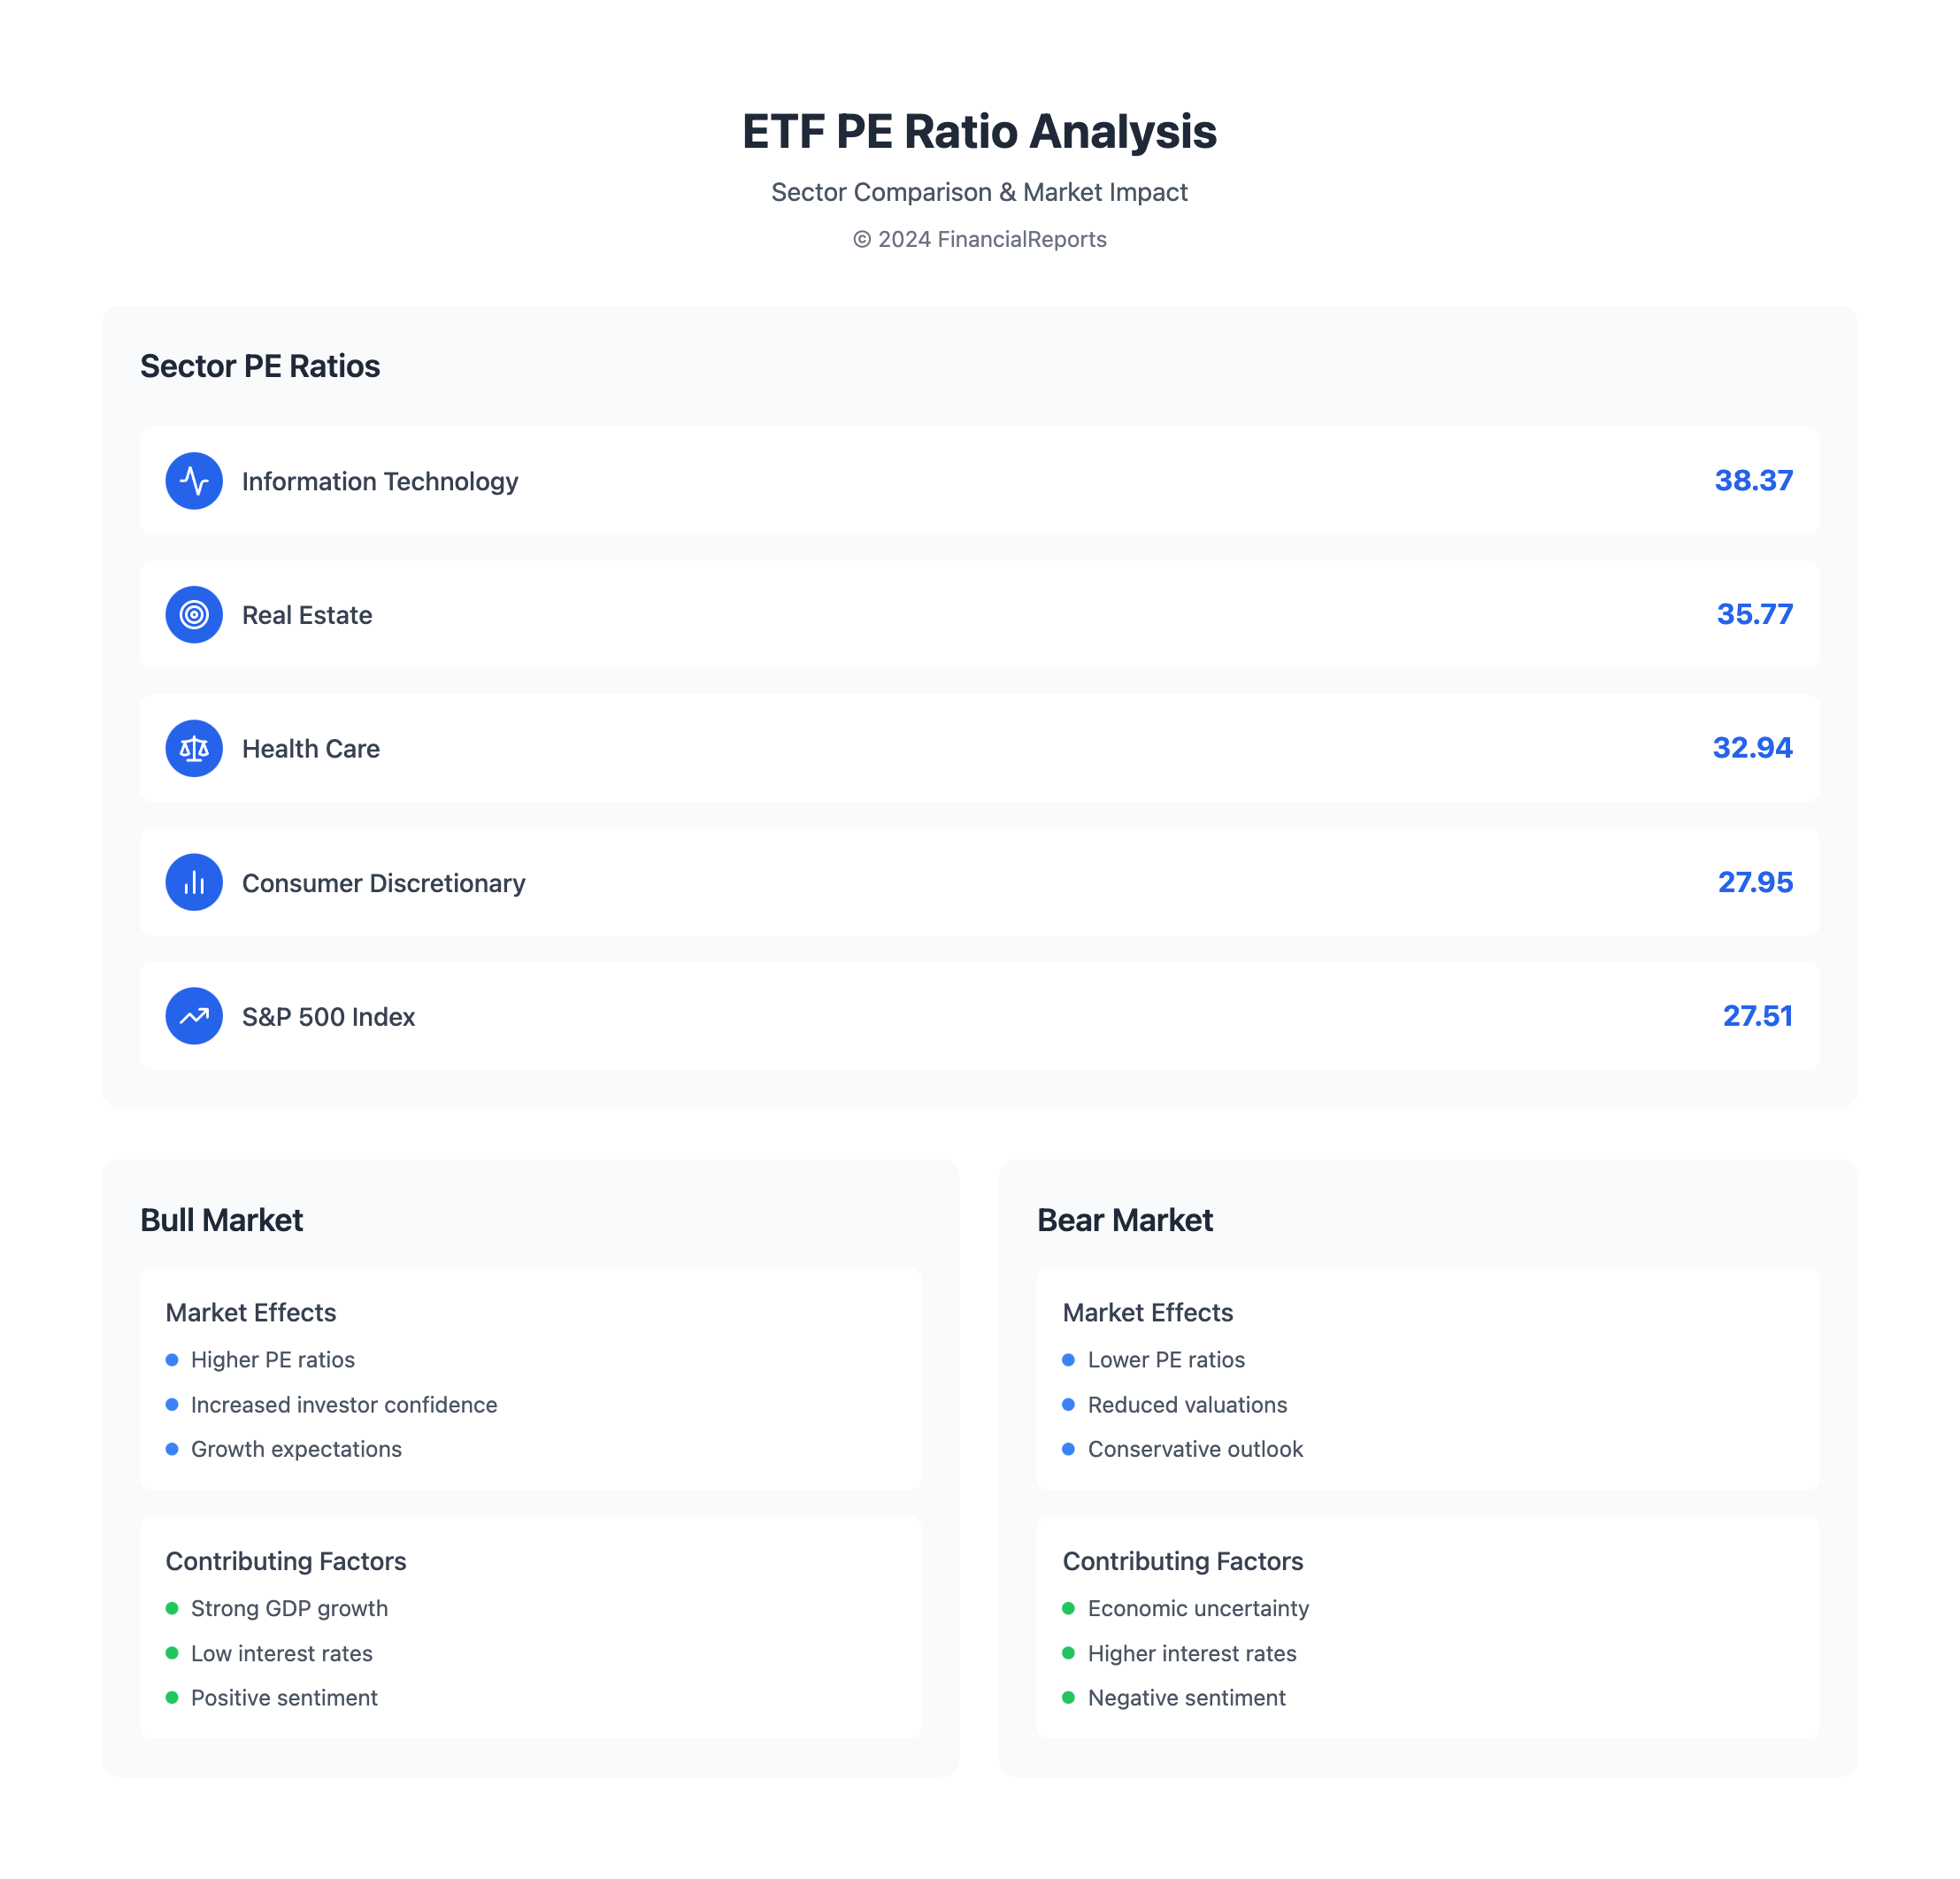
| Information Technology | 38.37 |
| Real Estate | 35.77 |
| Health Care | 32.94 |
| Consumer Discretionary | 27.95 |
| S&P 500 Index | 27.51 |
Investors can use these sector-specific P/E ratios to check the value of different sectors. This helps them make smart investment choices. By knowing the average PE ratio across sectors, investors can understand market growth expectations better.
The Role of Market Conditions in PE Ratios
Market conditions greatly affect the PE ratios of ETFs. A healthy pe ratio for an etf changes with the market's state. Bull markets push PE ratios up, while bear markets pull them down. Knowing the price to earnings formula and pe ratio equation helps us see how market conditions influence PE ratios.
The p e ratio calculator is useful for finding an ETF's PE ratio. But, we must also think about the market and the economy. For instance, in a bull market, the ETF's PE ratio might rise because of higher stock demand. In a bear market, it could fall due to lower demand.
Several factors affect PE ratios, including:
- Interest rates
- Inflation
- GDP growth
- Market sentiment
These elements can change an ETF's PE ratio. It's important to look at them when judging the fund's performance.
| Market Condition | Impact on PE Ratio |
|---|---|
| Bull Market | Increases PE Ratio |
| Bear Market | Decreases PE Ratio |
Understanding how market conditions affect PE ratios helps investors make better choices. It's key to look at the pe ratio equation and price to earnings formula alongside market conditions. This way, we can find a healthy pe ratio for an etf.
Risks Associated with High or Low PE Ratios
When looking at ETFs, it's key to think about the risks of high or low PE ratios. A high PE ratio might mean the stock price is too high compared to earnings. This could signal that the stock is overvalued. On the flip side, a low PE ratio could mean the stock price is too low compared to earnings. This might show that the stock is undervalued.
To find the best p e ratio, investors should look at the pe ttm and ttm pe ratio together with other data and market conditions.
Investors need to watch out for times when PE ratios can be misleading. For instance, a stock with a high p e ttm ratio might seem overvalued. But, if it's growing fast, it could be a smart buy. On the other hand, a stock with a low ttm pe ratio might seem undervalued. Yet, if its earnings are shaky, it could be riskier.
| PE Ratio | Risk Level | Description |
|---|---|---|
| High PE Ratio | High | Potentially overvalued, with a high stock price relative to earnings |
| Low PE Ratio | High | Potentially undervalued, with a low stock price relative to earnings |
By knowing the risks of high or low PE ratios, and looking at the p e ttm and ttm pe ratio with other metrics, investors can make better choices. This helps them avoid common pitfalls in investing.
Average PE Ratio vs. Historical PE Ratio
Investors look at the price to earnings ratio, or pe ratio meaning, to see if a stock is cheap or pricey. The pe ratio is found by dividing the stock's price by its earnings per share. A low price to earnings ratio might mean a stock is a good deal. On the other hand, a high pe ratio could suggest it's overpriced.
To figure out if a pe ratio is good, investors compare it to the past. For instance, the S&P 500 Real Estate Sector has seen an average pe ratio of 38.07 over 10 years. The range has been [34.34, 41.79]. By December 27, 2024, the sector's pe ratio was 35.77, seen as fair. For more on pe ratio calculations, check out investopedia.
When looking at pe ratio, keep these points in mind:
- The current pe ratio versus the historical average
- The range of the historical pe ratio
- The company's earnings growth and dividend payments
By looking at these aspects and the pe ratio in the company's financial health and market trends, investors can make better choices. This is true for both stocks with high pe ratio and low price to earnings ratio stocks.
Evaluating ETFs Beyond PE Ratio
Investors often use the price-to-earnings (P/E) ratio to check an ETF's value. But, this method has its limits. A full review should look at more than just the P/E ratio. For example, the sp500 pe ratio gives insight into the market, but it's not the only thing to consider.
A balanced approach includes other indicators like the price/earnings-to-growth (PEG) ratio. This helps find a good price to earnings ratio.
To really understand an ETF's worth, investors should look at several key metrics:
- Dividend yield: Shows the annual dividend payments compared to the stock's price.
- Expense ratio: Shows the percentage of a fund's assets used for operational costs.
- PEG ratio: Evaluates investment value based on growth prospects, giving a fuller picture than the P/E ratio alone.
Using these metrics with the P/E ratio helps investors make better choices. For instance, a low P/E ratio might mean the stock is undervalued. But, a high PEG ratio could mean it's overvalued compared to its growth. Knowing about the price earnings multiple and its formula helps investors understand these complexities. It helps them find growth opportunities.
Making Informed Decisions Using PE Ratios
Analyzing the price-to-earnings (PE) ratio is key for investors. It helps you see if an ETF is overvalued or undervalued. By comparing PE ratios, you can choose ETFs that fit your goals and risk level.
How Investors Can Use PE Ratios to Decide
First, look at the average PE ratios for sectors and industries you like. This can show you if an ETF is cheap or expensive compared to others. For instance, a low PE ratio might mean an ETF is a good deal for your portfolio.
Building a Balanced ETF Portfolio with PE Ratios
When picking ETFs, consider PE ratios along with other metrics. Mix ETFs with high PE ratios for growth and those with low PE ratios for value. This balance can protect your portfolio from market ups and downs.
FAQ
What is the average PE ratio for ETFs?
The average PE ratio for ETFs is a mix of the PE ratios of its holdings. It shows the overall value of the ETF, different from individual stocks.
Why is the PE ratio important for ETF investors?
The PE ratio is key for ETF investors. It helps check if the fund is valued right and compares it to others. It shows if an ETF is cheap or expensive compared to its peers or past values.
How do I calculate the average PE ratio for an ETF?
To find the average PE ratio for an ETF, you must understand it's a mix. You need to look at the PE ratios of each holding and weight them by their share in the fund.
What are the historical trends in PE ratios for ETFs?
Over the last ten years, PE ratios for ETFs have changed with the market. They've been influenced by economic cycles and events in different sectors. Looking at these trends helps understand current values and what might happen next.
How do average PE ratios differ across various sectors?
PE ratios vary by sector, with some being more or less valued. Knowing these differences helps investors make choices that fit their goals.
How do market conditions impact the PE ratios of ETFs?
Market conditions like interest rates and GDP growth affect ETF PE ratios. Understanding these links helps predict how PE ratios might change with the market.
What are the risks associated with high or low PE ratios in ETFs?
High or low PE ratios in ETFs can be risky. They might mislead investors. It's important to look at other metrics and the market context to avoid mistakes.
How do current average PE ratios compare to historical averages for ETFs?
Comparing today's PE ratios to past trends gives insights into ETF valuations and future performance. This comparison helps investors make better choices.
What other metrics should investors consider alongside PE ratios for ETFs?
While PE ratios are important, other metrics like the PEG ratio and dividend yield are also key. They help understand an ETF's value and growth prospects fully.