Understanding PE Definitions: Your Guide to Financial Terminology
Finance can be complex, with terms like pe standing for Price-to-Earnings ratio or Private Equity. These terms are key for investors and financial experts. They help in judging company performance and making smart investment choices.
What pe means can change based on the context. The Price-to-Earnings ratio compares a company's stock price to its earnings per share. This helps investors see if a stock is too expensive or a good deal. Private Equity, on the other hand, involves investing in private companies. The aim is often to sell the company for a profit or take it public.
Key Takeaways
- Pe definitions cover both Price-to-Earnings ratio and Private Equity, two vital finance concepts.
- Grasping pe definitions is critical for investors and financial pros to make wise choices.
- The Price-to-Earnings ratio aids in assessing company performance and spotting overvalued or undervalued stocks.
- Private Equity investments might offer better returns but come with big commitments and limited liquidity.
- Understanding pe definitions, including what pe stands for, is vital for navigating finance's complexities.
What is PE in Finance?
The term PE, or Price-to-Earnings ratio, is a way to value a company. It compares the stock price to earnings per share. Knowing what pe stands for is key in finance, as it helps investors see a company's worth.
It shows how much investors are ready to pay for each dollar of earnings. The PE ratio is found by dividing the stock price by earnings per share.
To find the PE ratio, use the formula: PE ratio = market value per share / earnings per share. For instance, if a stock is $20 and earnings per share are $1, the PE ratio is 20. This shows investors are willing to pay $20 for every $1 of earnings. Understanding pe helps investors make better choices.
Definition of PE Ratio
The PE ratio is key in value investing. It shows if a stock is undervalued or overvalued. A low PE ratio might mean a stock is cheap, while a high one might mean it's pricey.
Investors use the PE ratio to decide on investments. They compare it to industry averages or benchmark indices.
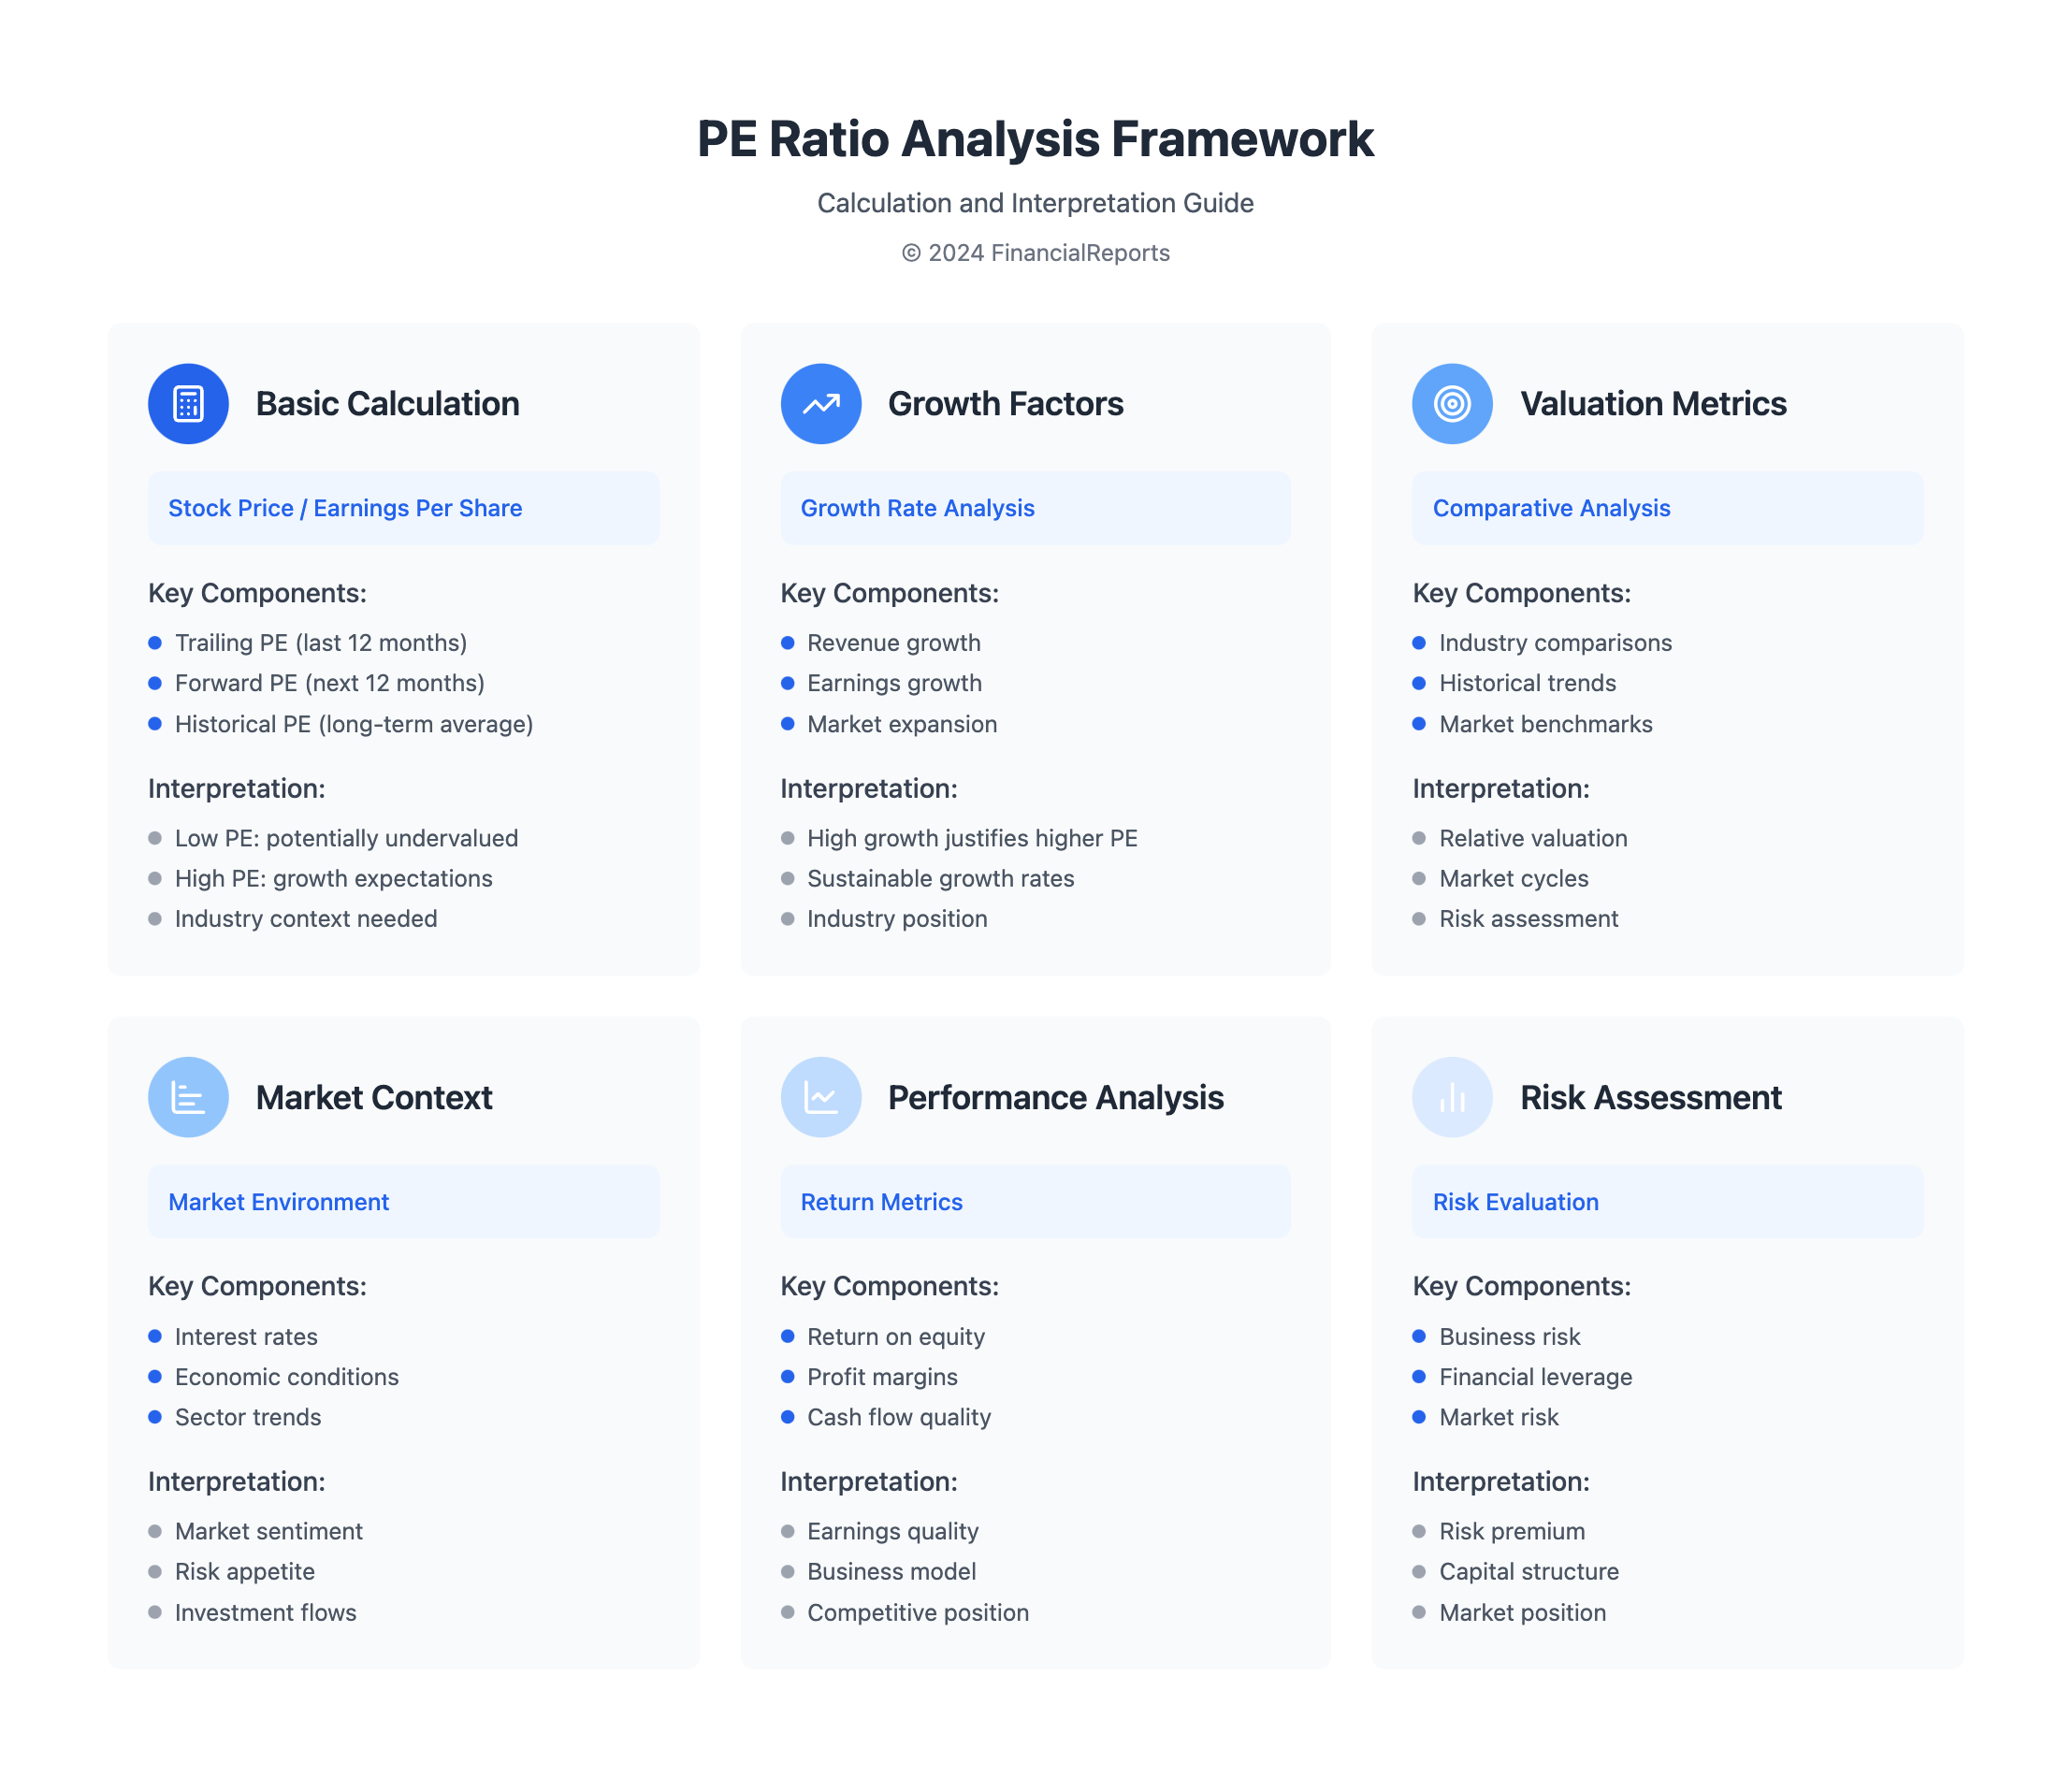
How PE Ratio is Calculated
The PE ratio can be found using the last 12 months' earnings per share or the next 12 months' projected earnings. The TTM PE ratio uses the last 4 quarterly EPS. The forward PE ratio uses the current share price and the next 4 quarters' projected EPS.
Importance of PE Ratio
The PE ratio is vital for comparing a company to its peers. Different industries have different average PE ratios. Knowing these ratios helps see a stock's value compared to others and its history.
But, the PE ratio alone shouldn't decide your investment. It has its limits, like differences between sectors and not being reliable for companies without profits.
| Company | Stock Price | Earnings Per Share | PE Ratio |
|---|---|---|---|
| Company A | $3 | $0.17 | 17.65 |
| Company B | $20 | $0.67 | 29.85 |
Types of PE Ratios
When looking at a company's stock, it's key to know the different PE ratios. The terms "pe abbreviation" and "pe acronym" both mean the same thing. There are three main types: trailing PE, forward PE, and historical PE.
The trailing PE ratio looks at past earnings. The forward PE ratio looks at future earnings. The historical PE ratio gives a long-term view. Each has its own strengths and weaknesses. Investors should think about these when deciding to invest.
Trailing PE
The trailing PE ratio is found by dividing the stock price by the EPS over the last 12 months. It's good for seeing how a company has done in the past. But, it might not predict future success well.
Forward PE
The forward PE ratio is found by dividing the stock price by the projected EPS for the next 12 months. It shows how a company might be valued in the future. But, it depends on uncertain forecasts.
Historical PE
The historical PE ratio gives a long-term view of a company's value. It helps investors see trends and patterns. This ratio is useful for understanding a company's long-term performance.
| Type of PE Ratio | Calculation | Usefulness |
|---|---|---|
| Trailing PE | Current stock price / EPS (past 12 months) | Analyzing past performance |
| Forward PE | Current stock price / Projected EPS (next 12 months) | Predicting future performance |
| Historical PE | Current stock price / Average EPS (long-term) | Identifying trends and patterns |
The Role of PE Ratios in Investing
Understanding the Price-to-Earnings (PE) ratio is key when you think about what does p e stand for. The PE ratio compares a company's stock price to its earnings per share (EPS). It's found by dividing the stock price by EPS. For example, a PE ratio of 25 means investors are ready to pay $25 for every $1 of earnings.
The PE ratio is important for seeing how a company's value stacks up against its earnings. It helps investors compare a company to its peers. A high PE ratio might show investors are excited about the company's future. On the other hand, a low PE ratio could mean the stock is a good deal or has uncertain future earnings.
Here are some key points to consider when using PE ratios in investing:
- PE ratios can be based on past data (trailing PE) or future estimates (forward PE).
- It's important to compare a stock's PE ratio to its past and peer companies' ratios to understand its value.
- Even though high or low PE ratios can hint at opportunities or risks, a stock can stay overvalued or undervalued for a long time.
| PE Ratio | Interpretation |
|---|---|
| High PE Ratio | May indicate overvaluation or high growth expectations |
| Low PE Ratio | May indicate undervaluation or poor growth prospects |
By grasping what does p e stand for and how to use PE ratios, investors and financial experts can make better choices. They can better understand the stock market's complexities.
Limitations of PE Ratios
Understanding what does p e mean in finance is key. PE ratios have their limits. Market conditions can greatly affect these ratios. For example, during times of high market volatility, PE ratios can be misleading.
PE ratios also vary between growth and value stocks. Growth stocks often have higher PE ratios because of their growth prospects. This makes them different from value stocks.
High PE ratios might mean a stock is overvalued or expected to grow a lot. On the other hand, low PE ratios could suggest a stock is undervalued or has slow growth. To get a clear picture, it's important to look at PE ratios alongside other financial metrics.
- Market conditions and their impact on PE ratios
- The differences between growth and value stocks
- The importance of considering PE ratios in context with other financial indicators
Knowing these limitations helps investors make better choices. It's vital to understand what does p e mean in finance. This knowledge is essential for smart investment strategies.
Other Related Financial Metrics
When looking at a company's financial health, it's important to check more than just pe ratios. Two useful metrics are the Price-to-Book (P/B) ratio and the Price-to-Sales (P/S) ratio.
The P/B ratio shows if a stock is cheap or expensive by comparing its market value to its net assets. The P/S ratio looks at the stock's value compared to its sales. This helps investors see if a stock is fairly priced.
Price-to-Book (PB) Ratio
The PB ratio is found by dividing the company's market value by its net assets. It's great for value investors who want to find cheap stocks.
Price-to-Sales (PS) Ratio
The PS ratio is found by dividing the company's market value by its sales. It helps investors see how a stock's value compares to its sales.
By looking at these metrics along with pe ratios, investors can understand a company's financial health better. This helps them make smarter investment choices.
| Metric | Formula | Description |
|---|---|---|
| P/B Ratio | Market Capitalization / Net Asset Value | Compares market capitalization to net asset value |
| P/S Ratio | Market Capitalization / Revenue | Measures market capitalization relative to revenue |
How to Interpret PE Ratios
Understanding PE ratios means looking at the big picture. This includes industry averages and how fast a company is growing. Knowing what pe stands for, or the price-to-earnings ratio, helps us see a company's financial health. It shows how much investors are ready to pay for each dollar of earnings.
To really get what PE ratios mean, we need to think about the company's growth, its industry, and the market. A high PE ratio might mean a stock is overvalued. On the other hand, a low PE ratio could mean it's undervalued.
For example, Biotech Stock ABC has a PE ratio of 35, which is higher than the S&P 500's median. Oil Stock XYZ, with a PE ratio of 16, is closer to the median. The PE ratio formula helps us compare by dividing the stock's market value by its earnings per share (EPS).
| Company | PE Ratio | Growth Rate |
|---|---|---|
| Biotech Stock ABC | 35 | 25% |
| Oil Stock XYZ | 16 | 15% |
By looking at these factors, investors can make better choices. The PE ratio is a key tool for checking a company's financial health and growth chances.
PE Ratio Trends Over Time
The pe abbreviation, or price-to-earnings ratio, is a key tool in finance. It helps us understand a company's or market's value. Over the years, the pe acronym trends have changed a lot, due to different economic and market factors. The S&P 500's pe ratio has swung from lows of about 6 to highs over 120 in extreme times.
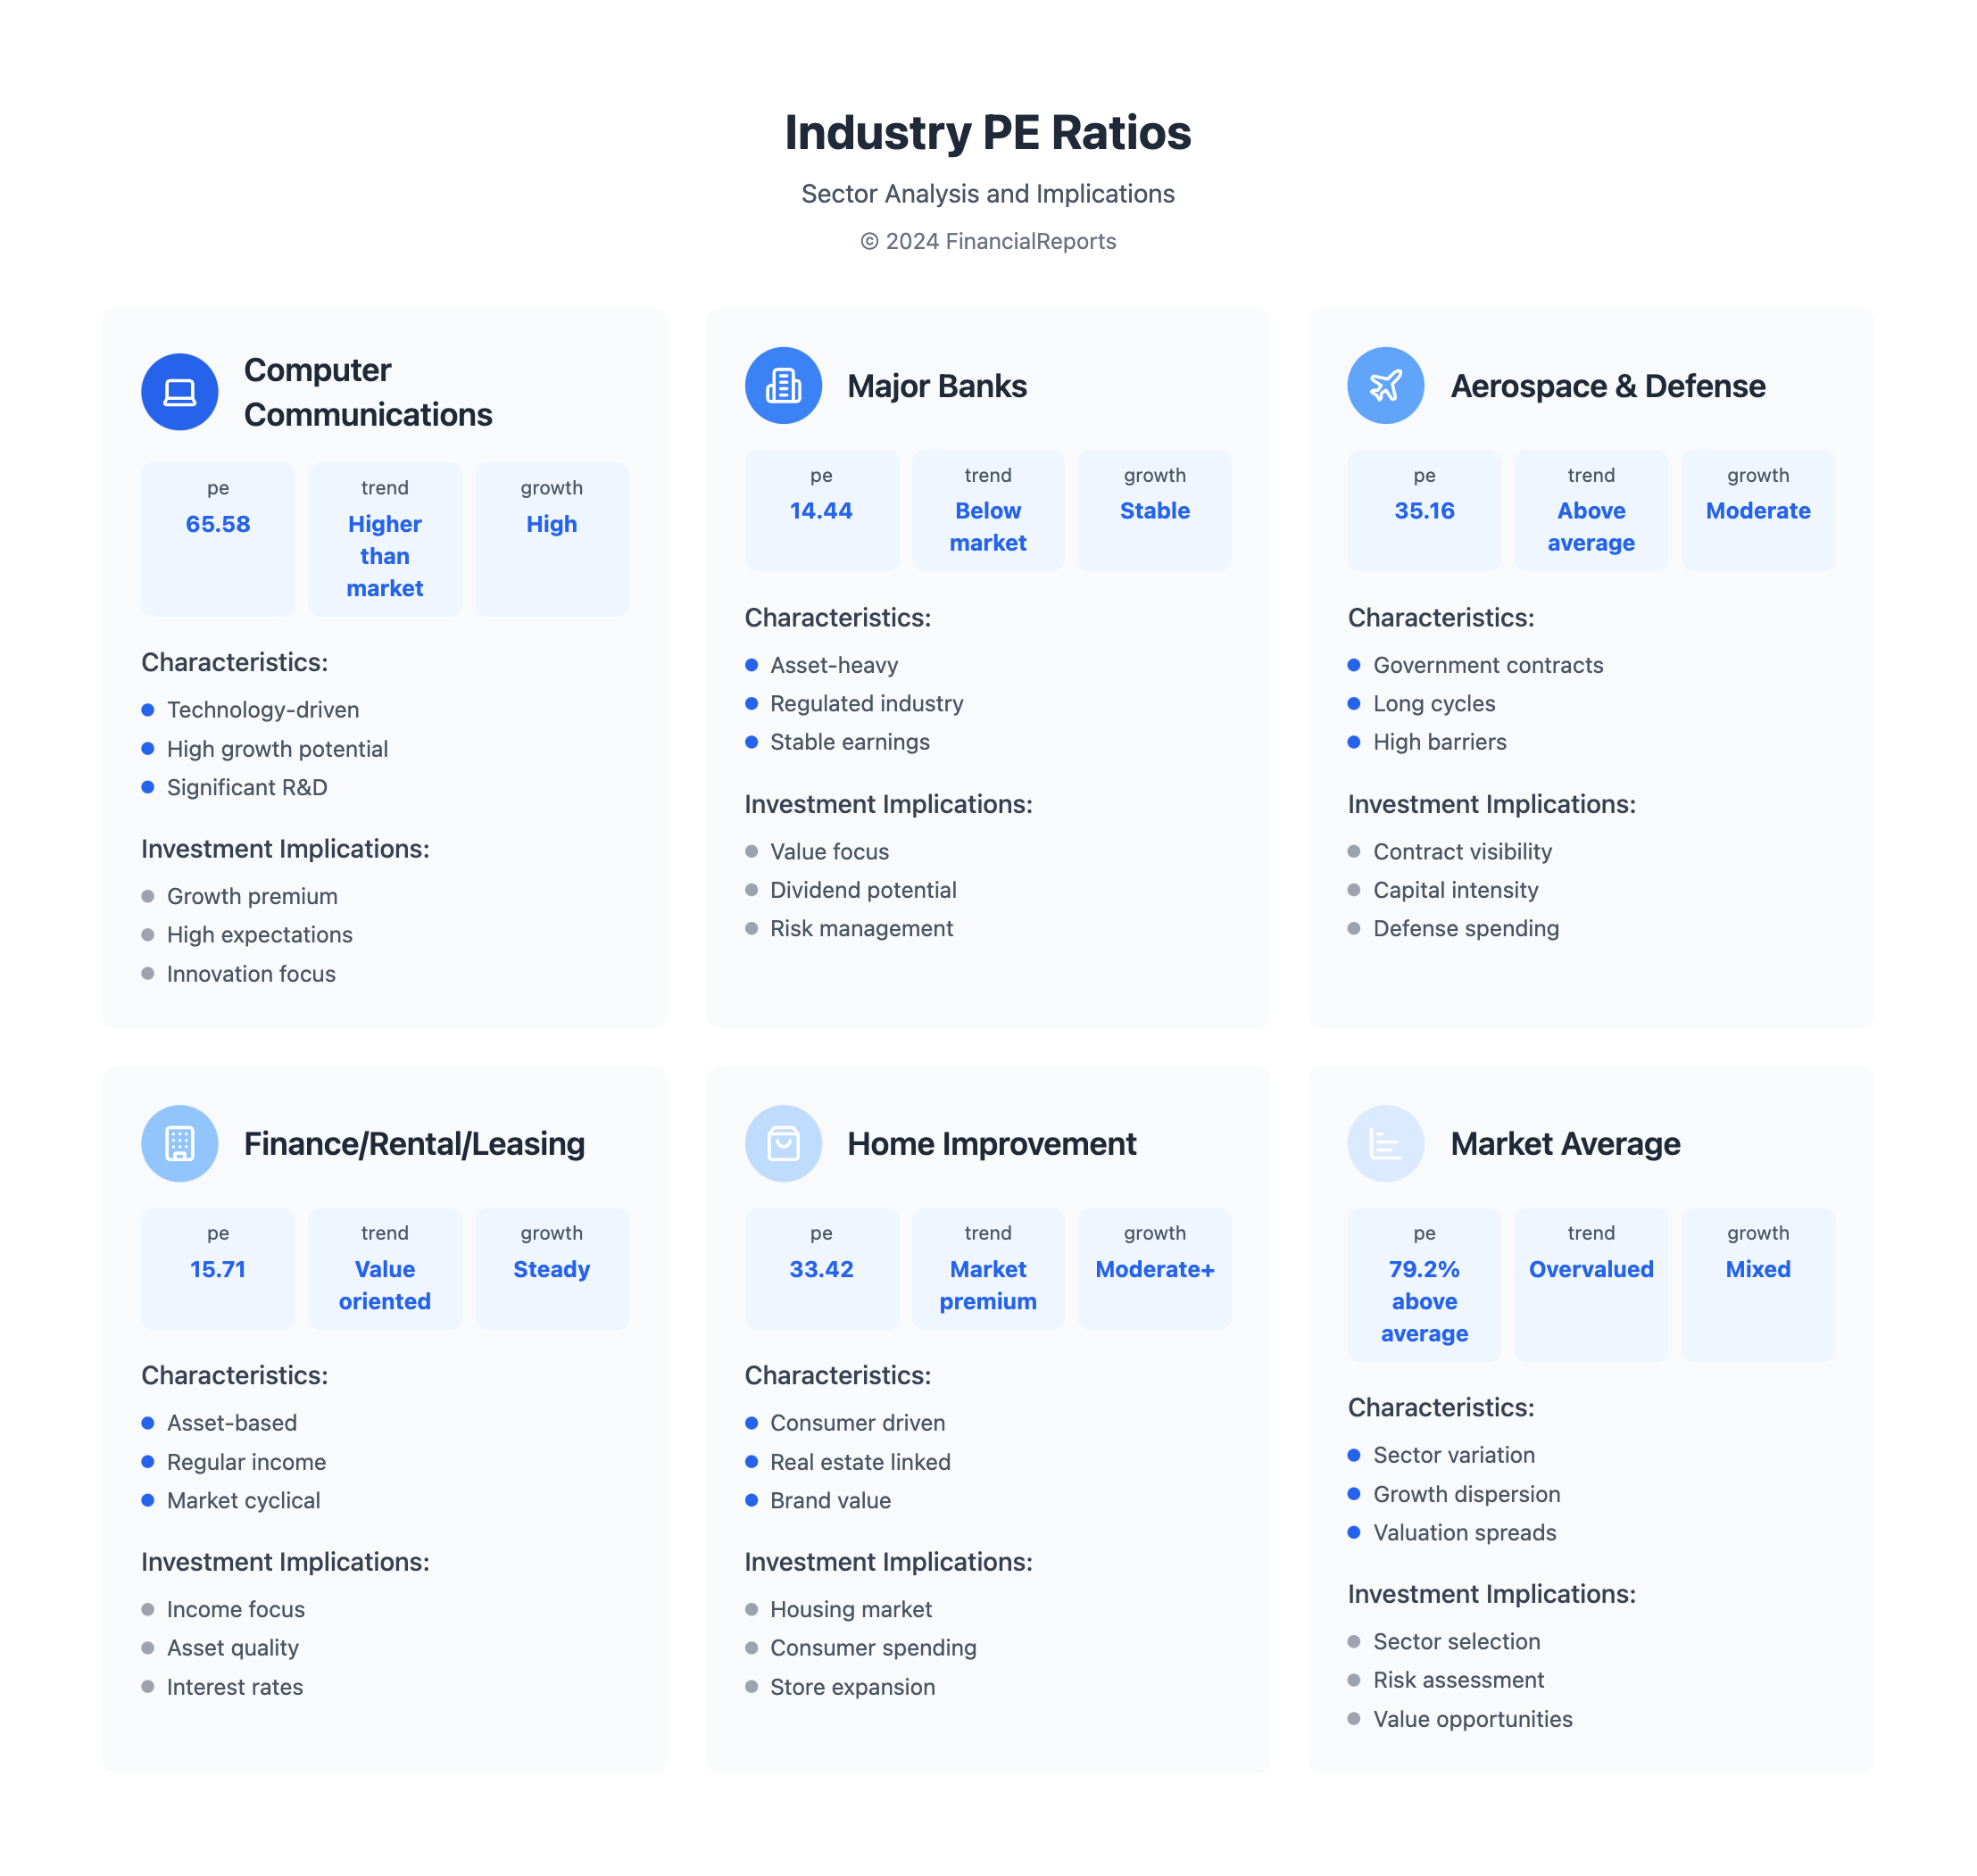
Interest rates have played a big role in shaping the pe ratio. As of September 30, 2024, the S&P 500 P/E ratio is 79.2% above its modern-era average. This shows the market is strongly overvalued. Here's a table showing average pe ratios for different industries:
| Industry | Average PE Ratio |
|---|---|
| Aerospace & Defense | 35.16 |
| Computer Communications | 65.58 |
| Finance/Rental/Leasing | 15.71 |
| Home Improvement Chains | 33.42 |
| Major Banks | 14.44 |
These trends and ratios give us important insights. They help investors and financial experts make better choices for their investments and portfolios.
Common Misconceptions About PE Ratios
Understanding what does p e stand for is key. Many think a low PE ratio means a stock is a good buy. But, a high PE ratio doesn't always mean a stock is overvalued. For example, Company 'A' has a P/E of 15x, while Company 'B' is at 50x. Yet, Company 'B' makes four times more cash flow than Company 'A' each year, even with the same 8% growth rate.
Looking at free cash flow growth is more important than just profit or asset value. This helps investors make better choices. Here are some important points to remember:
- PE ratios change based on earnings growth, market mood, and the economy.
- Just looking at P/E ratios might not give you the whole picture.
- A lower P/E ratio doesn't always mean a stock is a better buy.
By grasping these ideas, investors can make smarter choices. They can avoid common mistakes about PE ratios.
| Company | P/E Ratio | Return on Capital Employed (RoCE) | Cash Flow Growth |
|---|---|---|---|
| Company 'A' | 15x | 10% | 8% |
| Company 'B' | 50x | 40% | 32% |
How to Use PE Ratios in Portfolio Management
Knowing what does p e mean is key for investors. It helps them see if a stock is overvalued, undervalued, or fairly priced. The PE ratio is vital in many investment plans, like value and growth investing. It helps investors spot good chances and make smart choices.
A company's PE ratio can be compared to its past average or industry average. For instance, Google's trailing PE ratio is 23.8, and its forward PE ratio is 17.7. This info helps investors decide if they should buy, sell, or hold a stock.
Here are some ways to use PE ratios in portfolio management:
- Compare a company's PE ratio to its industry average to determine its relative valuation
- Use the PE ratio to identify possible growth chances or undervalued stocks
- Watch changes in a company's PE ratio over time to spot trends and patterns
By using PE ratios in their strategies, investors can make better choices. This might lead to higher returns. Remember, the PE ratio is just one thing to look at when checking a stock. It's best to use it with other financial metrics and analysis.
| Company | Trailing PE Ratio | Forward PE Ratio |
|---|---|---|
| 23.8 | 17.7 |
PE Ratios and Market Sentiment
Market sentiment greatly affects PE ratios. Investor emotions and biases can cause PE ratios to change. This might not always show a company's true value. Knowing pe definitions and what pe stands for is key to understanding market feelings. The PE ratio comparison helps spot good investment chances.
Many things can change a company's PE ratio. This includes market conditions, industry trends, and what investors think. For example, a high PE ratio might mean a stock is too expensive. Yet, it could also hint at the company's growth chances. A low PE ratio might show a company is facing financial issues.
When looking at PE ratios and market mood, keep these points in mind:
- Investor feelings and biases can change PE ratios
- Market conditions and industry trends affect PE ratios
- It's vital to know pe definitions and what pe means to grasp market sentiment
By thinking about these points and the link between PE ratios and market mood, investors can make better choices. They might find stocks that are too cheap or too expensive.
Future of PE Ratios in Financial Analysis
Financial markets are always changing, and so are the tools we use to understand them. The Price-to-Earnings (PE) ratio is key, but new tech is changing how we use it. It's important for companies and investors to keep up with these changes.
Innovations in Valuation Metrics
New ways to measure a company's value are coming up. These include looking at a company's debt and cash flow. These new metrics might change how we see a company's health, alongside the PE ratio.
PE Ratios in the Age of Data Analytics
Now, we have more data and tools to analyze it. This means we can understand PE ratios better. Tools like AI help predict earnings and understand market trends. This could make our investment choices more accurate and timely.
FAQ
What is the meaning of PE in finance?
In finance, PE can mean two things. It can be the Price-to-Earnings (P/E) ratio or Private Equity. The P/E ratio helps figure out a company's value. Private Equity is about investing in companies that aren't publicly traded.
What is the Price-to-Earnings (P/E) ratio?
The P/E ratio is a way to check a company's value. It's found by dividing the stock price by earnings per share. This helps compare a company's value to others or the market.
How is the P/E ratio calculated?
To find the P/E ratio, divide the stock price by earnings per share. The formula is: P/E Ratio = Stock Price / Earnings per Share.
Why is the P/E ratio important?
The P/E ratio is key because it shows if a company's stock is worth it. It's used in financial analysis and helps make investment choices.
What are the different types of P/E ratios?
There are three P/E ratios: trailing, forward, and historical. Each is used differently in financial analysis.
How do investors use P/E ratios in their decision-making?
Investors use P/E ratios to see if a company's stock is worth it. They compare it to other companies and decide if it's overvalued or undervalued.
What are the limitations of relying solely on P/E ratios?
P/E ratios can be tricky. Market conditions, growth rates, and accounting practices can change their meaning. This can lead to wrong conclusions.
What other financial metrics complement P/E ratios?
Metrics like the Price-to-Book (P/B) ratio and Price-to-Sales (P/S) ratio are also important. They give more insight into a company's value and health.
How can investors effectively interpret P/E ratios?
To understand P/E ratios, know what's considered high or low. Compare them to industry averages and consider the company's growth and market position.
How have P/E ratios trended over time in the market?
P/E ratios have changed a lot over time. Looking at past trends can show what investors think and what the market expects.
What are some common misconceptions about P/E ratios?
Some think a low P/E ratio always means a good investment. Others believe high P/E ratios are always bad. But, a company's earnings quality matters too.
How can P/E ratios be used in portfolio management?
P/E ratios help in different investment strategies. They're used in value and growth investing. They help create a balanced portfolio.
How does market sentiment affect P/E ratios?
Market feelings and biases can change P/E ratios. This might not always show a company's true value. It's important to understand this connection.
What is the future of P/E ratios in financial analysis?
New tech like data analytics and AI are changing how we use P/E ratios. New valuation methods might also come along, changing how we see company values.