Trusted Share Trading Charts for Data-Driven Investing
Online trading has grown a lot, making good charting tools essential. These charts show market trends, helping investors spot patterns and make smart choices. A good stock market chart or trading graph is key, giving a clear view of stock movements.
Platforms like TradingView offer detailed charts at a lower cost than StockCharts.com. They have over 100 tools and indicators, perfect for traders who want to customize without limits. Using these charts, investors can better understand market trends and make informed decisions.
Key Takeaways
- Charts for share trading provide a visual representation of market trends
- A stock market chart or trading graph can be a powerful tool in a trader's arsenal
- TradingView offers detailed and less expensive charts compared to rival StockCharts.com
- Charts can help investors analyze market trends, identify patterns, and make informed decisions
- Utilizing charts for share trading can lead to more data-driven investment decisions
- Platforms like TradingView and StockCharts.com offer a range of charting tools and indicators
- Investors can use charts to identify trends, recognize patterns, and make informed investment decisions
Understanding the Importance of Charts in Share Trading
Trading charts are key for investors, showing stock market trends and patterns. They help investors understand the market and make smart choices. You can customize these charts to fit your needs, with many options available.
Choosing the right chart is important for your strategy. Line charts are good for long-term views, while bar charts are better for short to medium-term analysis. Candlestick charts are popular for active traders, showing opening, closing, high, and low prices.
What Are Share Trading Charts?
Share trading charts show stock market data, like price and volume over time. They help investors spot trends and patterns, guiding their decisions.
How Charts Enhance Decision-Making
Charts make decision-making easier by showing market trends and patterns. Investors can quickly see what's happening in the market. This helps them make better choices by looking at support and resistance levels, moving averages, and other indicators.
The Role of Technical Analysis
Technical analysis is vital in share trading, using charts to study market trends. Investors use technical indicators like moving averages and Bollinger Bands to understand market movements. Charts are essential for technical analysis, providing a clear view of the market.
Types of Charts Used in Share Trading
Stock charting is key in technical analysis. It uses different charts to show market data. By looking at patterns and trends, investors make smart choices. In share trading, four main charts are used: line, bar, candlestick, and area charts.
Candlestick charts are great for spotting trend changes. They use color and size to show market moves clearly.
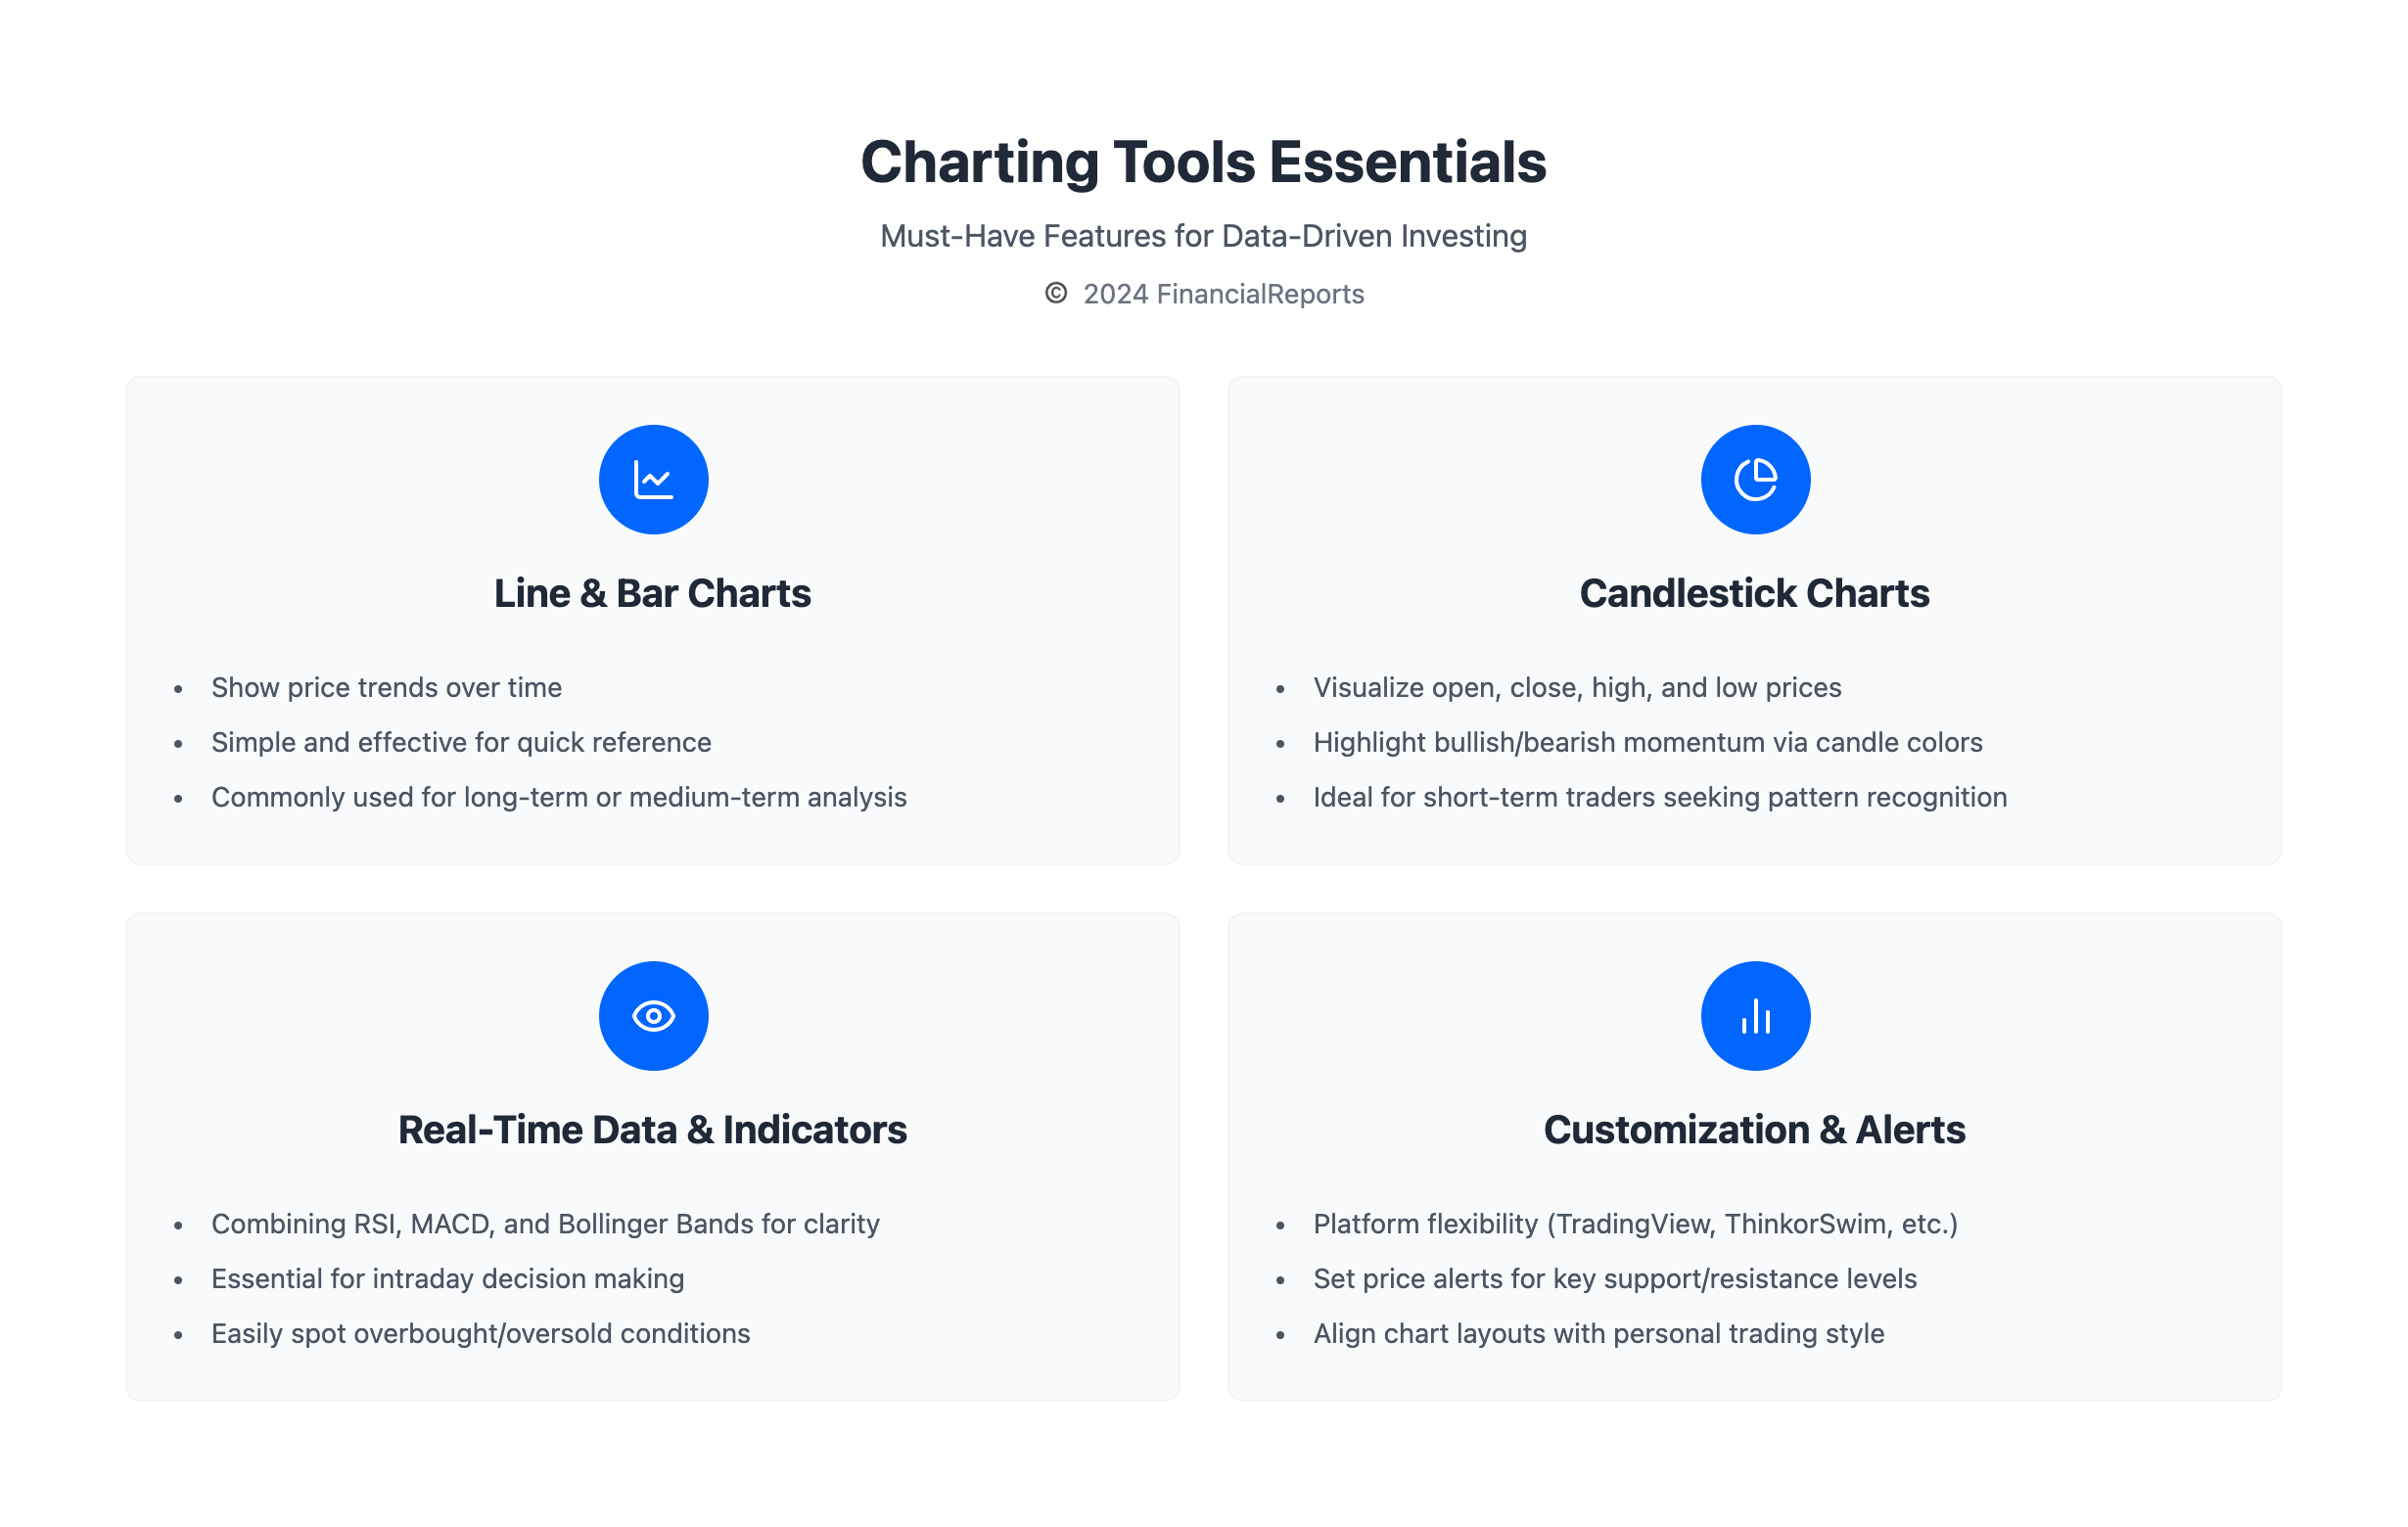
Here are some key features of each chart type:
- Line charts: display the closing price of a security over time
- Bar charts: show the high, low, open, and close prices of a security
- Candlestick charts: provide a visual representation of price action, with colors indicating bullish or bearish trends
- Area charts: display the cumulative total of a security's price over time
By using these charts, traders can spot support and resistance levels. This helps them make better trading plans. ProRealTime Web offers a detailed stock charting experience. It has unlimited indicators and multi-chart layouts, helping traders analyze charts better.
| Chart Type | Description |
|---|---|
| Line Chart | Displays closing price over time |
| Bar Chart | Shows high, low, open, and close prices |
| Candlestick Chart | Provides visual representation of price action |
| Area Chart | Displays cumulative total of price over time |
 Key Features to Look for in Trading Charts
When looking at technical analysis charts, there are important features to find. These include real-time data, options to customize, and technical indicators. Real-time data is key for traders, keeping them updated on market changes. Customization options let traders adjust their charts to fit their needs.
Technical indicators, like moving averages and RSI, are vital too. They help spot trends and predict price changes. Free trading charts offer many indicators and features, like market data and news feeds. These tools help traders understand the market better and make smarter choices.
Some key features to look for in trading charts are:
- Real-time data feeds
- Customization options, such as chart types and time intervals
- Technical indicators, such as moving averages and RSI
- Chart share market data, including price and volume information
By looking at these features, traders can pick the best charts for them. Whether using free charts or paid platforms, traders can use many tools. These include market data and technical indicators.
| Feature | Description |
|---|---|
| Real-time data | Essential for traders, providing up-to-the-minute market information |
| Customization options | Enable traders to tailor their charts to their specific needs and preferences |
| Technical indicators | Help traders identify trends, predict price movements, and make informed decisions |
Popular Charting Platforms for Traders
Traders have many options for stock trading charts. Popular choices include TradingView, MetaTrader 4 and 5, and ThinkorSwim. These platforms offer free charting and free stock market charts to help traders make smart choices.
TradingView stands out with its customization options. It has 14 chart types, 20+ timeframes, 90+ drawing tools, and 100+ pre-built indicators. It also has a big, active trading community with over 100,000 community-built indicators. With stock trading charts for over 78,000 stocks, it's a favorite among traders.
Other top platforms are MetaTrader 4 and 5, and ThinkorSwim. They offer free charting and free stock market charts, plus advanced technical analysis tools. These platforms let traders access stock trading charts and market data for better investment decisions.
Some key features of these platforms include:
- Customization options
- Technical analysis tools
- Real-time market data
- Free charting and free stock market charts
These charting platforms give traders the tools and data they need to succeed. By using stock trading charts and technical analysis tools, traders can make informed decisions and reach their investment goals.
How to Read Share Trading Charts Effectively
Reading share trading charts is key for smart investment choices. It means knowing technical trading patterns and using stock chart analysis to spot trends. This way, investors can guess future price changes and make choices based on data.
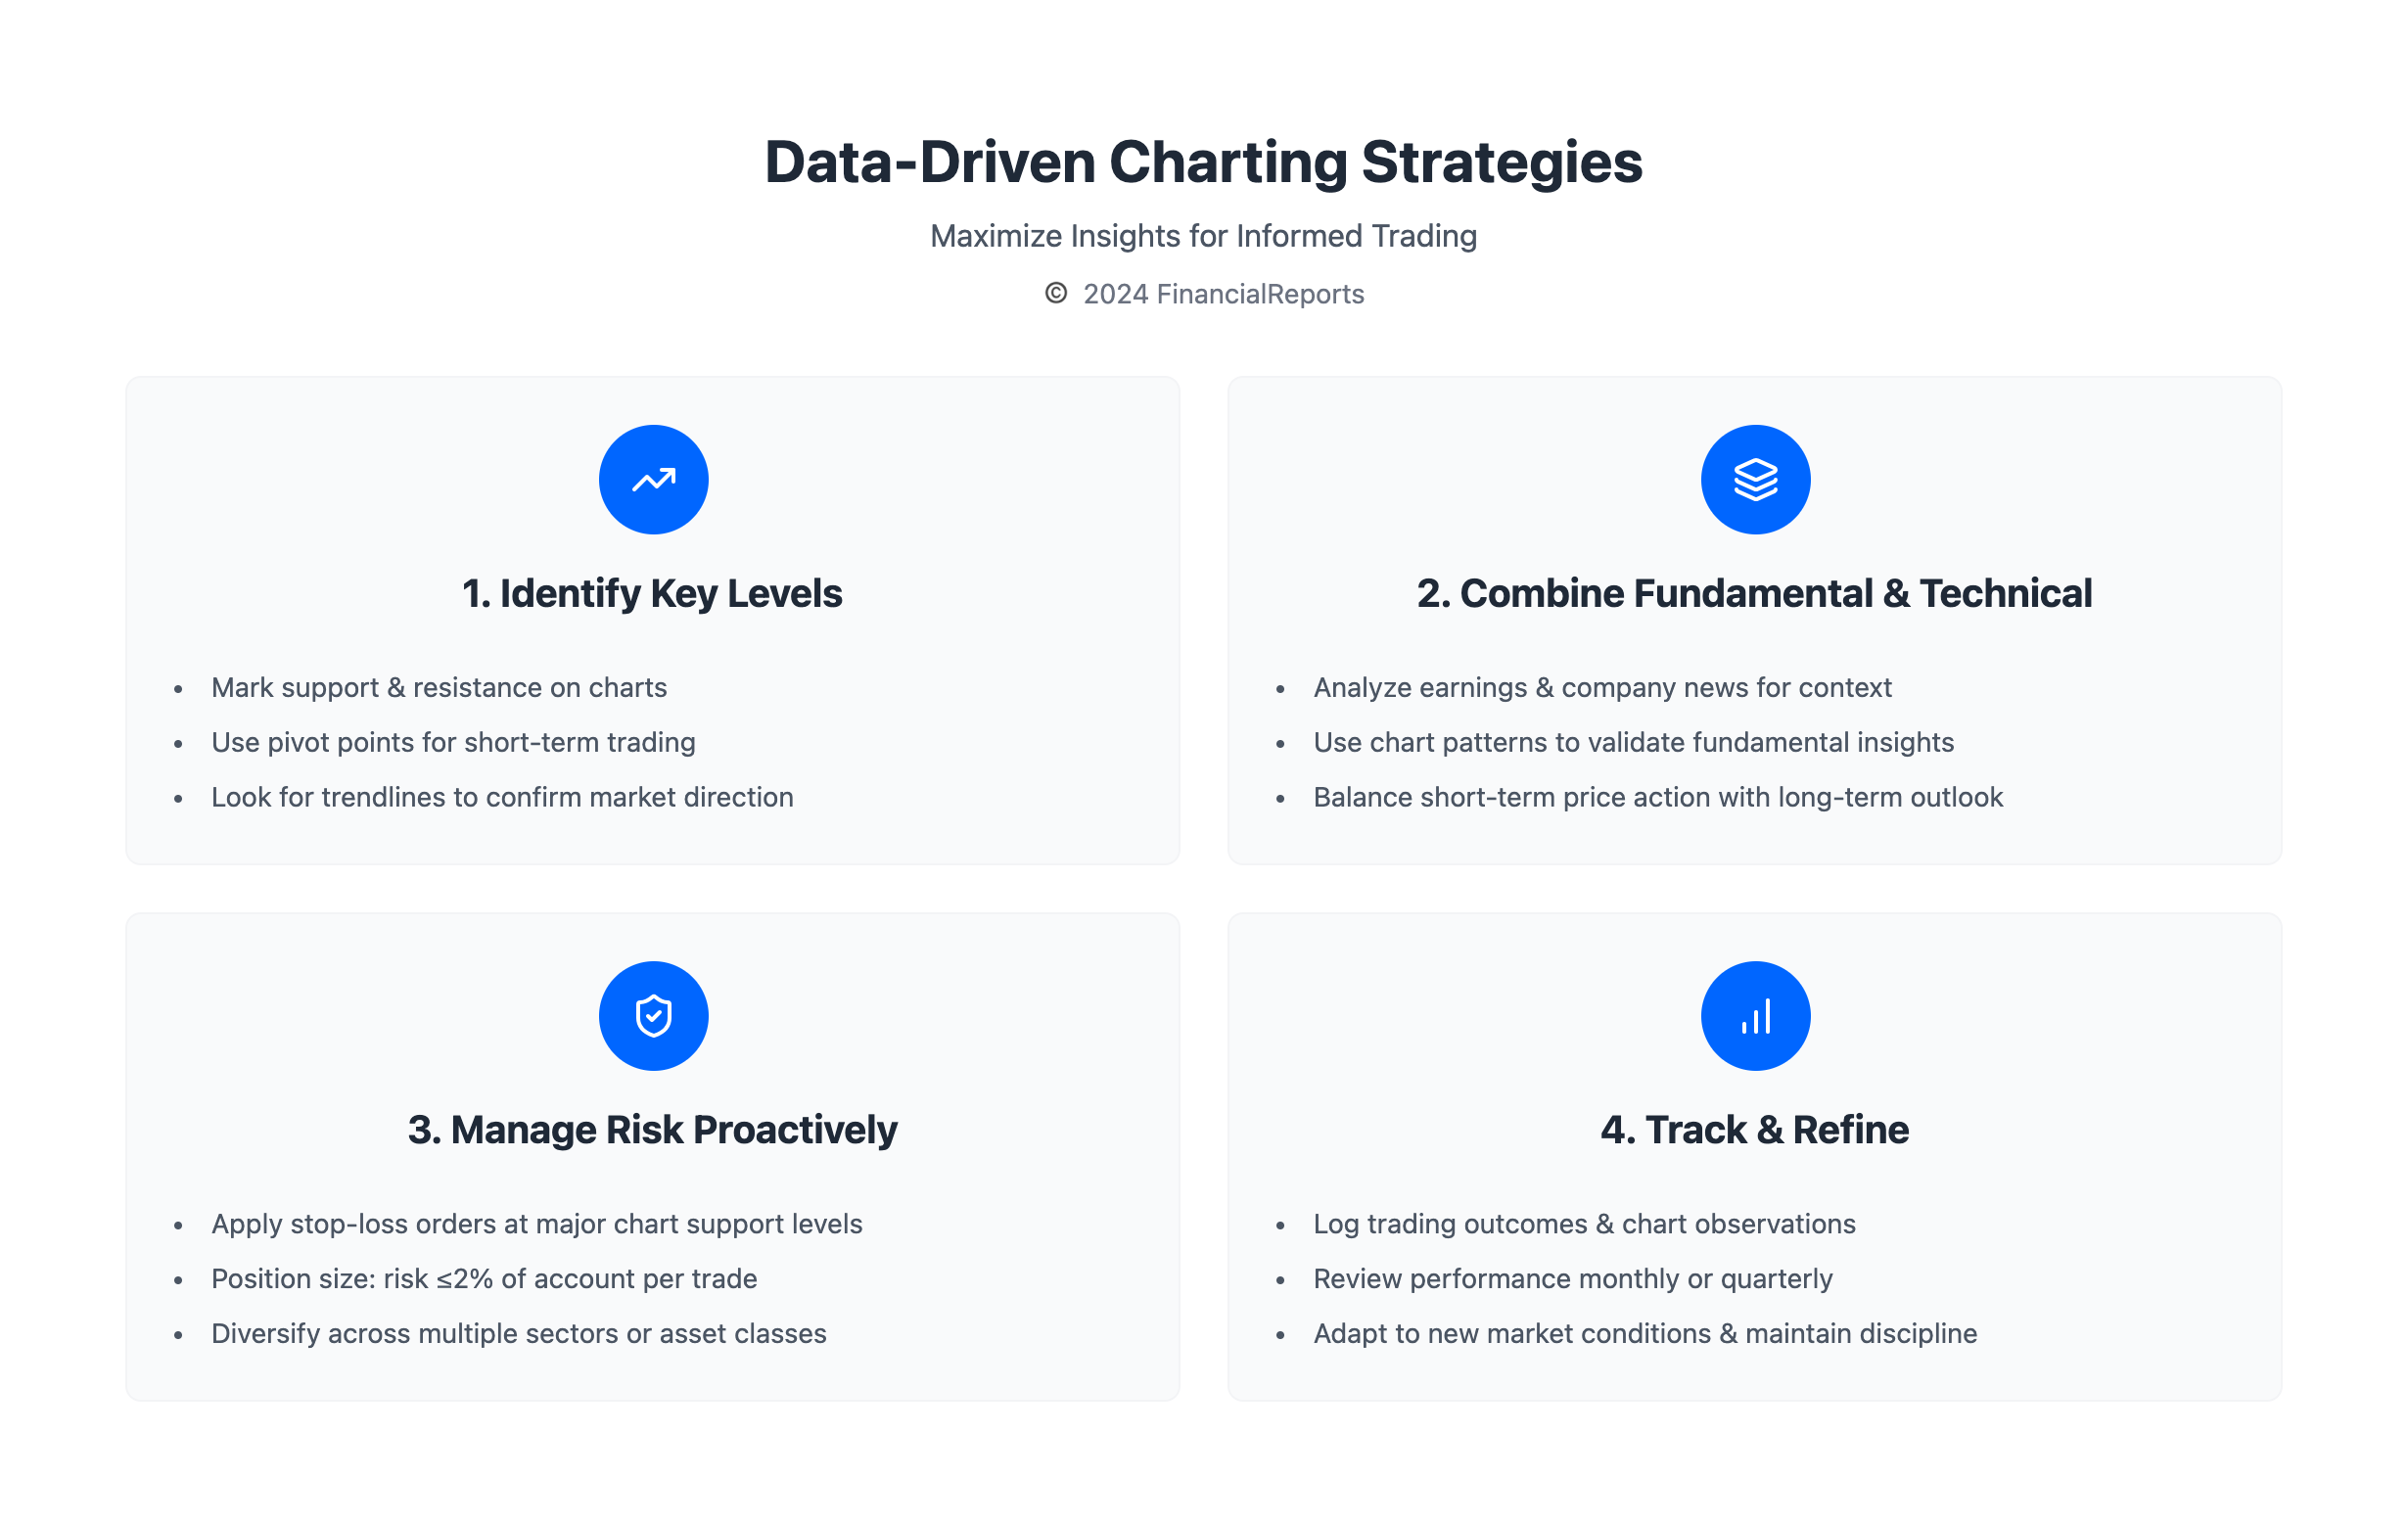
Identifying support and resistance levels is important in technical analysis graph patterns. These levels show where buying or selling might happen. This helps investors know the best times to buy or sell. Also, spotting patterns like triangles and head and shoulders helps predict price changes.
To read share trading charts well, investors should:
- Know different chart types, like candlestick, bar, and line charts
- Recognize technical trading patterns, such as trends and reversals
- Use tools, like moving averages and RSI, to back up trading choices
By getting good at stock chart analysis and technical analysis graph patterns, investors can get ahead in the market. It's vital to keep up with market trends and keep improving your chart-reading skills for success in share trading.
Integrating Fundamental Analysis with Charts
Combining fundamental and technical analysis gives a full view of the market. Fundamental analysis looks at a company's true value, not just its price. It checks earnings, dividends, growth, and financial health. Technical analysis, on the other hand, uses past data and price trends to forecast future stock movements.
Stock charting free tools help spot trends and patterns. Technical analysis charts show market mood, like when volume drops suddenly. Free trading charts offer live data and filters, making market analysis easier.
Some key benefits of mixing both analyses are:
- Mitigating each method's weaknesses
- Gaining a holistic view of stock's true worth
- Predicting short-term and long-term stock movements
By blending insights from both, investors can make better choices. It's key to use tools with dashboards, filters, live data, and alerts. This makes combining analysis easier.
| Analysis Type | Description |
|---|---|
| Fundamental Analysis | Looks at a company's true value, beyond its price |
| Technical Analysis | Uses past data and trends to forecast future stock moves |
Advantages of Using Advanced Charting Tools
Advanced charting tools bring many benefits to traders. They offer better charting, access to past data, and alerts. These tools can boost trading success, cut down on risks, and make trading more efficient. For example, a stock market chart helps spot trends and patterns, aiding in better decision-making.
Some key benefits of these tools include:
- They make market data easier to see, helping traders spot trends and patterns quickly.
- They give access to past data, letting traders study past market moves and predict better.
- They send out alerts and notifications, keeping traders up-to-date on market changes and opportunities.
By using tools like trading graphs and charts for share trading, traders can get ahead in the market. These tools offer deep insights into market movements. They help traders make smarter choices and enhance their trading results.
| Charting Tool | Advantage |
|---|---|
| Trading Graph | Enhanced visualization of market data |
| Stock Market Chart | Access to historical data |
| Charts for Share Trading | Automated alerts and notifications |
Strategies for Using Charts in Trading
Trading charts are key for investors to follow price changes and make smart choices. Knowing how to read these charts is vital. It helps spot trends, make timely trades, and manage risks. By using stock market graphs and charts, traders can craft effective strategies.
Day traders might focus on trendlines and volume indicators. Swing or position traders often look at chart patterns and technical indicators. Technical analysis studies historical data like price and volume to forecast future price movements. Combining this with fundamental analysis helps traders make better choices.
Here are some key strategies for using charts in trading:
- Identify trends and patterns using trading charts and technical indicators
- Use volume indicators to confirm trends and predict price movements
- Develop a trading plan and stick to it, using stock market graphs to track progress
By adopting these strategies and using the right tools, traders can boost their success in the market. Whether they focus on day trading, swing trading, or long-term investments, trading charts and stock market graphs and charts are critical for making informed decisions and reaching trading goals.
| Strategy | Description |
|---|---|
| Day Trading | Using trendlines and volume indicators to make short-term trades |
| Swing Trading | Using chart patterns and technical indicators to make medium-term trades |
| Long-Term Investment | Using fundamental analysis and technical indicators to make long-term investment decisions |
The Future of Share Trading Charts
The world of finance is always changing, and share trading charts are no exception. New technologies, like AlphaSense's generative AI tools, are set to change how we analyze markets. These AI tools use over a decade of tech to give traders sharp insights and predictions.
Artificial intelligence and machine learning will soon be part of charting platforms. This means traders can find deeper insights and make better choices. As these techs get better, understanding complex patterns will become easier, helping traders make more confident decisions.
Also, data visualization for traders is getting better. Interactive dashboards and customizable charts will help traders stay ahead. These tools will let traders predict market changes and find new opportunities. With these advancements, share trading charts will become more powerful and useful for investors.
FAQ
What are share trading charts?
Share trading charts show how stock prices change over time. They help traders and investors spot trends and patterns. This information aids in making smart investment choices.
How do charts enhance decision-making in share trading?
Charts give traders valuable insights into market behavior. They help identify trends and support levels. This knowledge helps traders decide when to buy, sell, or hold.
What is the role of technical analysis in share trading?
Technical analysis studies past market data to find patterns. It helps traders understand market psychology. This knowledge guides their trading decisions.
What are the different types of charts used in share trading?
Common charts include line, bar, candlestick, and area charts. Each type shows different market patterns and trends.
What key features should I look for in a trading chart?
Look for real-time data, customization options, and technical indicators. These features help traders make better decisions.
What are some popular charting platforms for traders?
Popular platforms are TradingView, MetaTrader 4 and 5, and ThinkorSwim. Each offers unique features. Choose based on your trading needs.
How can I effectively read and interpret share trading charts?
Learn to spot trends and patterns. Use volume indicators too. Understanding charts well can improve trading performance.
How can I integrate fundamental analysis with chart analysis?
Combine market data with chart analysis for a full view. Consider earnings reports and economic indicators. This helps understand stock price movements better.
What are the advantages of using advanced charting tools?
Advanced tools offer better charting, historical data, and alerts. They help traders perform better, reduce risk, and work more efficiently.
What strategies can I use when incorporating charts into my trading approach?
Use day trading, swing trading, or long-term strategies. Choose based on your goals, risk tolerance, and market conditions.
How will share trading charts evolve in the future?
Future charts will be shaped by new technologies like AI and machine learning. These advancements will make charts more powerful for traders.