Things that go on an income statement - Understanding income statement components
What is an income statement in accounting
An income statement, also known as a profit and loss statement, is a crucial financial document that provides a snapshot of a company's financial performance over a specific period. In accounting, it serves as one of the primary financial statements used to assess a business's profitability and overall financial health.
The primary purpose of an income statement is to demonstrate whether a company has generated a profit or incurred a loss during the reporting period. It achieves this by presenting a detailed breakdown of revenues, expenses, gains, and losses. This information is vital for various stakeholders, including investors, creditors, and management, to make informed decisions about the company's financial standing and future prospects.
Key elements that define an income statement in accounting include:
-
A comprehensive summary of revenues and expenses over a specific time frame (typically a quarter or a year)
-
Calculation of gross profit, operating income, and net income
-
Presentation of both operating and non-operating activities
-
Compliance with Generally Accepted Accounting Principles (GAAP) or International Financial Reporting Standards (IFRS)
By providing a structured view of a company's financial performance, the income statement plays a pivotal role in financial analysis, investment decisions, and strategic planning.
Key components of an income statement
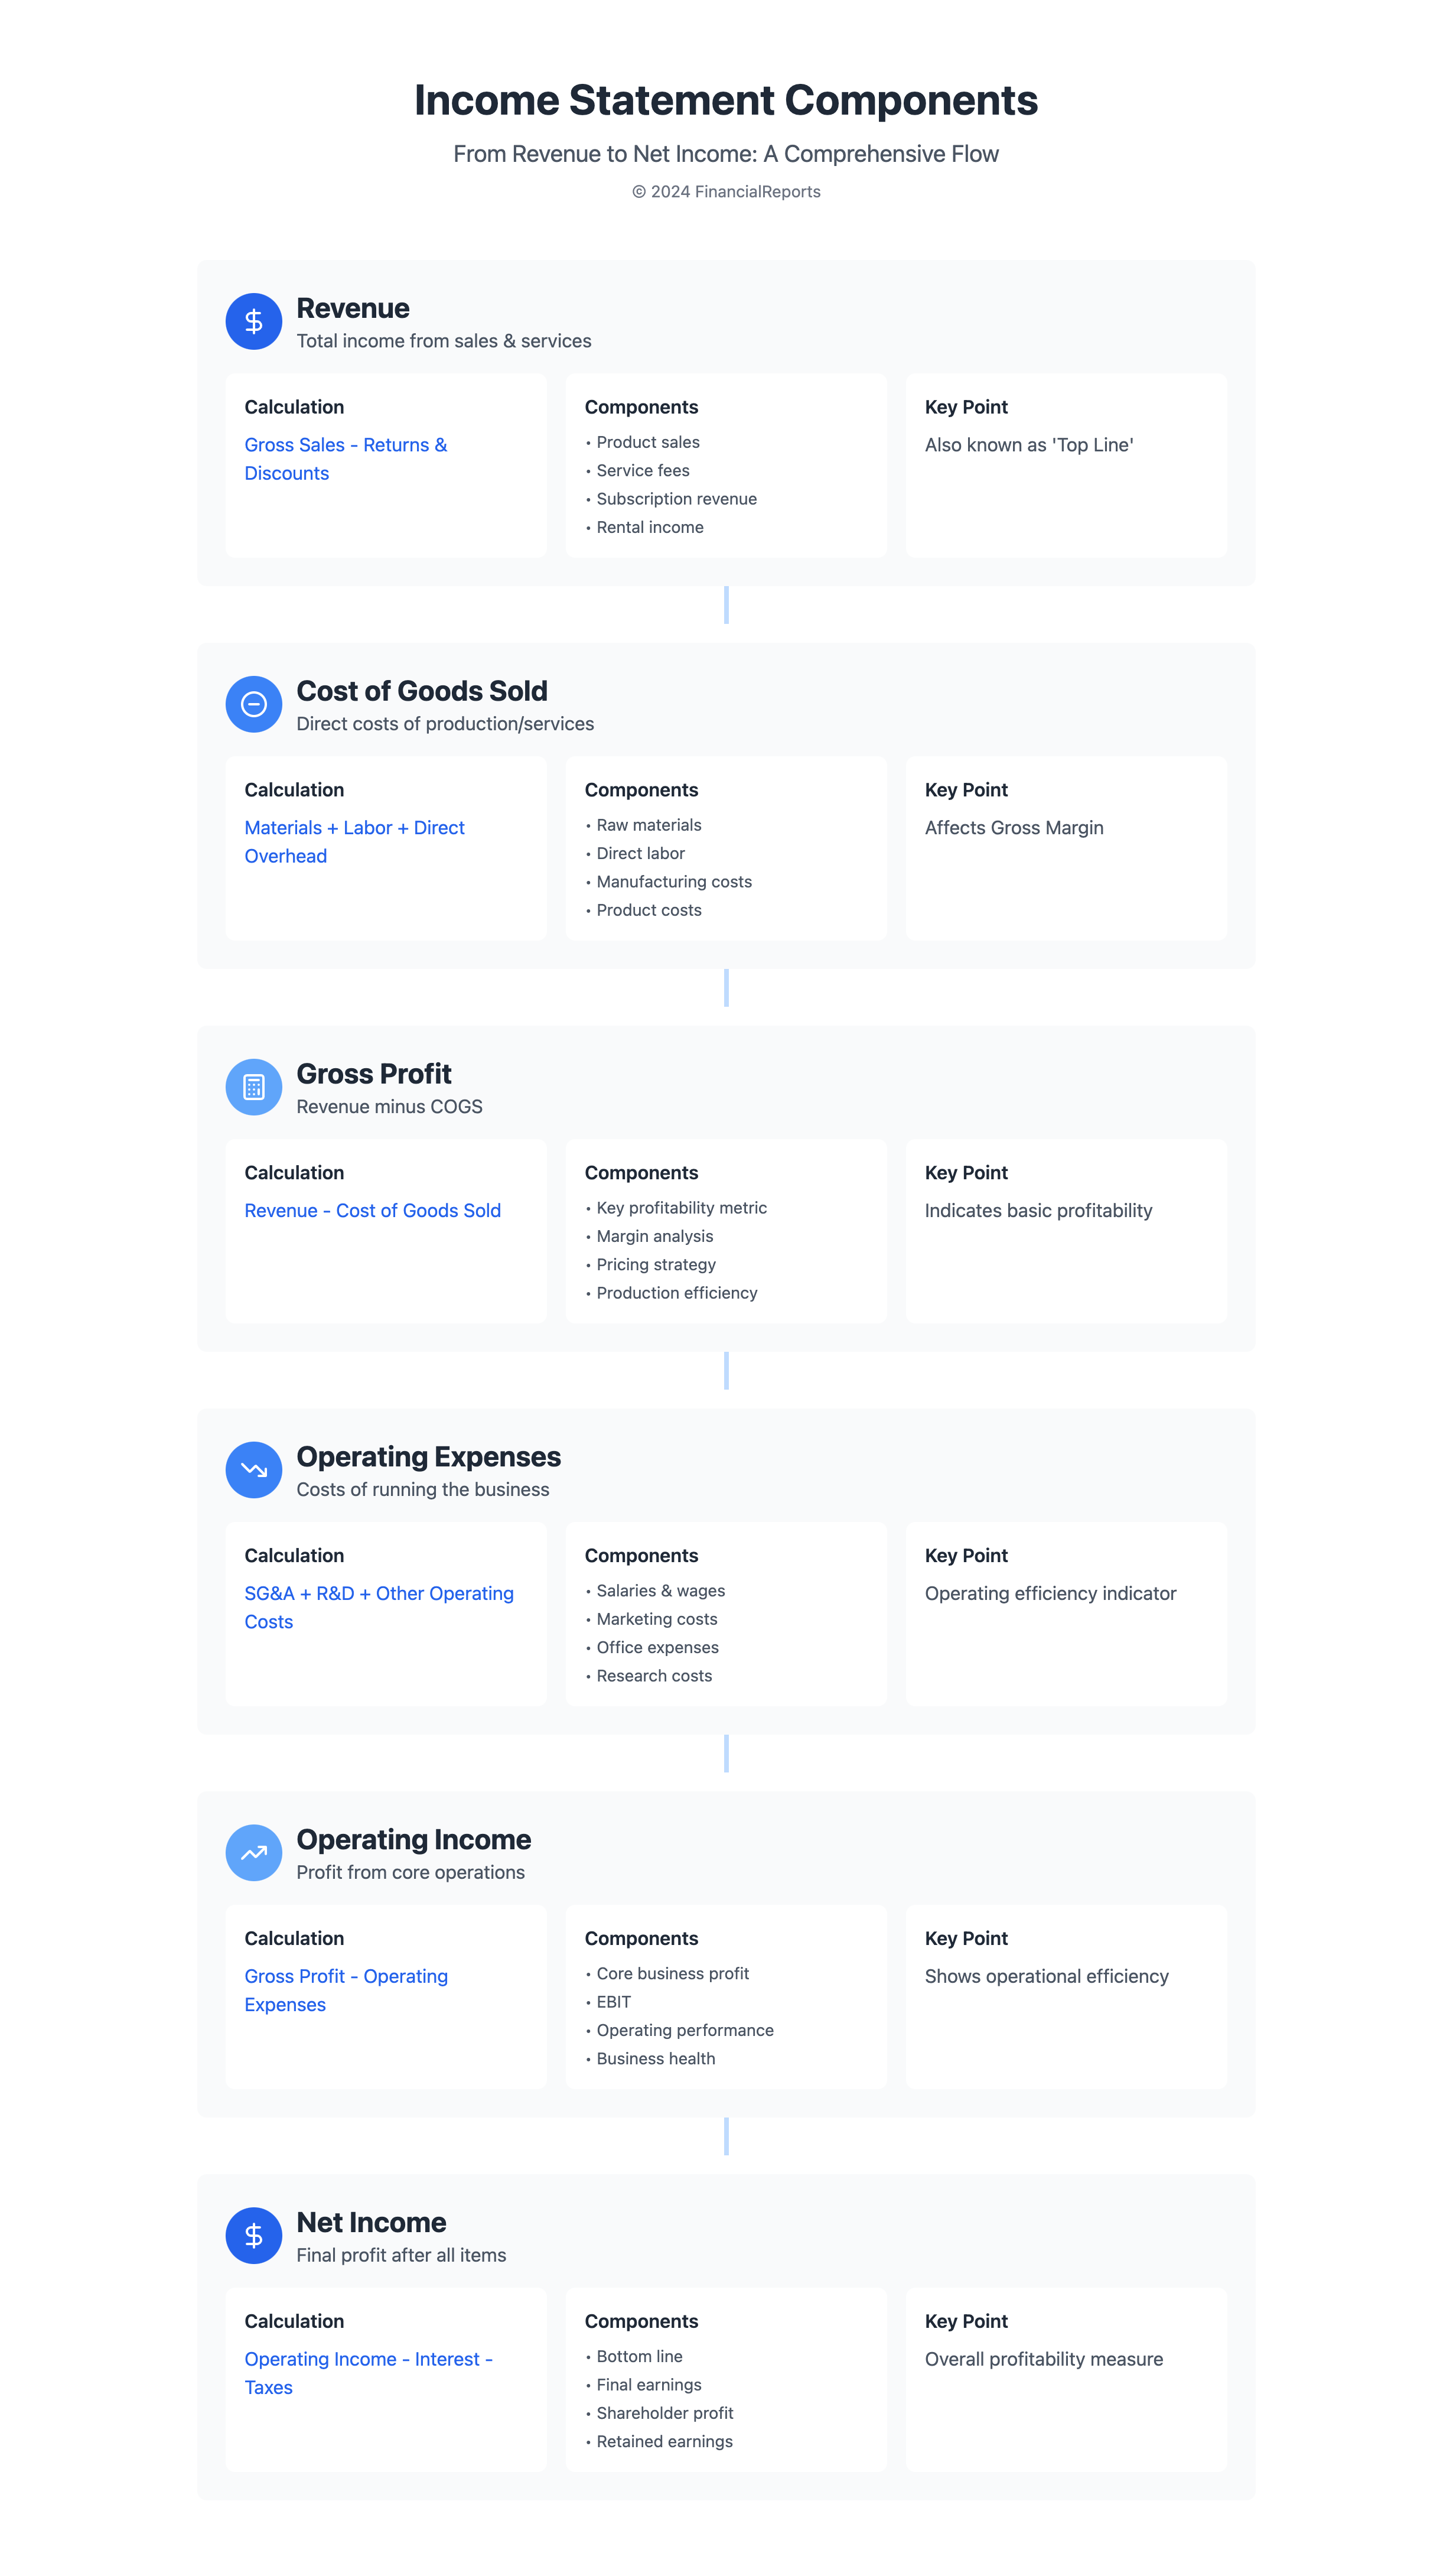
Building upon the foundation of understanding what an income statement is, it's crucial to delve into its key components. These elements work in concert to provide a comprehensive picture of a business's profitability and operational efficiency. The main parts of an income statement include:
-
Revenue: This represents the total amount of money earned from the company's primary business activities during the reporting period. Often referred to as the "top line," it serves as the starting point for all subsequent calculations.
-
Cost of Goods Sold (COGS): COGS encompasses the direct costs associated with producing the goods or services sold by the company. This includes raw materials, direct labor, and manufacturing overhead.
-
Gross Profit: Calculated by subtracting COGS from revenue, gross profit indicates how efficiently a company produces and sells its products or services.
-
Operating Expenses: These are the costs incurred in the normal course of business operations, such as salaries, rent, utilities, and marketing expenses. They are typically categorized into selling, general, and administrative (SG&A) expenses.
-
Operating Income: Also known as earnings before interest and taxes (EBIT), this figure is derived by subtracting operating expenses from gross profit. It represents the profit generated from core business operations.
-
Non-Operating Income and Expenses: This category includes income or costs not directly related to the company's core business operations, such as interest income, interest expenses, or gains/losses from asset sales.
-
Net Income: The "bottom line" of the income statement, net income represents the company's total profit or loss for the period after all revenues, expenses, gains, and losses are accounted for.

Additional elements of income statements that provide further insights include:
-
Depreciation and Amortization: Non-cash expenses that allocate the cost of assets over their useful life.
-
Income Tax Expense: The amount of taxes owed based on the company's taxable income.
-
Earnings Per Share (EPS): For public companies, this metric shows profitability on a per-share basis.
These income statement components work in tandem to offer a detailed view of a company's financial performance. By analyzing trends in these elements over time, stakeholders can gain valuable insights into the company's profitability, efficiency, and overall financial health.
Revenue and income on the income statement
Having examined the key components of an income statement, it's essential to focus on the revenue and income section, which forms the foundation of a company's financial performance. This section typically distinguishes between two main categories: operating revenue and non-operating revenue.
Operating Revenue
Operating revenue represents the income generated from a company's primary business activities. It is the lifeblood of any business and usually constitutes the largest portion of total revenue. Examples of operating revenue include:
-
Sales of goods for retailers and manufacturers
-
Service fees for service-based companies
-
Subscription revenue for software-as-a-service (SaaS) businesses
-
Advertising revenue for media companies
Operating revenue is a key indicator of a company's core business performance and market demand for its products or services.
Non-Operating Revenue
Non-operating revenue refers to income earned from activities outside a company's main operations. While typically smaller than operating revenue, it can provide valuable insights into a company's financial management and diversification strategies. Common sources of non-operating revenue include:
-
Interest earned on investments or bank deposits
-
Rental income from company-owned property
-
Gains from the sale of assets
-
Royalty payments from licensing agreements
-
Dividend income from investments in other companies
Understanding the distinction between operating and non-operating revenue is crucial for assessing a company's core business strength and its ability to generate additional income streams.
Key income statement accounts related to revenue and income include:
-
Gross Sales: Total amount of all sales before deductions
-
Net Sales: Gross sales minus returns, allowances, and discounts
-
Other Income: Non-operating revenue and gains
-
Total Revenue: The sum of all revenue sources
By analyzing these components, investors and analysts can gain a comprehensive understanding of a company's revenue generation capabilities and overall financial health.
Expenses in the income statement
While revenue provides insight into a company's income-generating capabilities, expenses play an equally crucial role in determining profitability. The expenses section of an income statement provides crucial information about a company's costs and financial performance. Understanding the various types of expenses and how they impact profitability is essential for comprehensive financial analysis. The main categories of expenses in the income statement include:
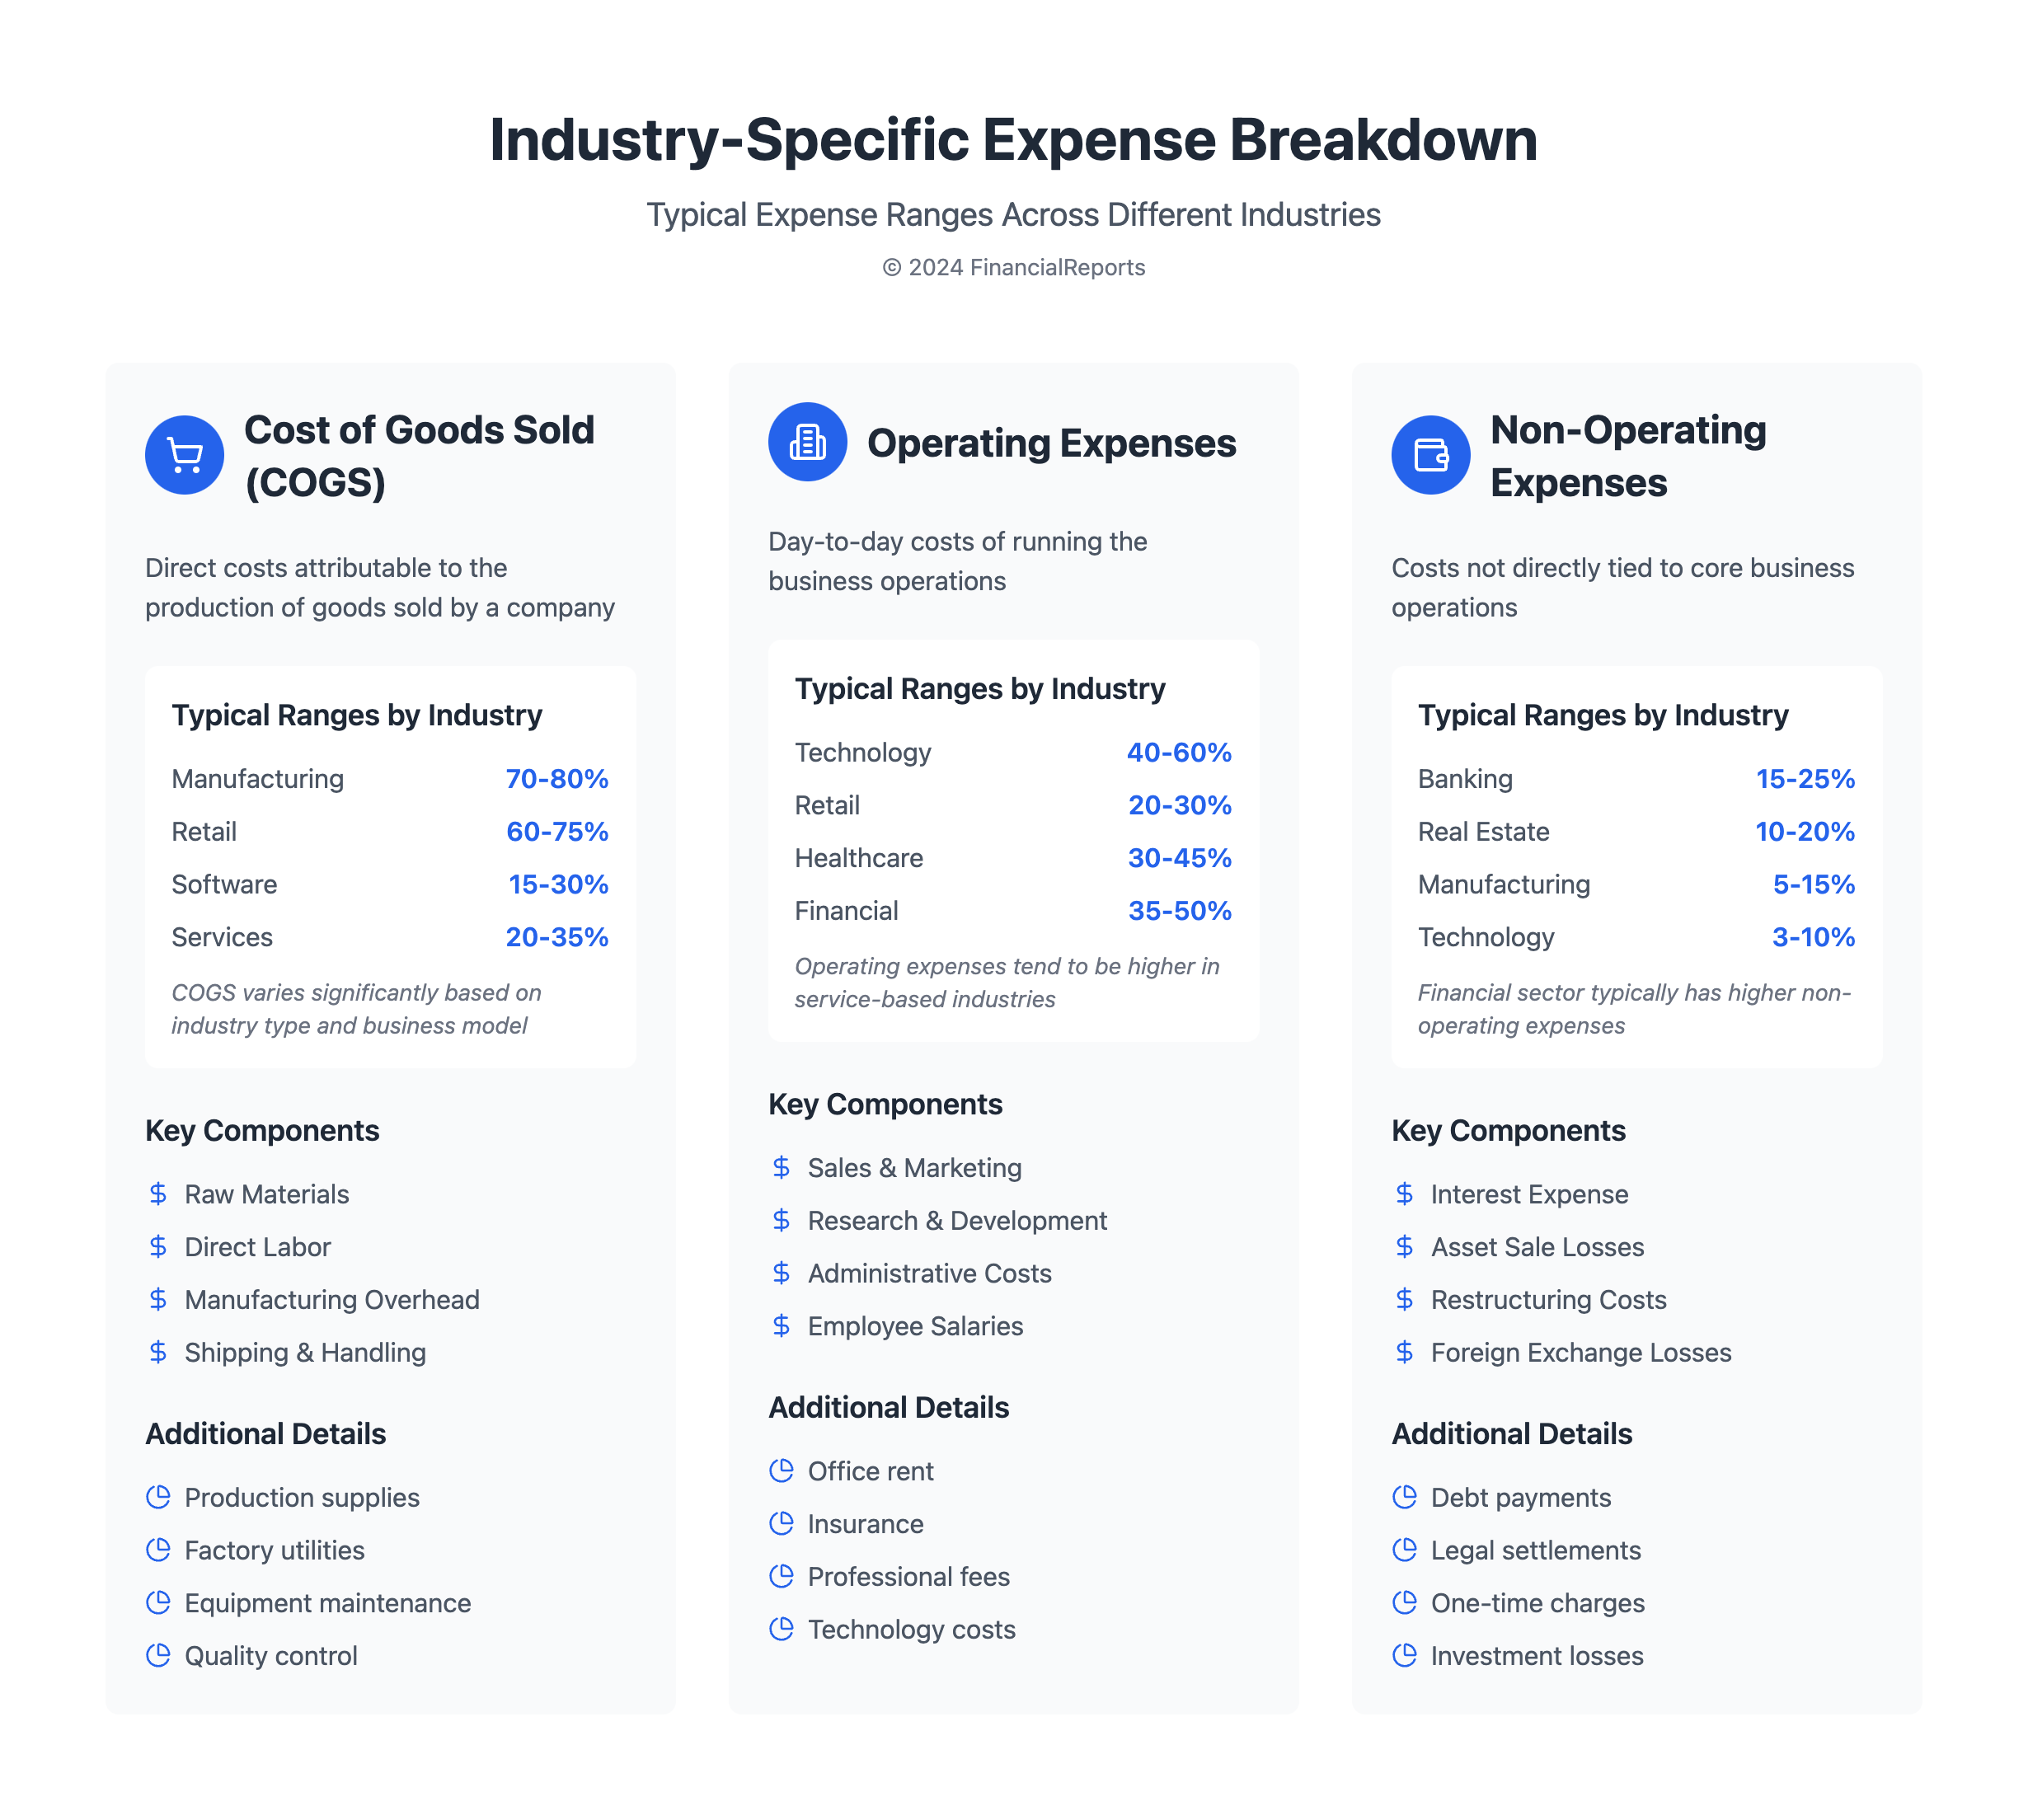
Cost of Goods Sold (COGS)
COGS represents the direct costs associated with producing the goods or services a company sells. This typically includes:
-
Raw materials
-
Direct labor costs
-
Manufacturing overhead
-
Shipping and handling
For retailers and manufacturers, COGS is often the largest expense item and significantly impacts gross profit. It's crucial for assessing production efficiency and pricing strategies.
Operating Expenses
Operating expenses are the costs incurred in the normal course of business operations that are not directly tied to production. Common operating expenses include:
-
Selling, general, and administrative expenses (SG&A)
-
Research and development (R&D)
-
Marketing and advertising
-
Rent and utilities
-
Salaries and wages for non-production staff
-
Depreciation and amortization
These expenses are typically grouped into functional categories on the income statement to provide insight into how the company allocates its resources.
Non-Operating Expenses
While not part of core operations, non-operating expenses also appear on the income statement. These may include:
-
Interest expense on debt
-
Losses on asset sales
-
Restructuring costs
-
Foreign exchange losses
Analyzing expenses in the income statement allows investors and managers to assess a company's cost structure and operational efficiency. Key considerations include:
-
Expense ratios: Comparing expenses to revenue over time
-
Gross margin: The difference between revenue and COGS
-
Operating margin: Operating income as a percentage of revenue
-
Expense trends: Identifying areas of increasing or decreasing costs
By carefully examining these expense categories, companies can identify areas for cost reduction, improve profitability, and make informed strategic decisions about resource allocation.
Calculating profit on the income statement
With a clear understanding of revenue and expenses, we can now focus on how these elements come together to calculate profit. The income statement provides a detailed breakdown of a company's profitability through several key profit calculations. Understanding these profit figures is essential for assessing a company's financial performance and operational efficiency.
Gross Profit
Gross profit is calculated by subtracting the cost of goods sold (COGS) from total revenue. The formula is:
Gross Profit = Revenue - Cost of Goods Sold
This figure represents the profit a company makes from its core business operations before accounting for other expenses. Gross profit is crucial for assessing how efficiently a company can produce and sell its products or services.
Operating Income
Operating income, also known as operating profit or earnings before interest and taxes (EBIT), is calculated by subtracting operating expenses from gross profit:
Operating Income = Gross Profit - Operating Expenses
This metric provides insight into a company's ability to generate profit from its core business activities, excluding the effects of financing and taxes.
Net Income
Net income, often referred to as the "bottom line," represents the final profit figure after all expenses, including taxes and interest, have been deducted from revenue. The formula is:
Net Income = Operating Income - Interest Expenses - Taxes - Other Expenses
Net income is a crucial measure of a company's overall profitability and financial performance.
Profit Margins
To gain further insights into a company's profitability, analysts often calculate profit margins:
-
Gross Profit Margin = (Gross Profit / Revenue) x 100%
-
Operating Profit Margin = (Operating Income / Revenue) x 100%
-
Net Profit Margin = (Net Income / Revenue) x 100%
These margin calculations allow for easier comparison of profitability across different companies and industries, regardless of their size. By analyzing these profit figures and margins, investors and managers can assess a company's financial health, operational efficiency, and competitive position within its industry.
Income statement format and structure
Having explored the components and calculations within an income statement, it's important to understand how these elements are organized and presented. The income statement follows a standard format that presents a company's financial performance over a specific period. Understanding this structure is crucial for effective financial analysis and interpretation. A typical income statement format includes the following elements:
-
Header: Contains essential information such as the company name, document title (e.g., "Income Statement"), and time period covered (e.g., "For the Year Ended December 31, 2023").
-
Revenue Section: Details the company's income sources, including net sales or revenue and other operating revenues (if applicable).
-
Cost of Goods Sold (COGS): Represents the direct costs associated with producing goods or services sold.
-
Gross Profit: Calculated as Revenue minus COGS.
-
Operating Expenses: Lists various line items related to operating costs, such as:
-
Selling, General, and Administrative expenses (SG&A)
-
Research and Development (R&D)
-
Depreciation and Amortization
-
Other operating expenses
-
-
Operating Income: Also known as Earnings Before Interest and Taxes (EBIT), calculated as Gross Profit minus Operating Expenses.
-
Non-Operating Items: Includes interest income and expense, gains or losses from investments, and other non-operating income or expenses.
-
Income Before Taxes: The sum of Operating Income and Non-Operating Items.
-
Income Tax Expense: The amount of taxes owed based on the company's taxable income.
-
Net Income: The final profit or loss after all revenues, expenses, gains, and losses are accounted for.
Some income statement formats may also include additional elements such as Earnings Per Share (EPS) for public companies or Comprehensive Income, which includes items like foreign currency translation adjustments.
Understanding this standard income statement format is essential for financial analysis, as it provides a structured view of a company's profitability and operational efficiency over time. For a more detailed example of an income statement format, you can refer to the Interim Financial Report from GRAMMER AG, which provides a comprehensive sample of an income statement structure.
Analyzing and interpreting the income statement
With a solid grasp of the income statement's components and structure, we can now focus on how to effectively analyze and interpret this crucial financial document. Analyzing and interpreting the income statement is crucial for understanding a company's financial performance and making informed business decisions. The income statement shows a comprehensive view of revenues, expenses, and profitability over a specific period. To effectively analyze an income statement, consider the following approaches:
Key components to analyze
-
Revenue trends: Examine growth or decline in sales over time
-
Gross profit margin: Calculate the percentage of revenue remaining after cost of goods sold
-
Operating expenses: Assess efficiency in managing costs
-
Operating income: Evaluate core business profitability
-
Net income: Determine overall profitability after all expenses
Analysis techniques
1. Vertical analysis: Express each line item as a percentage of revenue, allowing for easy comparison across periods and companies.
2. Horizontal analysis: Compare financial data over multiple periods to identify trends and growth patterns.
3. Ratio analysis: Calculate important ratios such as profit margins, return on sales (ROS), operating expense ratio, and earnings per share (EPS).
Purpose of income statement analysis
Thorough analysis of the income statement serves multiple purposes:
-
Assessing overall financial health and profitability
-
Identifying areas for cost reduction or efficiency improvements
-
Evaluating management's effectiveness in generating returns
-
Comparing performance against competitors and industry benchmarks
-
Forecasting future financial performance
-
Supporting investment and financing decisions
By mastering the art of analyzing and interpreting income statements, financial professionals can extract meaningful insights to drive strategic decision-making and improve overall business performance. This process enables stakeholders to gain a deeper understanding of a company's financial position, identify potential areas of concern, and capitalize on opportunities for growth and improvement.
For a practical example of how income statement analysis can be applied, you may want to review the Quarterly Statement from Masterflex SE, which demonstrates how companies present and analyze their financial performance over time.