PE vs Forward PE: Understanding the Differences
The forward P/E ratio is key in financial analysis. It shows a company's future performance. The forward P/E uses future earnings, while the trailing P/E uses past earnings. This difference is important for investors.
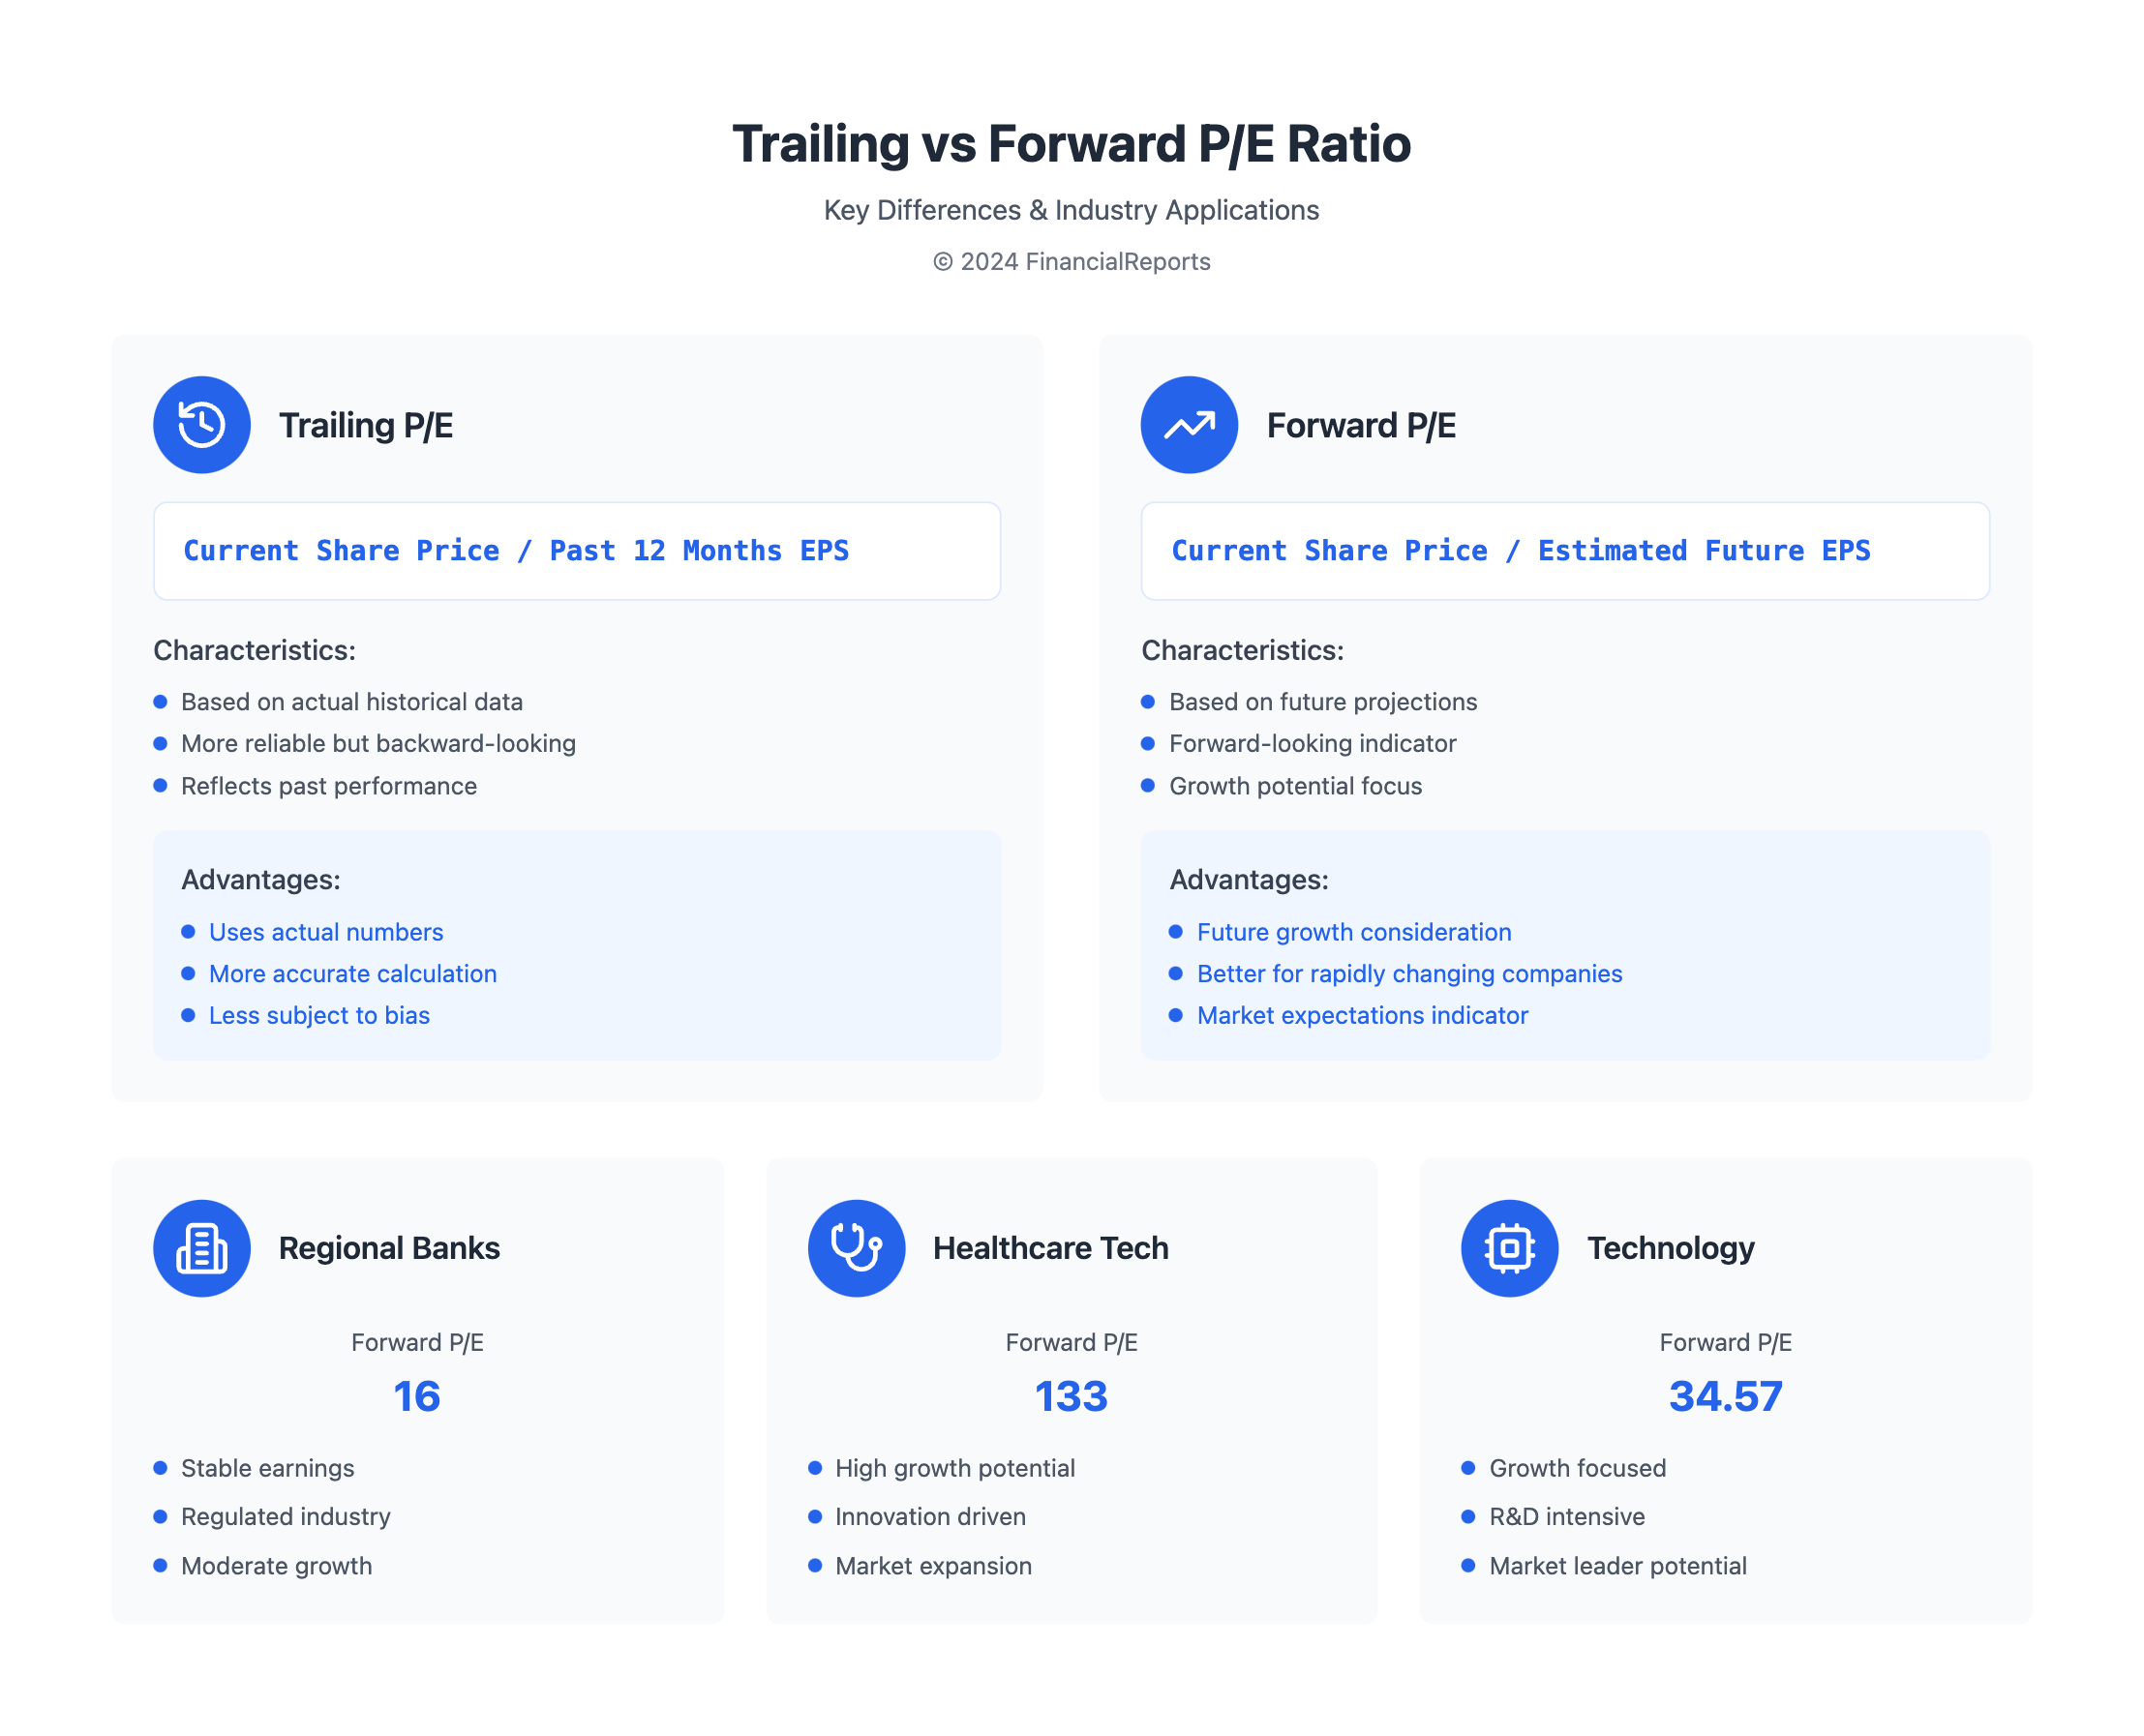
The forward pe ratio is based on current share price and future earnings per share. It helps investors see a company's growth. For example, regional banks have a forward P/E of 16, while healthcare tech has a 133. This shows the importance of understanding the forward pe ratio for investment decisions.
Key Takeaways
- The forward P/E ratio estimates a company's likely earnings per share for the next 12 months, providing insight into future performance.
- The main difference between trailing P/E and forward P/E is that the former uses actual performance, while the latter uses estimates.
- Forward P/E ratios vary by sector due to differences in growth rates, risk profiles, and capital structures specific to each industry.
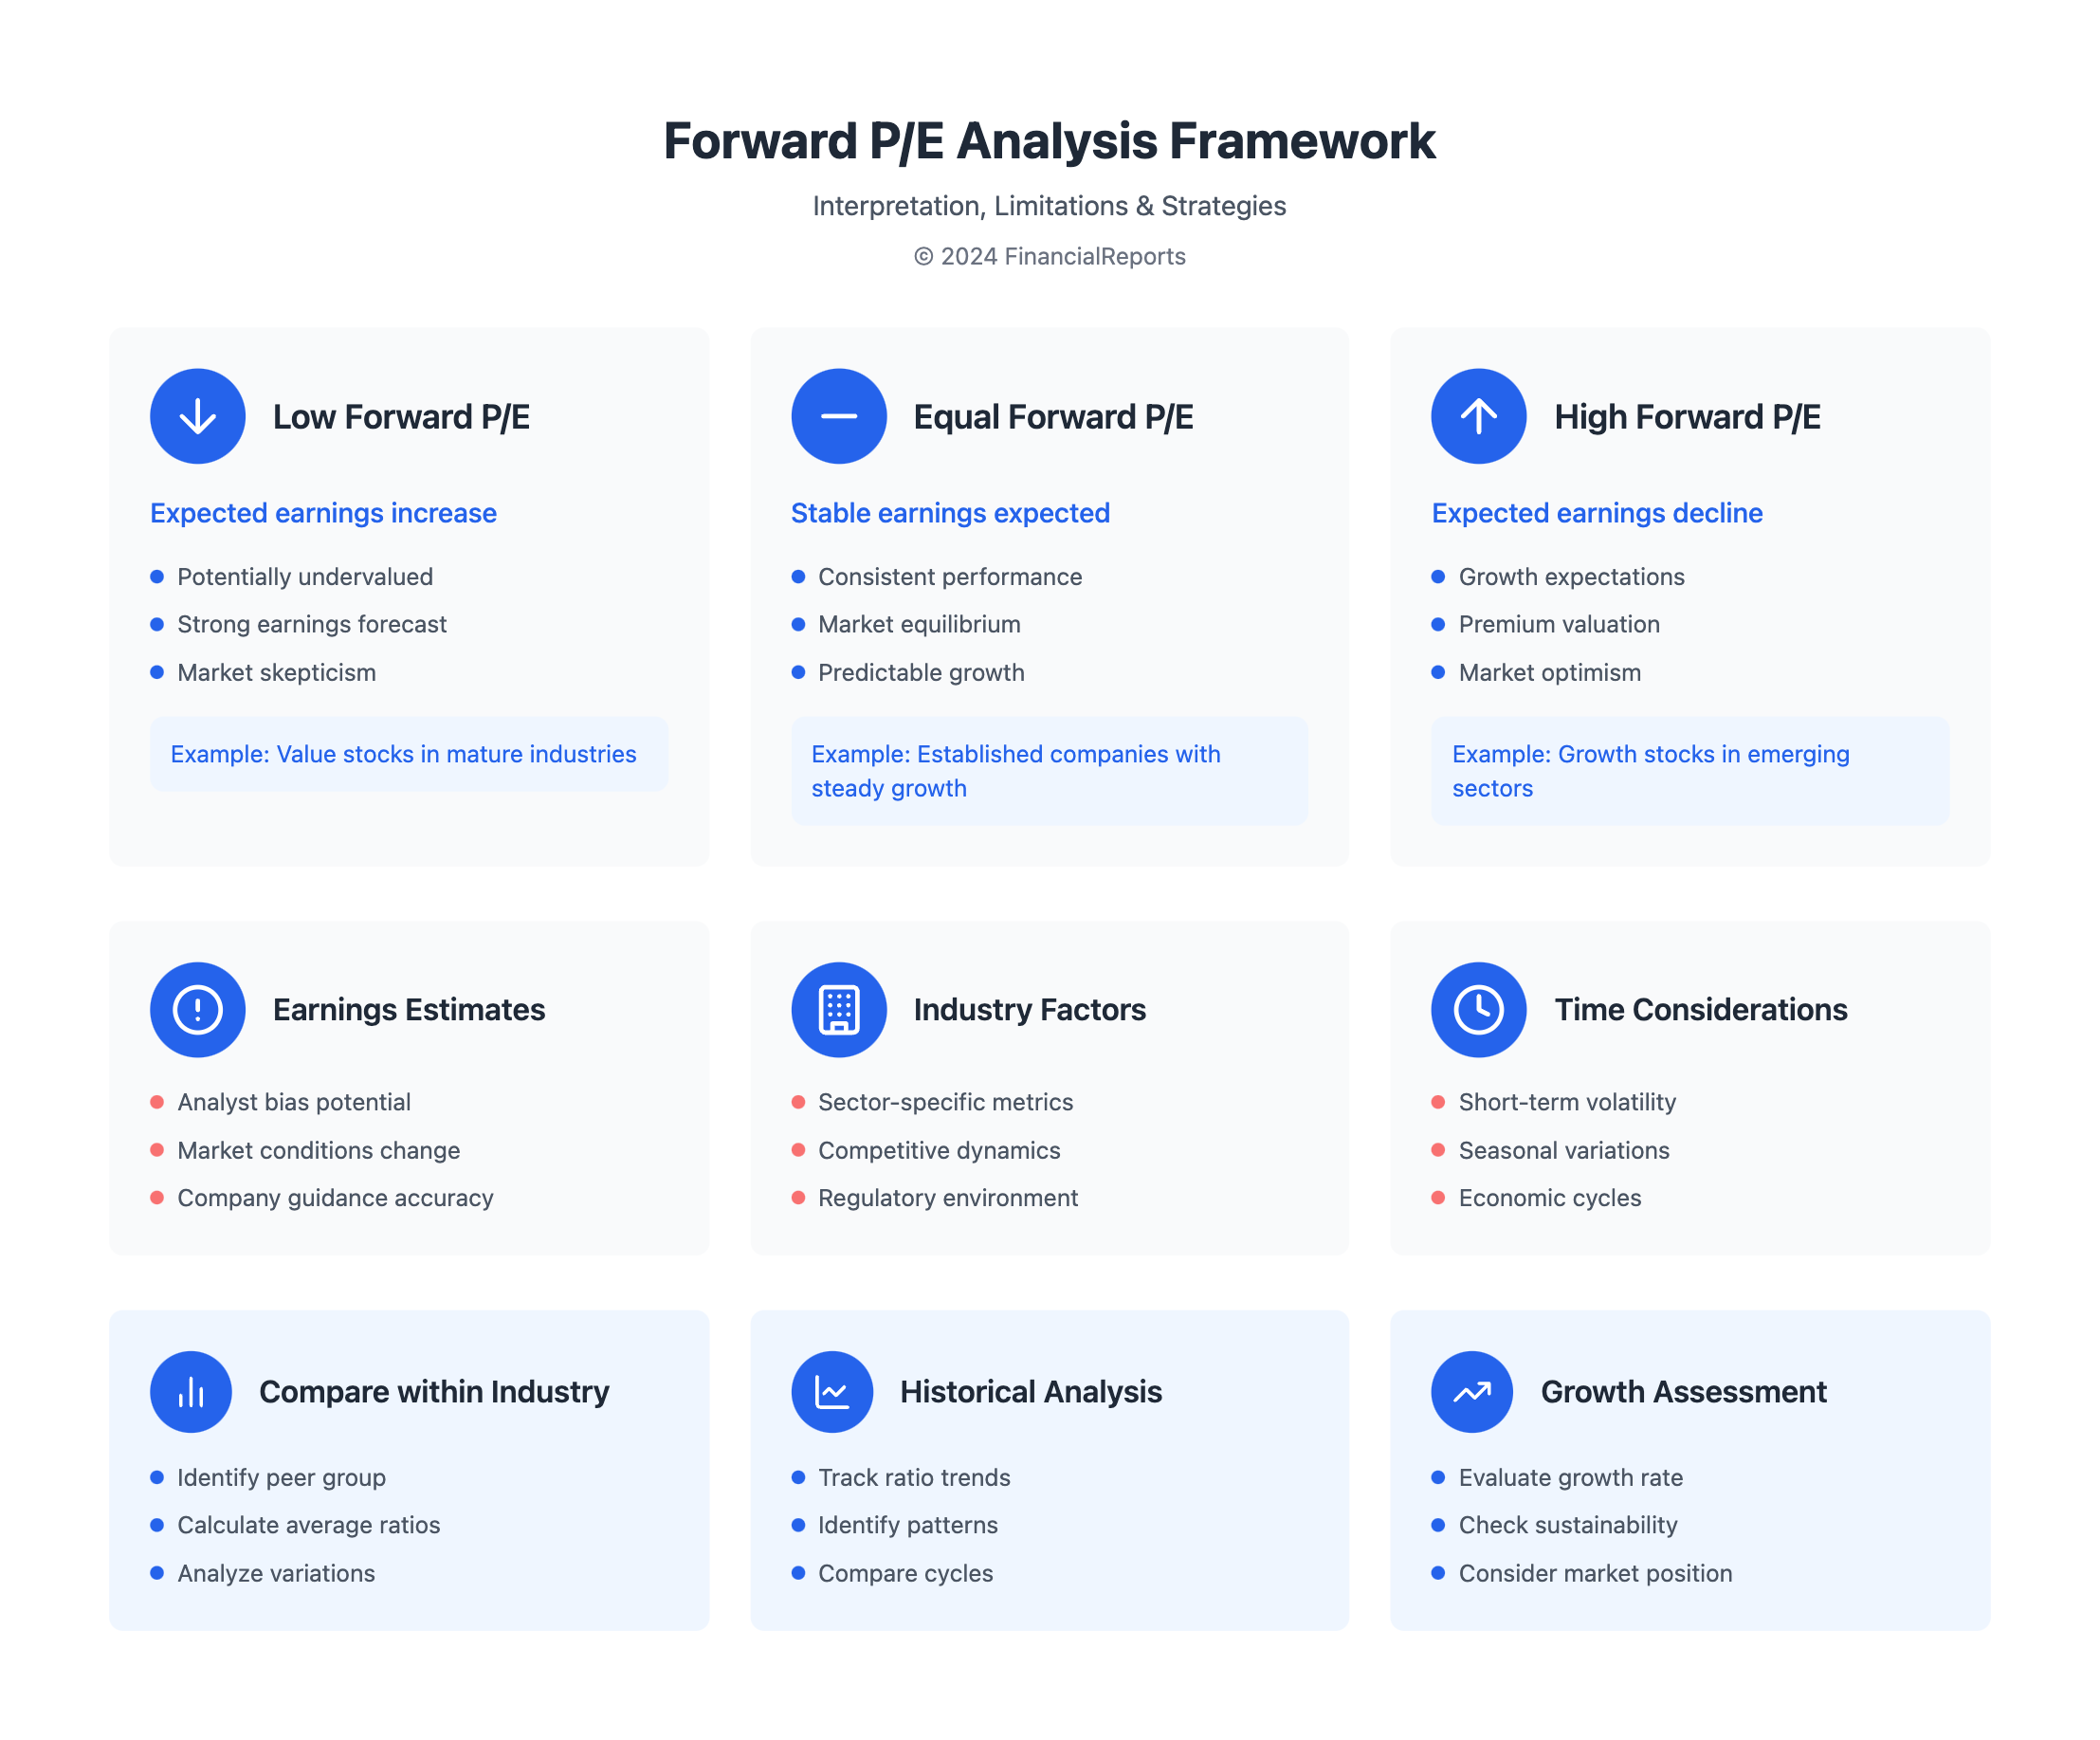
- A lower forward P/E compared to the current P/E suggests analysts expect earnings to increase, while a higher forward P/E indicates expectations of declining earnings.
- Forward P/E can be subject to miscalculation and analyst bias, potentially impacting investment decisions.
- Understanding the forward pe ratio is critical for investors, as it can significantly impact investment decisions and provide a competitive market advantage.
- The forward pe ratio is typically considered more relevant than historical P/E ratio for valuation purposes.
What is Price-to-Earnings (PE) Ratio?
The Price-to-Earnings (PE) ratio shows how much a company's stock price is compared to its earnings per share (EPS). It tells investors if a company's stock price is too high or too low. There are two types: the trailing PE uses past earnings, and the forward PE uses future estimates.
Investors use the PE ratio with other tools to make smart choices. It's key to know the difference between trailing vs forward pe ratios. The forward price to earnings ratio, for instance, looks at earnings expected in the next 12 months.
Definition and Formula
To find the PE ratio, you divide the current market value by the earnings per share. The formula for the forward p e ratio is: Forward P/E = Current share price / Estimated future earnings per share.
Importance in Investment Analysis
The PE ratio is vital in investment analysis. It helps investors see if a company's stock price is fair or not. By comparing the forward price earnings ratio of companies in the same industry, investors can spot if a stock is overpriced or not.
What is Forward Price-to-Earnings (Forward PE)?
The Forward Price-to-Earnings (Forward PE) ratio is a way to value a company. It looks at what a company might earn in the next 12 months. It's found by dividing the current share price by the expected earnings per share (EPS).
Analysts like this ratio because it focuses on what's coming next. It's different from trailing pe, which looks at what happened in the past. The trailing pe vs forward pe debate is about whether past performance predicts the future.
Definition and Calculation
To find the Forward PE ratio, you use this formula: Forward P/E = Current Share Price ÷ Forecasted EPS. For instance, if a company's share price is $30.00 and its expected EPS is $0.50, the Forward PE ratio is 60.0x.
Comparison with Trailing PE
Trailing pe uses past earnings, while Forward PE looks at future earnings. This makes Forward PE great for seeing a company's growth and future success. The forward pe multiple changes based on the company's industry, growth, and market conditions.
| Forward PE Ratio | Trailing PE Ratio |
|---|---|
| 60.0x | 20.0x |
Looking at both trailing pe and Forward PE helps investors understand a company's value and growth chances better.
Key Differences Between PE and Forward PE
The main difference between trailing P/E and forward P/E is the time frame they look at. The trailing P/E uses past earnings, dividing the current share price by the total EPS over the last 12 months. On the other hand, the forward P/E looks at future earnings estimates, showing a company's growth chance.
When looking at trailing p e vs forward p e, it's important to think about earnings estimates. Analysts might guess too high or too low on future earnings, which can skew the trailing vs forward p e ratio. The trailing pe ratio is based on real numbers, making it a better gauge of past performance.
When comparing trailing vs forward pe ratio, it's key to understand what it means for investing. A lower P/E ratio is often seen as more appealing to investors. It might suggest a company is undervalued. Here's a table that shows the main differences between trailing and forward P/E ratios:
| Ratio | Time Frame | Calculation |
|---|---|---|
| Trailing P/E | Past 12 months | Current share price / Total EPS earnings over the past 12 months |
| Forward P/E | Next 12 months | Current share price / Estimated EPS for the next 12 months |
Investors should look at both trailing p e vs forward p e ratios when deciding on investments. They give a full view of a company's past performance and future growth.
The Importance of Earnings in Valuation
Earnings are key in figuring out a company's worth. They affect how we look at pe and forward pe ratios. The trailing price to earnings ratio uses past earnings to give a fair stock value. But, the forward earnings can change, making it less steady.
Looking at a company's earnings is important. A steady earnings record builds trust with investors. But, one-time earnings can mess up pe ratios and confuse investors. The forward pe ratio compares current earnings to future ones. It's important to watch how forward earnings change.
Some key points to consider when evaluating earnings in valuation include:
- Trailing price to earnings ratio offers the most accurate valuation of a company using historical earnings per share.
- Forward pe ratio can be less reliable due to possible changes in future earnings projections.
- Consistency of earnings reports is vital for investor confidence and accurate valuation.
Understanding earnings' role in valuation helps investors make better choices. This is true when looking at pe and forward pe ratios.
Analyzing Market Trends with PE Ratios
Understanding the price-to-earnings (PE) ratio is key when analyzing market trends. The PE ratio helps figure out if a stock is overvalued or undervalued. To find the forward PE, investors need to know the forward pe definition. This is the current share price divided by the estimated future earnings per share.
Investors often wonder what is a good forward pe ratio. This ratio shows what the market expects for a company's future growth.
To figure out how to calculate forward pe, investors look at the estimated future earnings per share. This can be found in a company's forward-looking guidance. By comparing the forward PE ratio to the historical PE ratio, investors can see the market's expectations for future growth. For instance, a high forward PE ratio might mean the market expects high future earnings growth.
Some important points to think about when analyzing market trends with PE ratios include:
- Historical PE trends in major indices
- The impact of market cycles on PE ratios
- Sector-specific PE trends
By understanding these factors, investors can make better investment decisions. They can also get a clearer picture of market trends.
Evaluating Forward PE in Growth Stocks
Growth stocks are known for their high growth possibilities. They attract many investors. The forward pe ratio is key when looking at these stocks. It uses future earnings estimates, not past ones.
This helps see what earnings might be without unexpected changes. It gives a clearer view of future earnings.
Growth Stock Characteristics
Growth stocks often have high price-to-earnings ratios. This shows investors expect them to grow a lot in the future. Comparing pe vs forward pe helps figure out if a stock is overvalued or not.
A stock with a high forward p e ratio might grow more in the future. On the other hand, a stock with a low forward pe ratio might be a good deal.
Forecasting Future Performance
It's important to predict how well a growth stock will do. The forward pe ratio compares the stock price to future earnings estimates. This helps investors decide whether to buy, sell, or hold.
But, it's important to remember the forward pe ratio's limits. Earnings estimates can be wrong. So, investors should look at other metrics too.
Limitations of Forward PE in Growth Analysis
The forward pe ratio has its downsides, like wrong earnings estimates. To get a full picture, investors should look at other metrics too. This includes comparing pe vs forward pe.
By using the forward pe ratio with other metrics, investors can make better choices. This might lead to better investment results.
How to Interpret PE Ratios in Different Industries
Understanding PE ratios is key for investors to make smart choices. Industries with big growth chances often have high PE ratios. On the other hand, more mature industries might have lower PE ratios. The forward price to earnings ratio is great for comparing companies in the same field.
A company's forward price earnings ratio can be affected by many things. This includes its growth chances, industry trends, and how the market feels. When looking at a company's forward p e ratio, it's important to check the industry standards. This helps figure out if the company is priced too high or too low.
Industry Norms and Benchmarks
PE ratios can differ a lot between industries. For example, tech might have a higher forward price to earnings ratio because of its fast growth. But, the utilities sector might have a lower ratio because it grows slower but is more stable.
- Industries with high growth chances usually have higher PE ratios.
- Mature industries tend to have lower PE ratios.
- Things like debt and earnings growth can also affect a company's PE ratio.
Implications for Investors
Investors should think about the forward price earnings ratio when looking at investment options. A high forward p e ratio might mean the company is overvalued. A low ratio could mean it's undervalued. Knowing the industry norms helps investors make better choices and avoid making wrong comparisons.
Limitations of PE and Forward PE Ratios
When looking at stocks, it's key to understand the limits of PE and Forward PE ratios. A good forward pe ratio can be misleading if not seen in context. For example, trailing pe vs forward pe ratios can vary a lot. Also, trailing pe ratios might not show a company's future growth well.
The forward pe multiple is based on expected future earnings. But, these projections can be wrong or biased. Companies with low or negative earnings can make the PE ratio less useful. Also, the PE ratio doesn't consider a company's growth rate or debt levels. This can give an incomplete view of its financial health.
To get a better understanding, consider these factors:
- Industry norms and benchmarks
- Company-specific growth prospects
- Debt levels and financial health
By looking at these factors and using PE and Forward PE ratios with other metrics, investors can make better choices. Remember, a high PE ratio doesn't always mean a stock is overvalued. Some top stocks, like Amazon, have had high PE ratios.
Strategies for Using PE and Forward PE together
When looking at investment options, it's key to check both the trailing p e vs forward p e ratios. The trailing p e ratio shows a company's past success. The forward p e ratio hints at its future growth. Together, they help investors understand a company's value better.
For instance, trailing vs forward p e ratios help spot growth stocks. A low forward p/e ratio might mean a stock is cheap compared to its future earnings. A high forward p/e ratio could mean it's pricey based on expected growth.
Here are some key points to keep in mind when using trailing vs forward pe ratio:
- Regional banks usually have a forward P/E of about 16 because their earnings are steady.
- The healthcare information and technology sector has a forward P/E of 133. This is because of fast innovation and high growth hopes.
- You can calculate forward P/E ratios in Excel. Just divide the market price per share by the expected earnings per share.
By looking at both trailing and forward p/e ratios, investors can make better choices. It's important to remember that a good forward P/E ratio changes by industry. But, using forward P/E with other metrics like PEG ratio or EV/EBITDA ratio gives a fuller view of a company's value.
| Industry | Forward P/E Ratio |
|---|---|
| Regional Banks | 16 |
| Healthcare Information and Technology | 133 |
| Technology | 34.57 (e.g., Apple's stock) |
Conclusion: Making Informed Investment Decisions
The PE and forward PE ratios give us important information. The trailing price to earnings ratio shows a company's past performance. On the other hand, the forward earnings focused forward PE ratio looks at future growth.
Using both PE and forward PE metrics together gives a full view of a company's value and growth. This helps investors make better choices. They can find chances that match their goals.
In the future, how we use PE and forward PE ratios will likely change. As markets and what investors want change, understanding the whole picture will become more important. Smart investors will keep up with these changes and adjust their plans.
FAQ
What is the difference between PE (Price-to-Earnings) ratio and Forward PE ratio?
The PE ratio looks at a company's past earnings. The Forward PE ratio looks at its future earnings. PE uses past data, while Forward PE uses future projections.
How is the PE ratio calculated?
To find the PE ratio, divide a company's stock price by its earnings per share (EPS) over the last 12 months.
What is the significance of the PE ratio in investment analysis?
The PE ratio helps investors see if a company is fairly valued. It shows if a stock is cheap or expensive compared to its earnings.
How is the Forward PE ratio calculated?
To find the Forward PE ratio, divide a company's current stock price by its expected future earnings per share (EPS) for the next 12 months.
When is the Forward PE ratio particularily useful?
Forward PE is good for checking growth stocks or companies going through big changes. It shows their possible future success.
How do PE and Forward PE ratios differ in terms of time frame considerations?
PE looks at past earnings, while Forward PE looks at future earnings. This difference can give different views on a company's value.
How do earnings estimates impact the reliability of Forward PE?
Earnings estimates can be uncertain. The actual future earnings might not match the projections. This is something to think about when using Forward PE.
How do non-recurring earnings affect the interpretation of PE ratios?
Non-recurring items can change PE ratios. This might give a wrong idea of a company's true value. Investors should be careful when looking at PE ratios in these cases.
How can PE ratios be used to analyze broader market trends?
Looking at PE trends in major stock indices and sector-specific PE norms can give insights into market valuations. It helps see how different industries compare.
What are the limitations of using Forward PE for growth stocks?
Forward PE might not fully show the growth of high-growth companies. Predicting future earnings can be hard. Investors should keep this in mind when looking at growth stocks.
How can investors interpret PE ratios across different industries?
Different industries have unique factors like regulations and growth prospects. These can affect typical PE ratios. Investors should understand these differences when comparing companies.
What are the possible pitfalls of relying too heavily on PE and Forward PE ratios?
PE and Forward PE can be misleading in times of economic change or for companies with earnings that go up and down. Investors should look at other financial metrics and qualitative factors too. This helps avoid making wrong choices.
How can investors leverage both PE and Forward PE ratios in their investment analysis?
Using both PE and Forward PE can give a better view of a company's value. It helps investors make smarter choices and diversify their portfolios.