Mastering Market Value Ratios: Data-Driven Financial Insights
Market value ratios are key for those in finance and investing. They give deep insights into a company's health and how it's seen in the market. This helps investors see if a company is a good choice and how it stacks up against others.
These ratios, like valuation ones, show a company's financial strength and growth chances. This knowledge is vital for making smart investment choices.
Ratio analysis is a strong tool for checking a business's health and performance. It compares financial numbers to understand a company's success and stability. Market value ratios, like the price-to-earnings ratio, are key in this analysis. They help make financial decisions based on solid data.
Key Takeaways
- Market value ratios provide insights into a company's financial health and market perception.
- Valuation ratios, such as price-to-earnings and price-to-book ratios, are essential tools for investors.
- Ratio analysis is a powerful tool for evaluating a company's performance and financial health.
- Market value ratios can help investors assess investment opportunity and compare performance across industries.
- By mastering market value ratios, investors can gain a competitive edge in evaluating stock performance and identifying market trends.
- Market value ratios, including valuation ratios, can help investors optimize their investment strategies and make informed decisions.
- Financial professionals can leverage market value ratios to provide data-driven insights and recommendations to clients.
Understanding Market Value Ratios
Market value ratios are key for checking how well a company is doing and its worth. They help investors and managers make smart choices. These ratios use today's market prices, giving a fresh look at a company's value.
To figure out these ratios, you divide the company's current market price by certain numbers. For instance, the price-to-earnings ratio is the market price per share divided by earnings per share. This shows how much you're paying for each dollar of earnings.
Some important market value ratios include:
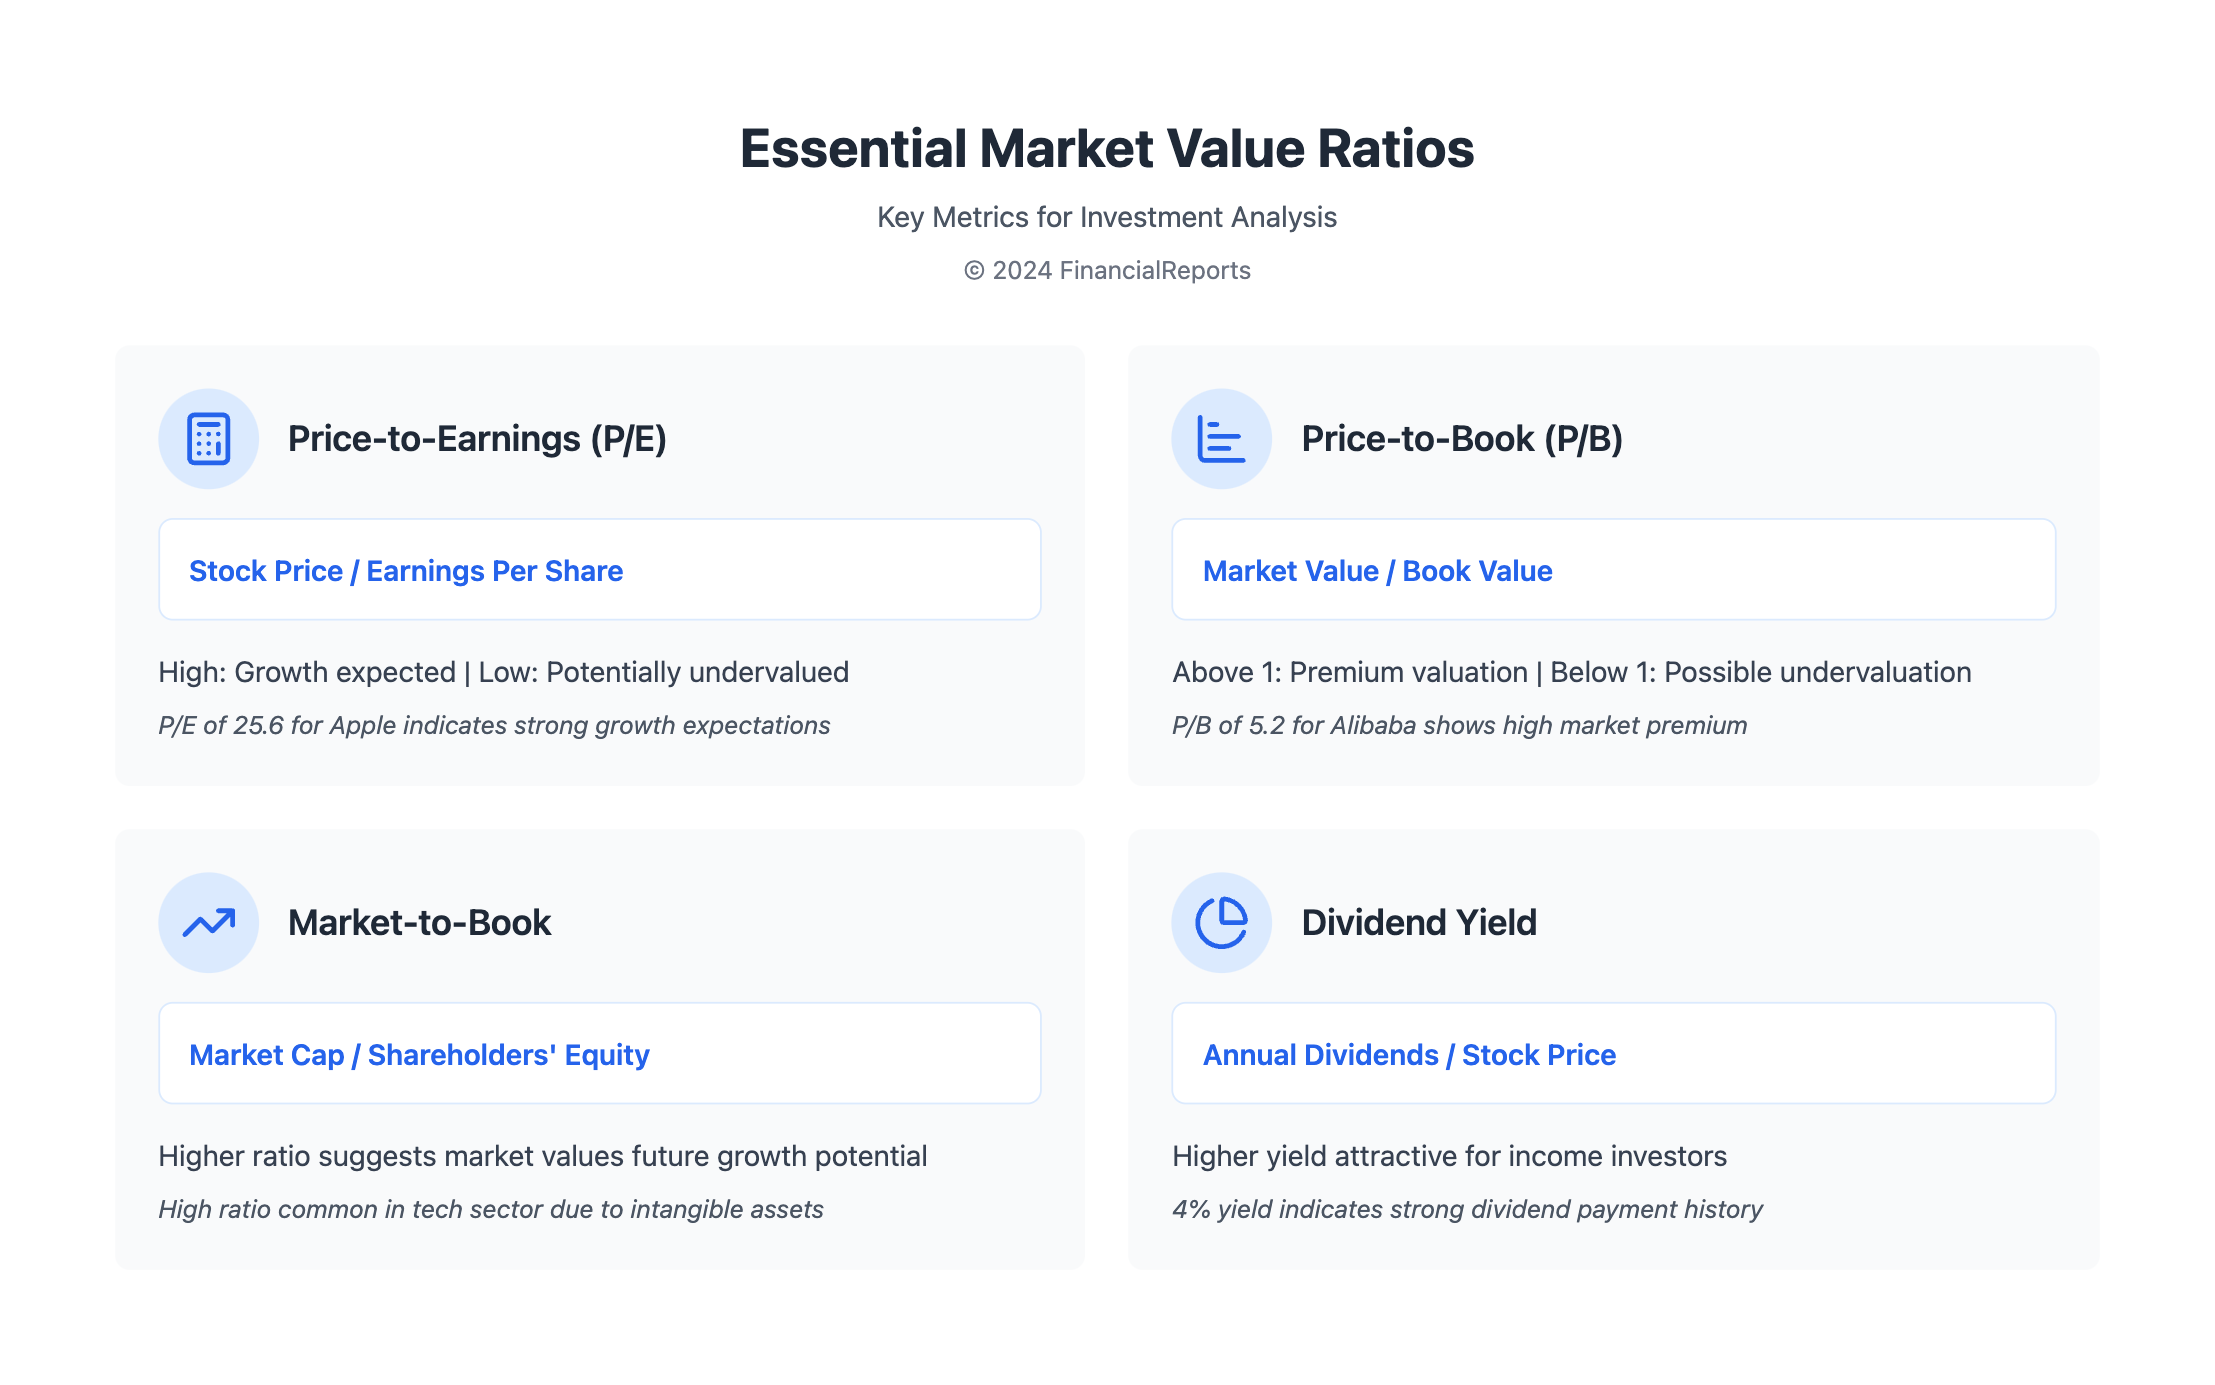
- Price-to-earnings ratio
- Price-to-book ratio
- Dividend yield ratio
These ratios are vital for judging a company's success and what it might do in the future. By looking at these ratios, investors can understand a company's value better and make smart choices.
| Ratio | Calculation | Example |
|---|---|---|
| Price-to-earnings ratio | Current market price per share ÷ Earnings per share | Apple's price-to-earnings ratio is 25.6 |
| Price-to-book ratio | Current market price per share ÷ Book value per share | Alibaba Group's price-to-book ratio is 5.2 |
Knowing about market value ratios helps investors make better choices. It gives a clear view of a company's value and how it's doing.
Key Types of Market Value Ratios
Market value ratios are key for checking how a company's stock price is doing. They help investors make smart choices. Ratios like the price-to-earnings (P/E) ratio show how much investors think a company will earn in the future.
Another important ratio is the marketability ratio. The price-to-book (P/B) ratio, for example, shows how much the market values a company's assets. Other ratios, like the dividend yield and price-to-sales (P/S) ratio, also give insights into a company's value.
Price-to-Earnings (P/E) Ratio
The P/E ratio is a basic tool that shows what investors think about a company's future. It's found by dividing the stock price by earnings per share. A high P/E ratio might mean investors think the company will grow a lot. A low P/E ratio could mean the stock is a good deal.
Price-to-Book (P/B) Ratio
The P/B ratio looks at how much the market values a company's assets. It's found by dividing the market value by the book value. A P/B ratio of 1 means the market value is the same as the book value. A ratio over 1 means the market value is higher.
Dividend Yield Ratio
The dividend yield ratio is important for investors who want income. It shows the annual dividend income compared to the stock's price. A high dividend yield ratio means more income from dividends.
Knowing these ratios is key for smart investing. By looking at valuation and marketability ratios, investors can understand a company's health and growth chances.
Calculating Market Value Ratios
To figure out market value ratios, you need to know the different types and how to use them. The book-to-market ratio compares a company's book value to its market value. You can find this ratio by using the formula: Book-to-Market = Common Shareholders’ Equity / Market Cap.
The market-to-book ratio is the opposite of the book-to-market ratio. It shows if a stock is overvalued or undervalued. To get this ratio, use the formula: Market-to-Book = Market Cap / Common Shareholders’ Equity.
Here are some key market value ratios and how to calculate them:
- Price to Earnings Ratio (P/E): Stock price / Earnings per share
- Market to Book Ratio (M/B): Market capitalization / Book value
- Price to Sales Ratio (P/S): Market capitalization / Annual sales
These ratios help figure out a company's real value and spot undervalued or overvalued stocks. By using these ratios, investors and analysts can make better choices and stay ahead in the market.
| Ratio | Formula | Description |
|---|---|---|
| Book-to-Market | Common Shareholders’ Equity / Market Cap | Compares a company's book value with its market value |
| Market-to-Book | Market Cap / Common Shareholders’ Equity | Evaluates stock overvaluation or undervaluation |
Interpreting Market Value Ratios
When looking at all valuation ratios stocks, it's key to understand the context. The marketability ratio is important because it shows how easy it is to sell a stock. To get the most out of market value ratios, look at the numbers and their setting. Think about industry standards and past performance.
A high Price-to-Earnings (P/E) ratio might mean the market is very optimistic or the stock is overvalued. But a low Price-to-Book (P/B) ratio could mean the stock is cheap or has financial problems. Here are some things to think about when looking at market value ratios:
- Industry norms and benchmarks
- Economic conditions
- Company-specific factors, such as financial health and growth prospects
By looking at these points and the complex nature of financial markets, experts can find useful insights. This helps them make better investment choices.
The Role of Market Value Ratios in Investment Decisions
Market value ratios are key in making investment choices. They give insights into a company's financial health and value. These ratios, like valuation ratios, help investors check stock performance and make smart choices. By looking at market value ratios, investors can spot stocks that might be too cheap or too expensive.
Important market value ratios include the Price-to-Earnings (P/E) ratio. It compares a company's share price to its earnings per share (EPS). A high P/E ratio might mean the stock is overvalued. On the other hand, a low P/E ratio could mean it's undervalued.
Other key ratios are the Price-to-Book (P/B) ratio and the Dividend Yield ratio. These ratios give different views for investors. They help compare companies in the same industry and across different sectors.
When checking stock performance, investors look at several valuation ratios, such as:
- Price-to-Earnings (P/E) ratio
- Price-to-Book (P/B) ratio
- Dividend Yield ratio
These ratios help investors understand a company's financial health. They make it easier to decide on investments, balancing short-term market changes with long-term value.
Comparing Industry Averages
When we look at a company's performance, it's key to compare its market value ratios to industry averages. This helps us see how strong or weak a company is compared to others. By looking at all valuation ratios stocks, we can spot where a company does better or worse than the norm. The marketability ratio is very important for seeing if a company can make good returns on its investments.
To make a fair comparison, we need to pick the right peer groups and get reliable industry data. Databases like D&B Business Browser, Factiva, and IBISWorld are great for this. They give us industry, sector, and S&P 500 ratios to compare. Here are some important ratios to check:
- Profitability ratios: net profit margin and return on shareholders' equity
- Liquidity ratios: working capital and current ratio
- Debt or leverage ratios: debt-to-equity and debt-to-asset ratios
By looking at these ratios and comparing them to industry averages, we can understand a company's performance better. For example, if a company's return on equity is higher than its industry average, it might show good management and a competitive edge.
Industry benchmarks give us a common point to compare, making our analysis more meaningful. By using these benchmarks and looking at how peers perform, investors can find companies that stand out. This helps them make better choices about a company's value and its place in its industry.
| Ratio | Industry Average | Company Performance |
|---|---|---|
| Net Profit Margin | 10% | 12% |
| Return on Equity | 15% | 18% |
| Debt-to-Equity Ratio | 0.5 | 0.3 |
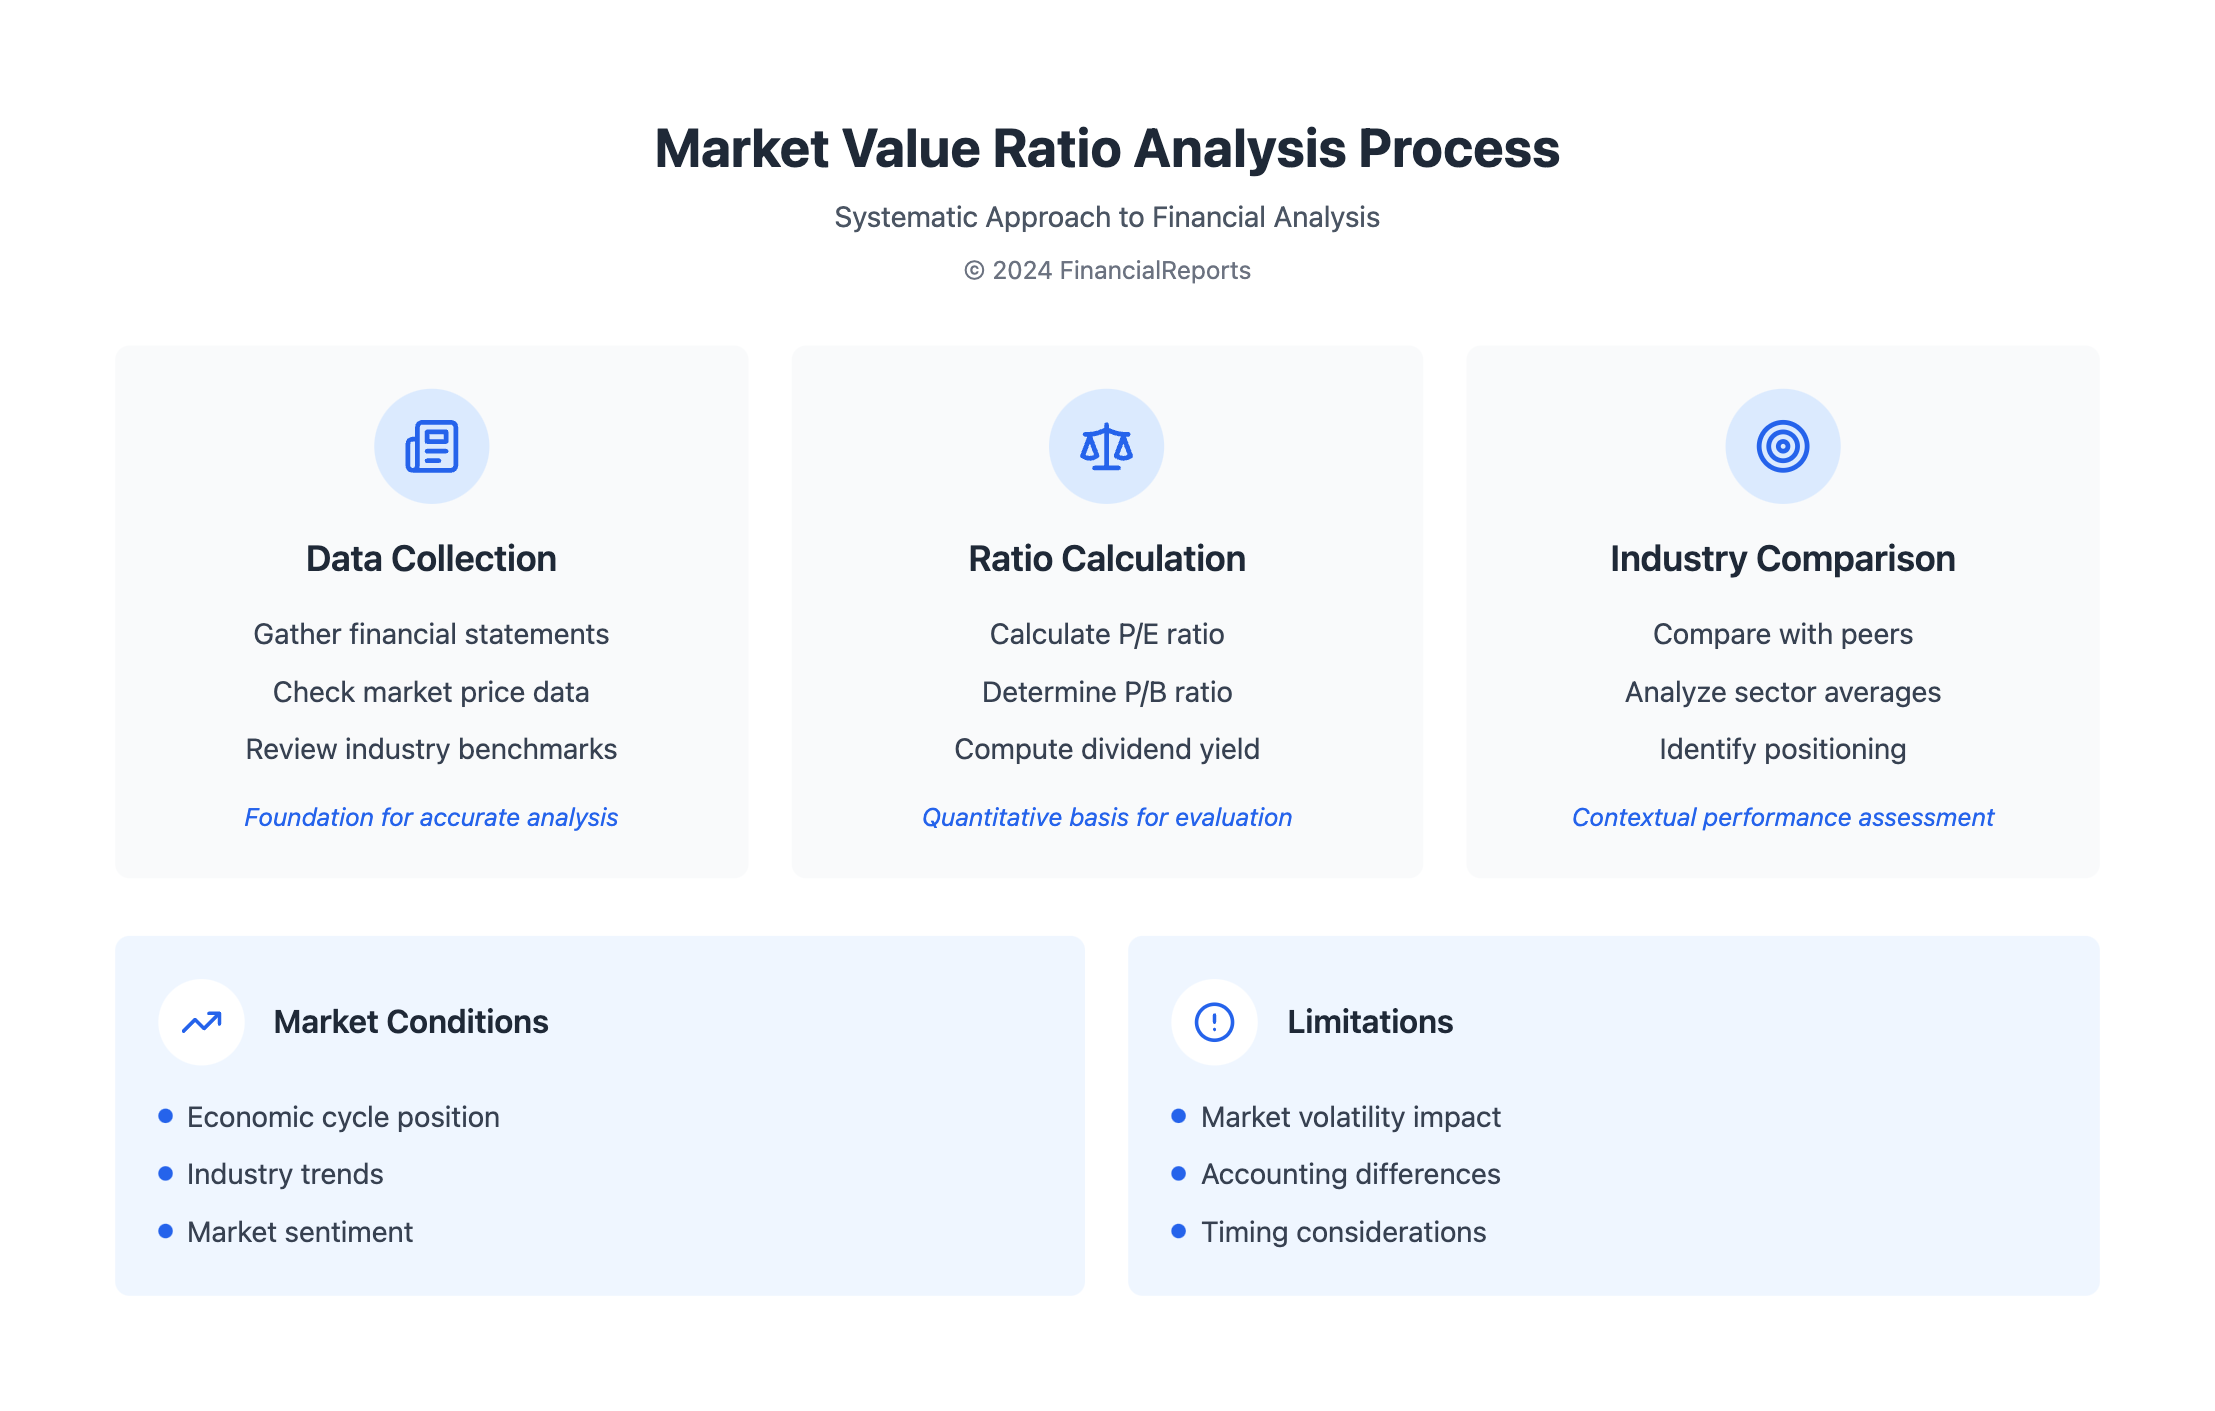
Limitations of Market Value Ratios
Market value ratios are key in financial analysis but have some big limitations. Market volatility can distort these ratios, making it hard to get a true picture of a company's worth. Also, different accounting practices and industry specifics can affect how we understand these ratios.
Finding similar market data for valuation can be tough, even more so in niche or new markets. This can make it hard to accurately judge a company's financial health. EBITDA helps by showing a company's real profit by removing non-operating costs. Yet, market value ratios might not show the whole financial story.
Some major issues with market value ratios include:
- Market inefficiency causing price and ratio distortions
- Challenges in valuing intangible assets like brand and innovation
- How sensitive these ratios are to market changes
To overcome these challenges, we need to look at other metrics and methods. This way, we can get a better understanding of a company's value. Using ratios like price-to-earnings and price-to-book together can give a clearer view of a company's worth.
| Valuation Ratio | Formula | Description |
|---|---|---|
| Price-to-Earnings Ratio | Price per share / Earnings per share | Looks at a company's stock price compared to its earnings |
| Price-to-Book Ratio | Market value per share / Book value per share | Compares a company's stock price to its book value |
Utilizing Market Value Ratios in Financial Analysis
Financial experts use many tools to check how well a company is doing. Market value ratios are key among these tools. They help see how much a company is worth and its financial health. Ratios like price-to-earnings and price-to-book are important for this.
The marketability ratio also plays a big role. It shows how well a company can make money from its investments.
When using these ratios in financial models, it's important to think about a few things. The company's industry, size, and how it's growing are all important. For example, a high price-to-earnings ratio might mean a company is too expensive. But a low price-to-book ratio could mean it's a good deal.
By looking at these ratios, experts can make smart choices about where to invest and how to run a company.
Some important financial ratios to use with market value ratios include:
- Liquidity ratios, like the current and quick ratios
- Profitability ratios, such as profit margin and return on equity
- Efficiency ratios, like asset and inventory turnover
These ratios give a full picture of a company's financial health. This helps experts make decisions based on solid data.
| Ratio | Formula | Interpretation |
|---|---|---|
| Price-to-Earnings Ratio | Market Price per Share / Earnings per Share | High ratio may indicate overvaluation, while low ratio may indicate undervaluation |
| Marketability Ratio | Market Value / Book Value | High ratio may indicate high marketability, while low ratio may indicate low marketability |
By using market value ratios and other financial metrics, experts can really understand a company's financial health. This helps them make smart choices about investments and company strategies.
Future Trends in Market Value Ratios
The financial world is changing fast, and market value ratios are no exception. New tech like data analytics and artificial intelligence is changing how we use these ratios. Now, we can track ratios in real-time, predict market trends, and use machine learning to spot patterns.
Recent events like the COVID-19 pandemic and inflation have shown us the need for quick and detailed financial analysis. A PwC survey found that 79% of CFOs are now focusing on making their finances more agile. This shift will likely change how we view and use market value ratios as the market keeps evolving.
Investors and financial experts need to keep up with these trends. They should use data and technology to make smart choices. By understanding these changes, they can lead in financial innovation and help their companies stay strong in a changing market.
FAQ
What are market value ratios?
Market value ratios are financial tools that show a company's current market value. They compare this value to financial parameters. This gives insights into a company's health and how the market sees it.
How do market value ratios differ from other financial ratios?
Unlike other ratios, market value ratios use current market prices. This gives a real-time view of a company's value.
What are the primary types of market value ratios?
The main types are the Price-to-Earnings (P/E) ratio, the Price-to-Book (P/B) ratio, and the Dividend Yield ratio.
How do you accurately calculate market value ratios?
To calculate these ratios, follow a step-by-step process with the right financial data. Avoid mistakes like using old data or misreading earnings.
How do you interpret high and low market value ratios?
Understanding these ratios means looking at the big picture. Consider industry norms, economic conditions, and company specifics. This helps avoid oversimplification.
How can market value ratios be used in investment decision-making?
Investors use these ratios to check stock performance. They help spot undervalued or overvalued stocks. These metrics are key in detailed investment analysis.
Why is it important to compare a company's market value ratios to industry averages?
Comparing ratios to industry benchmarks is key. It gives a standard reference. This helps in meaningful comparisons and insights into a company's performance and value.
What are the limitations of market value ratios?
Market volatility, accounting practices, and industry specifics can skew these ratios. It's wise to use other metrics and methods to get a full picture.
How can market value ratios be effectively integrated into financial analysis and modeling?
Adding these ratios to financial models improves forecasting and decision-making. This leads to more informed, data-driven choices.
What are the emerging trends and future directions in the use of market value ratios?
New tech like real-time tracking and predictive analytics is changing ratio analysis. So are shifting market conditions. These changes are shaping the future of financial analysis.