Market Charts: Unlock Financial Data Insights
Market charts are key for those in finance, investors, and big clients. They help understand financial data. With tools like Pandas and matplotlib, Python makes charts like line and candlestick ones. These show trends in financial data.
Financial analysts use charts to spot trends and smooth out data. They help see how stock prices move. Charts like Bollinger Bands show volatility, helping in financial analysis.
Introduction to Market Charts
Market charts help analyze financial data, like stock history. They're used in real life for managing risk and trading. J.P. Morgan offers lots of data to aid in chart analysis.
Key Takeaways
- Market charts are vital for financial analysis and making decisions.
- Python libraries like Pandas help make different charts.
- Charts show trends in financial data, like line and candlestick ones.
- Tools like Bollinger Bands help understand market trends.
- There's a lot of data to support chart analysis.
- Charts are useful for managing risk and trading.
Understanding Market Charts and Their Importance
Market charts are key for those in finance, investors, and big clients. They help see trends and patterns in the market. A market graph shows data in a way that makes trends and opportunities clear.
There are many types of market charts, like line, bar, and candlestick charts. Each has its own use in analyzing the market. For instance, candlestick charts, from Japan in the 1700s, help spot price trends.
Charts show trends, patterns, and indicators. Trends show the market's direction. Patterns are shapes on the chart. Indicators, like moving averages, help predict prices.
| Chart Type | Description |
|---|---|
| Line Chart | A chart that connects a series of data points with a line. |
| Bar Chart | A chart that uses bars to represent data points. |
| Candlestick Chart | A chart that uses candlestick shapes to represent price movements. |
Knowing about market charts helps professionals and investors make better choices. They can use charts to analyze trends and patterns. Market charts are vital for anyone in the financial world.
How to Read Market Charts Effectively
To read market charts well, you need to know about different charts and graphs. Live trading charts show real-time data, helping investors make smart choices. By looking at trends and patterns, they can spot chances and dangers.
When looking at trends, it's key to know the trend's length and a stock's usual patterns. Also, watch for signs that a trend might change. Technical indicators like moving averages and RSI help understand market data. For instance, the 200-day moving average shows if a stock is going up or down.
Key Indicators for Effective Chart Reading
- Relative Strength Line: Compares the price movement of a stock to the price movement of the S&P 500
- Volume Percent Change: Reflects the recent trading activity compared to the average daily shares traded over the last 50 trading sessions
- Institutional Trading Activity: Approximately 70% of market trading activity is attributed to institutions like mutual funds, banks, pensions, and hedge funds
By using live trading charts and key indicators, investors can craft a solid strategy. This helps them make choices based on data, reducing risks and increasing gains.
| Indicator | Description |
|---|---|
| Moving Averages | Used to identify trends and provide signals for uptrends or downtrends |
| Relative Strength Index (RSI) | Measures the magnitude of recent price changes to determine overbought or oversold conditions |
The Role of Market Charts in Investment Strategies
Market charts are key in investment strategies. They show market data and trends in a visual way. By looking at these charts, investors can spot patterns and make smart choices. For example, a market graph helps investors see how different indicators relate and predict future market moves.
There are many types of market charts, like line, bar, and candlestick charts. Each gives unique insights into market trends. For example, line charts help spot trends in market movements. Candlestick charts offer more details on market volatility.
Some important parts of market charts include:
- Trendlines, which show the market's direction
- Support and resistance levels, for finding good times to buy or sell
- Indicators, like moving averages and RSI, for deeper market insights
Using market charts and graphs helps investors craft good strategies. It's important to mix technical and fundamental analysis for a full market view. This way, investors can make informed decisions.
| Chart Type | Description |
|---|---|
| Line Chart | Shows the movement of a stock price over time |
| Bar Chart | Details market trends and patterns |
| Candlestick Chart | Uses candlestick formations to show market trends |
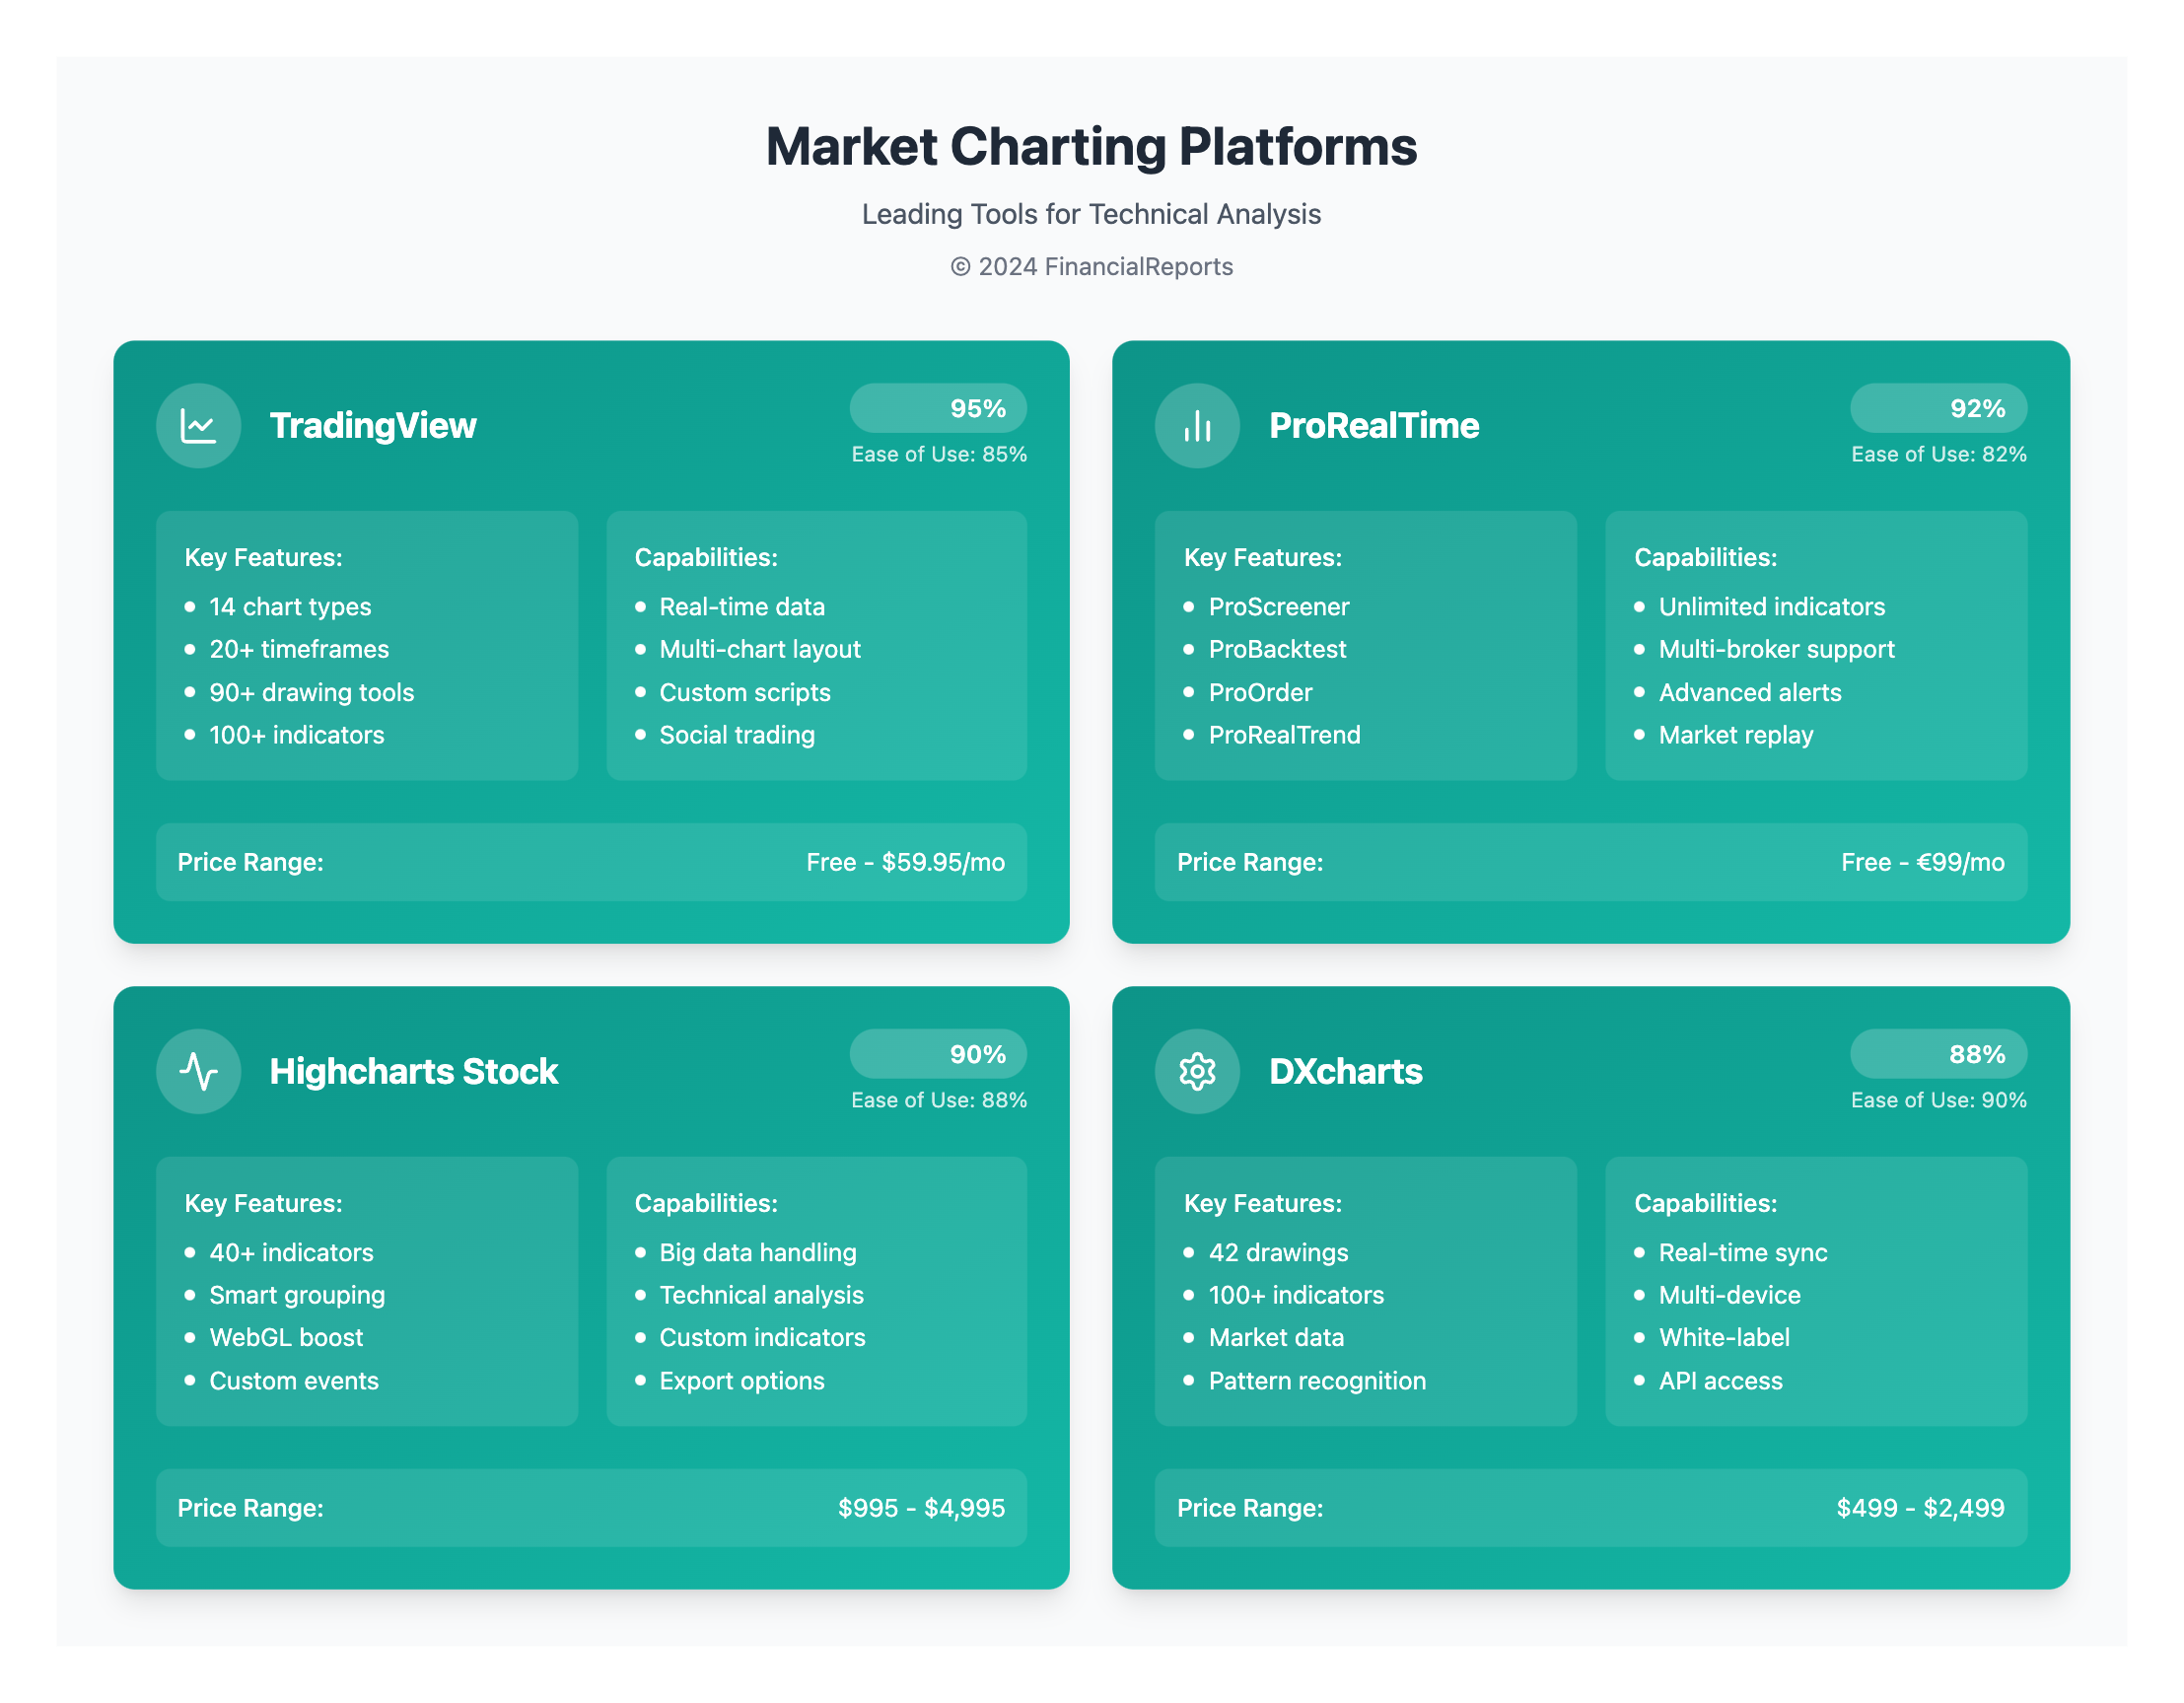
Popular Market Charting Tools and Software
Financial experts and investors use many market charting tools to make smart choices. Live trading charts and market charts are key parts of these tools. They give real-time data and insights. It's important to pick a charting platform that fits your needs.
Popular tools include TradingView, ProRealTime, and Yahoo Finance. They offer features like unlimited indicators and real-time alerts. For instance, TradingView has over 120 technical indicators. ProRealTime has unlimited indicators and multi-chart layouts without ads.
Overview of Leading Charting Platforms
Here are some main features of top charting platforms:
- TradingView: 14 chart types, 20+ timeframes, 90+ drawing tools, and 100+ pre-built indicators
- ProRealTime: unlimited indicators, multi-chart layouts, and a user experience rating of 85%
- Yahoo Finance: basic charting tools and financial news updates
Comparisons Among Charting Tools
When comparing charting tools, look at these factors:
| Platform | User Experience Rating | Charting and Technical Analysis Rating |
|---|---|---|
| TradingView | 85% | 95% |
| ProRealTime | 85% | 95% |
| Yahoo Finance | N/A | N/A |
Using live trading charts and market charts helps investors understand market trends. It's key to choose a platform that suits your needs. This ensures you have the right tools for success.
Integrating Market Charts with Financial Data
Financial experts need accurate and timely data to make smart investment choices. Combining market charts with financial data is key for spotting trends and patterns. A market graph shows market trends, helping investors see opportunities and risks. Live trading charts give real-time data, making quick decisions possible.
To link market charts with financial data well, knowing the different charts and graphs is important. These include bar charts, line graphs, and scatter plots. Here are the main points of market chart integration:
- Real-time data integration for quick decisions
- Looking at historical data to find trends and patterns
- Using market charts with fundamental analysis for better investment choices
Highcharts Stock, a well-liked charting tool, has over 40 technical indicators. These include moving averages, MACD, and RSI. It also has smart data grouping and a WebGL-powered Boost module for fast, smooth visuals, even with big datasets.
| Charting Library | Key Features |
|---|---|
| Highcharts Stock | 40 technical indicators, smart data grouping, WebGL-powered Boost module |
| DXcharts | 42 drawings, over 100 indicators, market data out of the box |
| AnyChart JavaScript library | 68 chart types, custom chart drawing, big data analytics, annotations |
By using these charting tools and combining market charts with financial data, investors can get important insights. Whether it's through live trading charts or looking at past data, a well-connected market graph is vital for success in finance.
Common Mistakes When Using Market Charts
Working with market charts requires avoiding common mistakes. These errors can lead to misreading data and poor investment choices. One big mistake is adding too many technical indicators to charts. This can hide important market signals and cause confusion.
Another error is focusing only on technical indicators without looking at the bigger picture. This can give misleading signals, more so in unstable markets. Also, ignoring the price action, which directly shows market information, can cause missed chances or wrong trading decisions.
Some common mistakes to avoid when using market charts include:
- Overloading charts with too many technical indicators
- Relying solely on technical indicators without considering broader market context
- Ignoring price action and broader market trends
- Chasing indicators without a clear trading goal or plan
Knowing these mistakes and avoiding them can help investors use market charts better. This way, they can make informed investment choices and reach their financial goals. Market charts are a valuable tool for analyzing trends and making smart investment decisions. But, it's key to use them right.
Case Studies: Successful Use of Market Charts
Market charts have been key for investors and financial experts to make smart choices. A market graph shows trends and patterns, helping spot chances and dangers. For example, J.P. Morgan's data and analytics, like volatility surfaces, help create detailed charts.
Studies show 92% trust peer recommendations, and 70% trust unknown sources. This shows the value of credible sources in charts. Here are some benefits of using market charts:
- They help show trends or patterns in a business study
- Make data simpler to grasp
- Make studies easier to read and understand
A good market graph can really improve engagement and brand image. Using a monochromatic color scheme keeps things professional and clean. By mixing charts with fundamental analysis, investors can make better choices and boost their success.
| Case Study | Market Graph Type | Outcome |
|---|---|---|
| Stock Market Analysis | Line Graph | 90% increase in lead quality |
| Forex Trading Success | Bar Chart | 95% improvement in brand awareness |
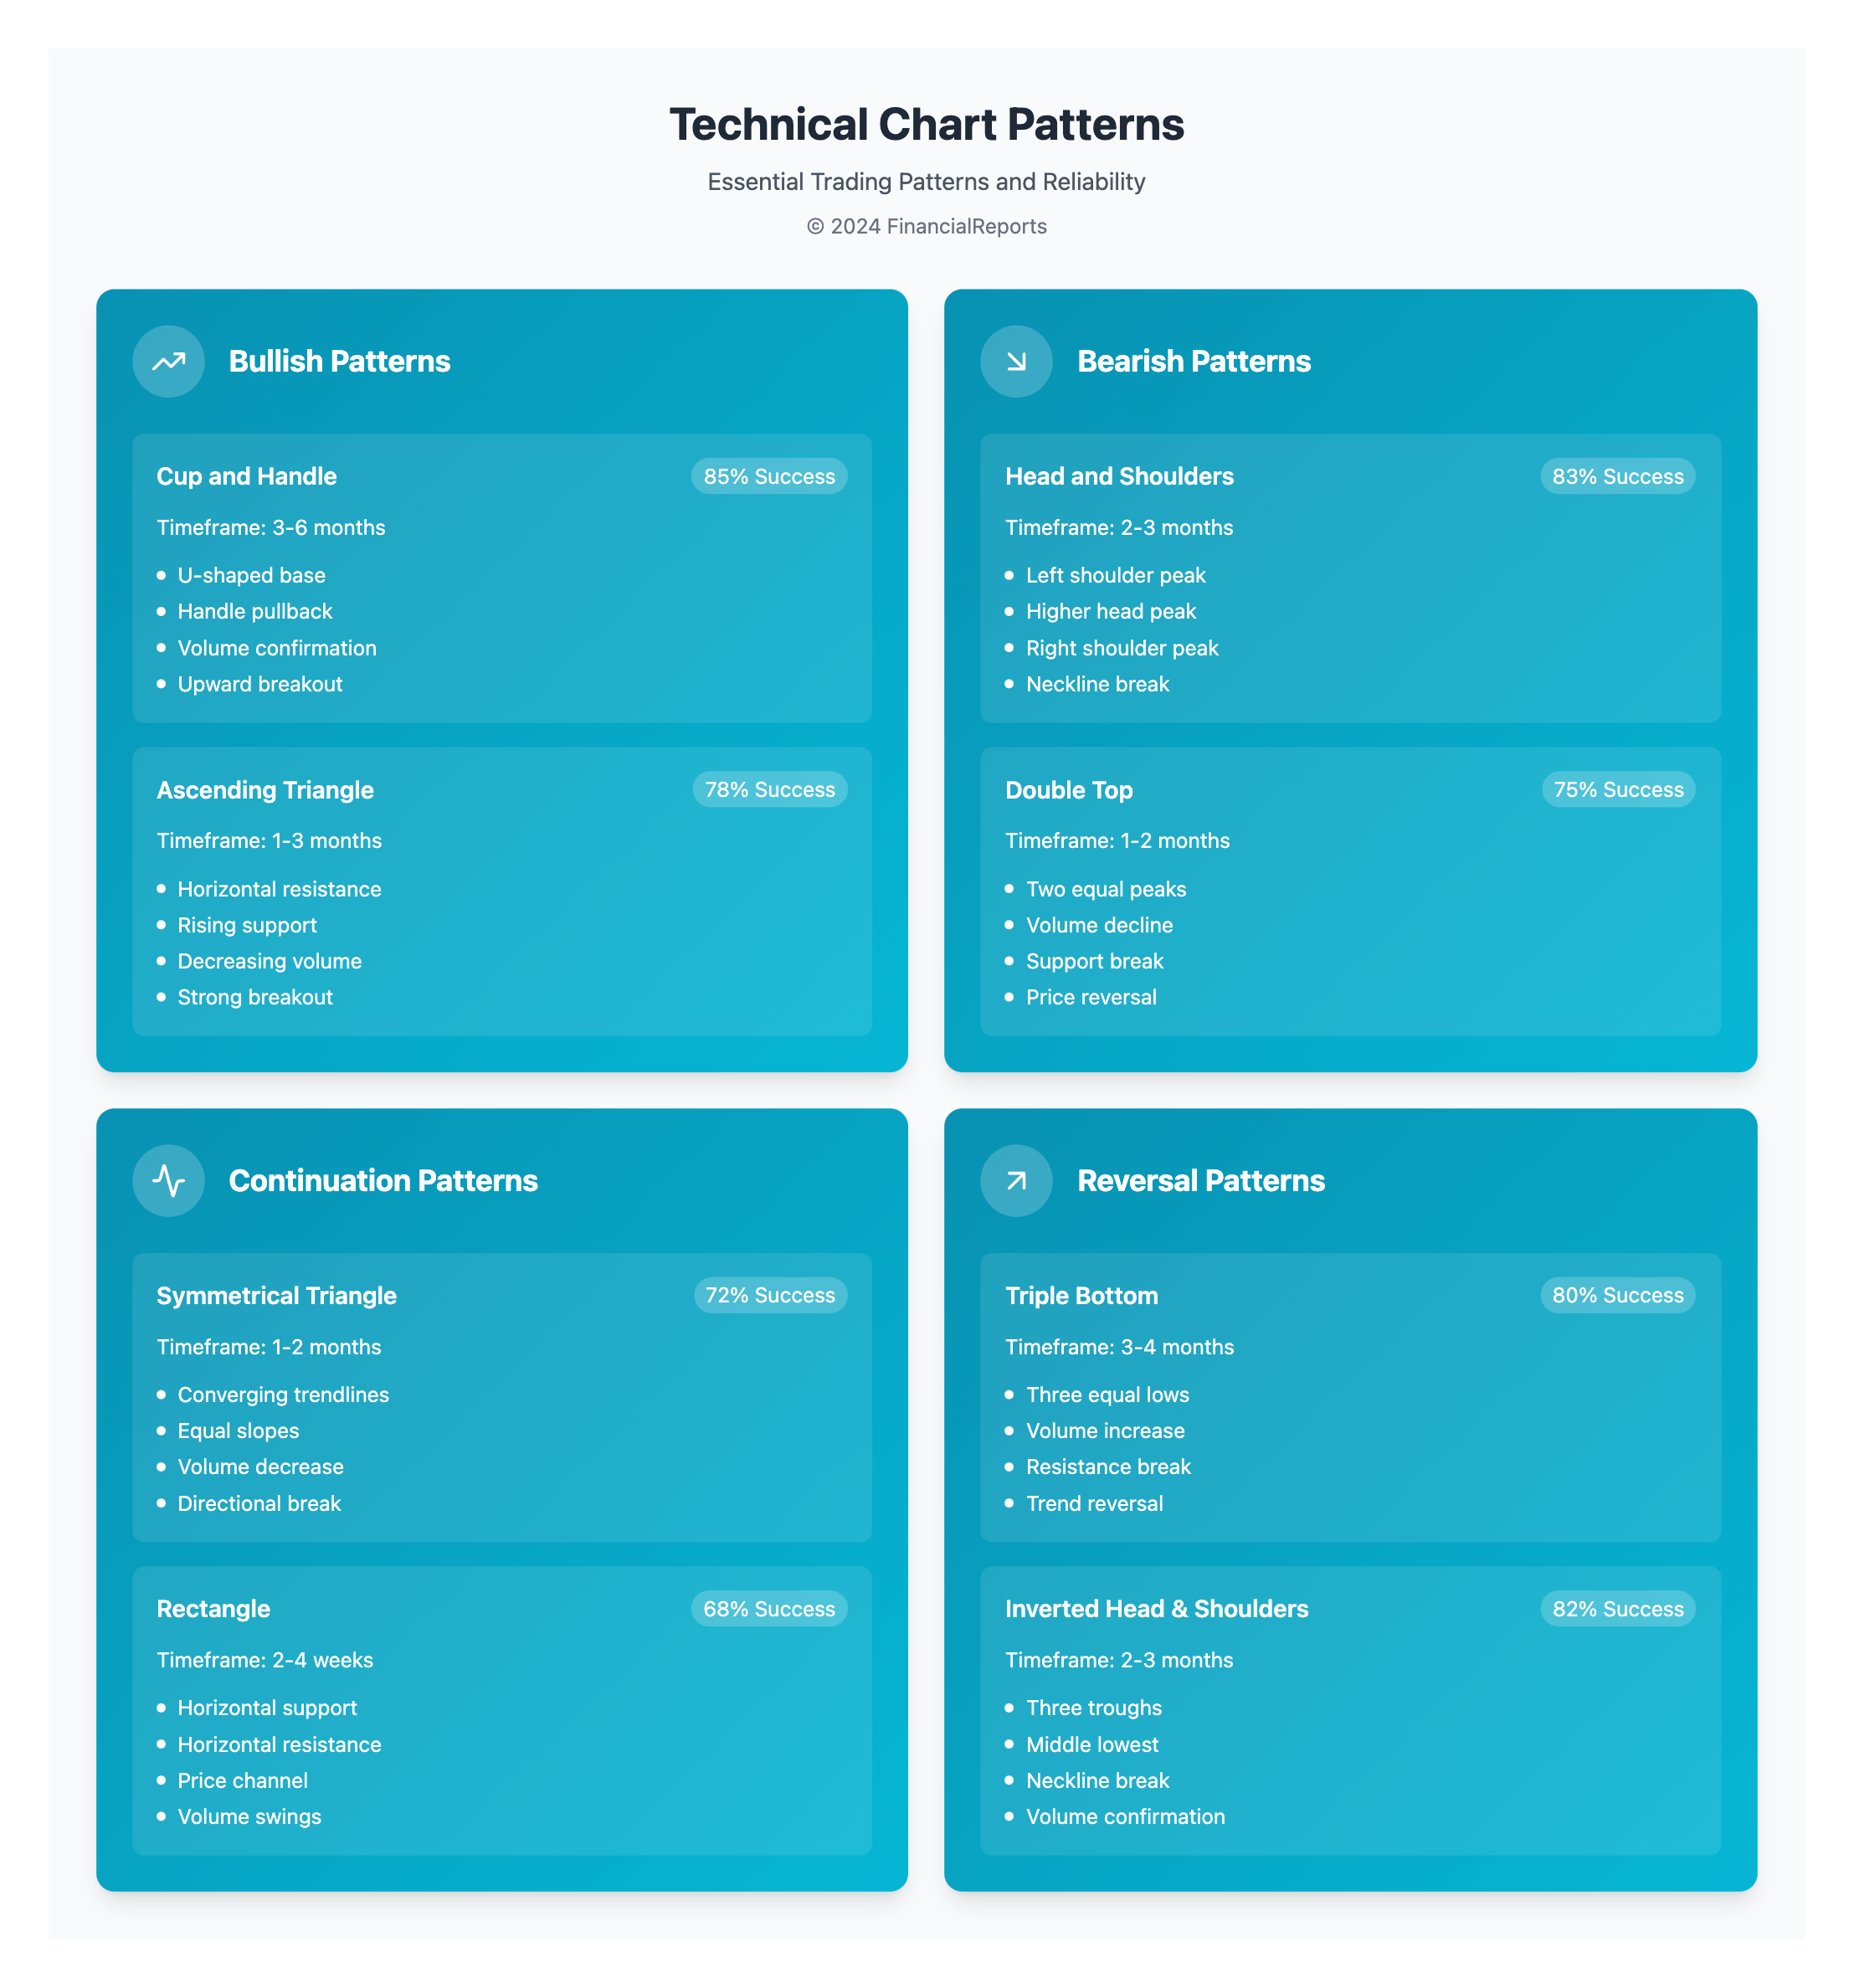
Future Trends in Market Charting
The financial world is seeing big changes in charting technology. This is changing how we look at and understand market charts. Now, with live trading charts, traders can get real-time data. This helps them make better choices.
Live trading charts are getting more popular. They give a full view of market trends and patterns.
Artificial Intelligence (AI) and machine learning are big in market charting now. These tools help spot complex patterns and trends. This lets traders predict market moves more accurately.
- AI finds chart patterns like ascending and descending triangles quickly. This saves traders a lot of time.
- Machine learning looks at past data to guess future market moves. This helps traders make smarter choices.
- AI analyzes live charts in real-time. This gives traders instant insights into market trends.
As the financial world keeps growing, we'll see more live trading charts and AI tools. These technologies will help traders stay ahead. They'll make more precise predictions and informed decisions.
| Chart Pattern | Description |
|---|---|
| Ascending Triangle | A continuation pattern that typically appears after an uptrend. |
| Descending Triangle | A bearish signal that appears after a downtrend. |
| Symmetrical Triangle | A pattern that indicates a continuation or a bilateral pattern depending on market conditions. |
Conclusion: Maximizing Insights from Market Charts
Market charts are key for those in finance and investing. They help us understand the market better. By using data and technical analysis, we can spot trends and make smart choices.
Summary of Key Takeaways
We've seen how important market charts are. They show trends and patterns. Knowing how to use them is vital for a good investment plan.
It's also important to avoid common mistakes. New technologies are making charting better. This helps us analyze the market more effectively.
Final Thoughts on Effective Chart Usage
Remember, market charts are just one tool. They work best when used with other methods. By mixing technical and fundamental analysis, we get a full picture of the market.
Stay alert to market changes. Use market charts to your advantage. This way, you can make better investment choices and succeed.
FAQ
What are market charts?
Market charts show financial data in a visual way. They help us see trends and patterns. This makes them key for making smart investment choices.
What are the different types of market charts?
There are line charts, bar charts, and candlestick charts. Each type has its own uses in financial analysis.
What are the key components of market charts?
Market charts have trends, patterns, and indicators like moving averages and RSI. These help analysts understand market movements and make better decisions.
How can I effectively read and analyze market charts?
To read charts well, look for trends and patterns. Also, understand market indicators. This helps you make smart investment choices. Mixing technical and fundamental analysis is key.
What are the popular market charting tools and software available?
Many charting tools and software are out there. Each has its own benefits. It's important to pick the right one for your needs to get the most from market data.
How can I integrate market charts with financial data?
Combining charts with real-time and historical data gives a full view of the market. This helps in deep analysis and making informed decisions.
What are the common mistakes to avoid when using market charts?
Don't misread data or rely too much on patterns. Also, keep up with market news. Careful analysis and using both technical and fundamental analysis can help avoid mistakes.
Can you provide examples of successful use of market charts?
Yes, many have used charts to succeed in stock and forex markets. Their strategies show how charts can guide smart investment decisions.
What are the future trends in market charting?
Charting technology will keep improving. Artificial intelligence (AI) will also play a bigger role. These changes will make financial decisions more accurate and effective.