How to Calculate the Price Earnings Ratio
The price earnings ratio is found by dividing a company's stock price by its earnings per share. It's a key metric for checking stock values. This calculation helps financial experts and investors see if a company's shares are fairly priced.
Knowing the price earnings ratio is vital. It lets investors compare companies in the same field. By dividing the market value per share by earnings per share, it shows how stocks compare. This is great for companies that are stable and don't grow much but have positive earnings.
Introduction to Price Earnings Ratio
The price earnings ratio is a key tool for investors. It shows the value of a company's shares. By dividing the stock price by earnings per share, it helps evaluate stock values.
Key Takeaways
- The price earnings ratio is calculated by dividing a company's stock price by its earnings per share.
- This metric is essential for evaluating stock valuations and making informed investment decisions.
- The price earnings ratio is useful for stable, low-growth companies with positive earnings.
- A higher P/E ratio might mean the company is overvalued, while a lower one could mean it's undervalued.
- Don't rely only on the price earnings ratio for investment choices. Look at other financial metrics too.
- Understanding diluted EPS is key when calculating the P/E ratio for investment opportunities.
Understanding the Price Earnings Ratio
The Price Earnings Ratio (P/E Ratio) is a key financial metric. It shows how much investors are willing to pay for a company's earnings. It's a price earnings multiple valuation tool that gives a quick look at market expectations and investor value.
To find the P/E ratio, you divide the stock price by the company's earnings per share. This ratio is vital in financial analysis. It helps investors see if a stock is overvalued or undervalued.
A high P/E ratio might mean a stock is expected to grow. On the other hand, a low P/E ratio could mean the stock is a good deal. Many things can affect the P/E ratio, like industry trends and investor views.
When looking at a company's P/E ratio, consider a few things:
- Compare it to past ranges and similar companies in the same industry.
- Think about the company's growth chances and future earnings.
- Look at the industry's P/E ratio and market trends.
Understanding the Price Earnings Ratio helps investors make better choices. It gives insights into a company's market view and growth chances. The price earnings multiple valuation from the P/E ratio is key for evaluating a stock's price and earnings.
The Formula for Calculating the Price Earnings Ratio
The price earnings ratio is found by dividing the market value per share by the earnings per share. This gives investors a way to see how profitable a company's shares are. For example, if a company's market value per share is $30 and its earnings per share are $5, the ratio is 6.
To understand the formula better, let's look at its parts:
- Market value per share: This is the current stock price of the company.
- Earnings per share: This is the company's net income divided by the total number of shares outstanding.
Breakdown of the Formula
The formula is: P/E Ratio = Market value per share / Earnings per share. This lets investors compare different companies' ratios. They can see which ones are overvalued or undervalued.
Components Explained: Price and Earnings
The price earnings ratio depends on two main parts: market value per share and earnings per share. Knowing these parts helps us understand the ratio. For example, a high ratio might mean investors think a company will grow a lot in the future.
| Company | Market Value per Share | Earnings per Share | P/E Ratio |
|---|---|---|---|
| Company A | $30 | $5 | 6 |
| Company B | $30 | $10 | 3 |
Gathering Required Data for Calculation
To figure out the price earnings ratio, you need the right data. Find the stock price on a trusted financial site by searching its ticker. Earnings per share (EPS) is key, found by dividing net income by common shares. It shows how well a company is doing financially.
It's important to use reliable sources for your data. Websites and databases are good places to start. Knowing the different EPS types helps investors make better choices.
Here are some things to think about when you're getting your data:
- Stock price: current market price of the stock
- EPS: calculated by dividing net income by average outstanding common shares
- Non-recurring items: adjustments may be necessary to ensure accurate price earnings multiple valuation
By carefully gathering and analyzing your data, you can make smart choices. This helps you accurately calculate the price earnings ratio. It's a key way to check a company's financial health and growth chances.
Step-by-Step Calculation Process
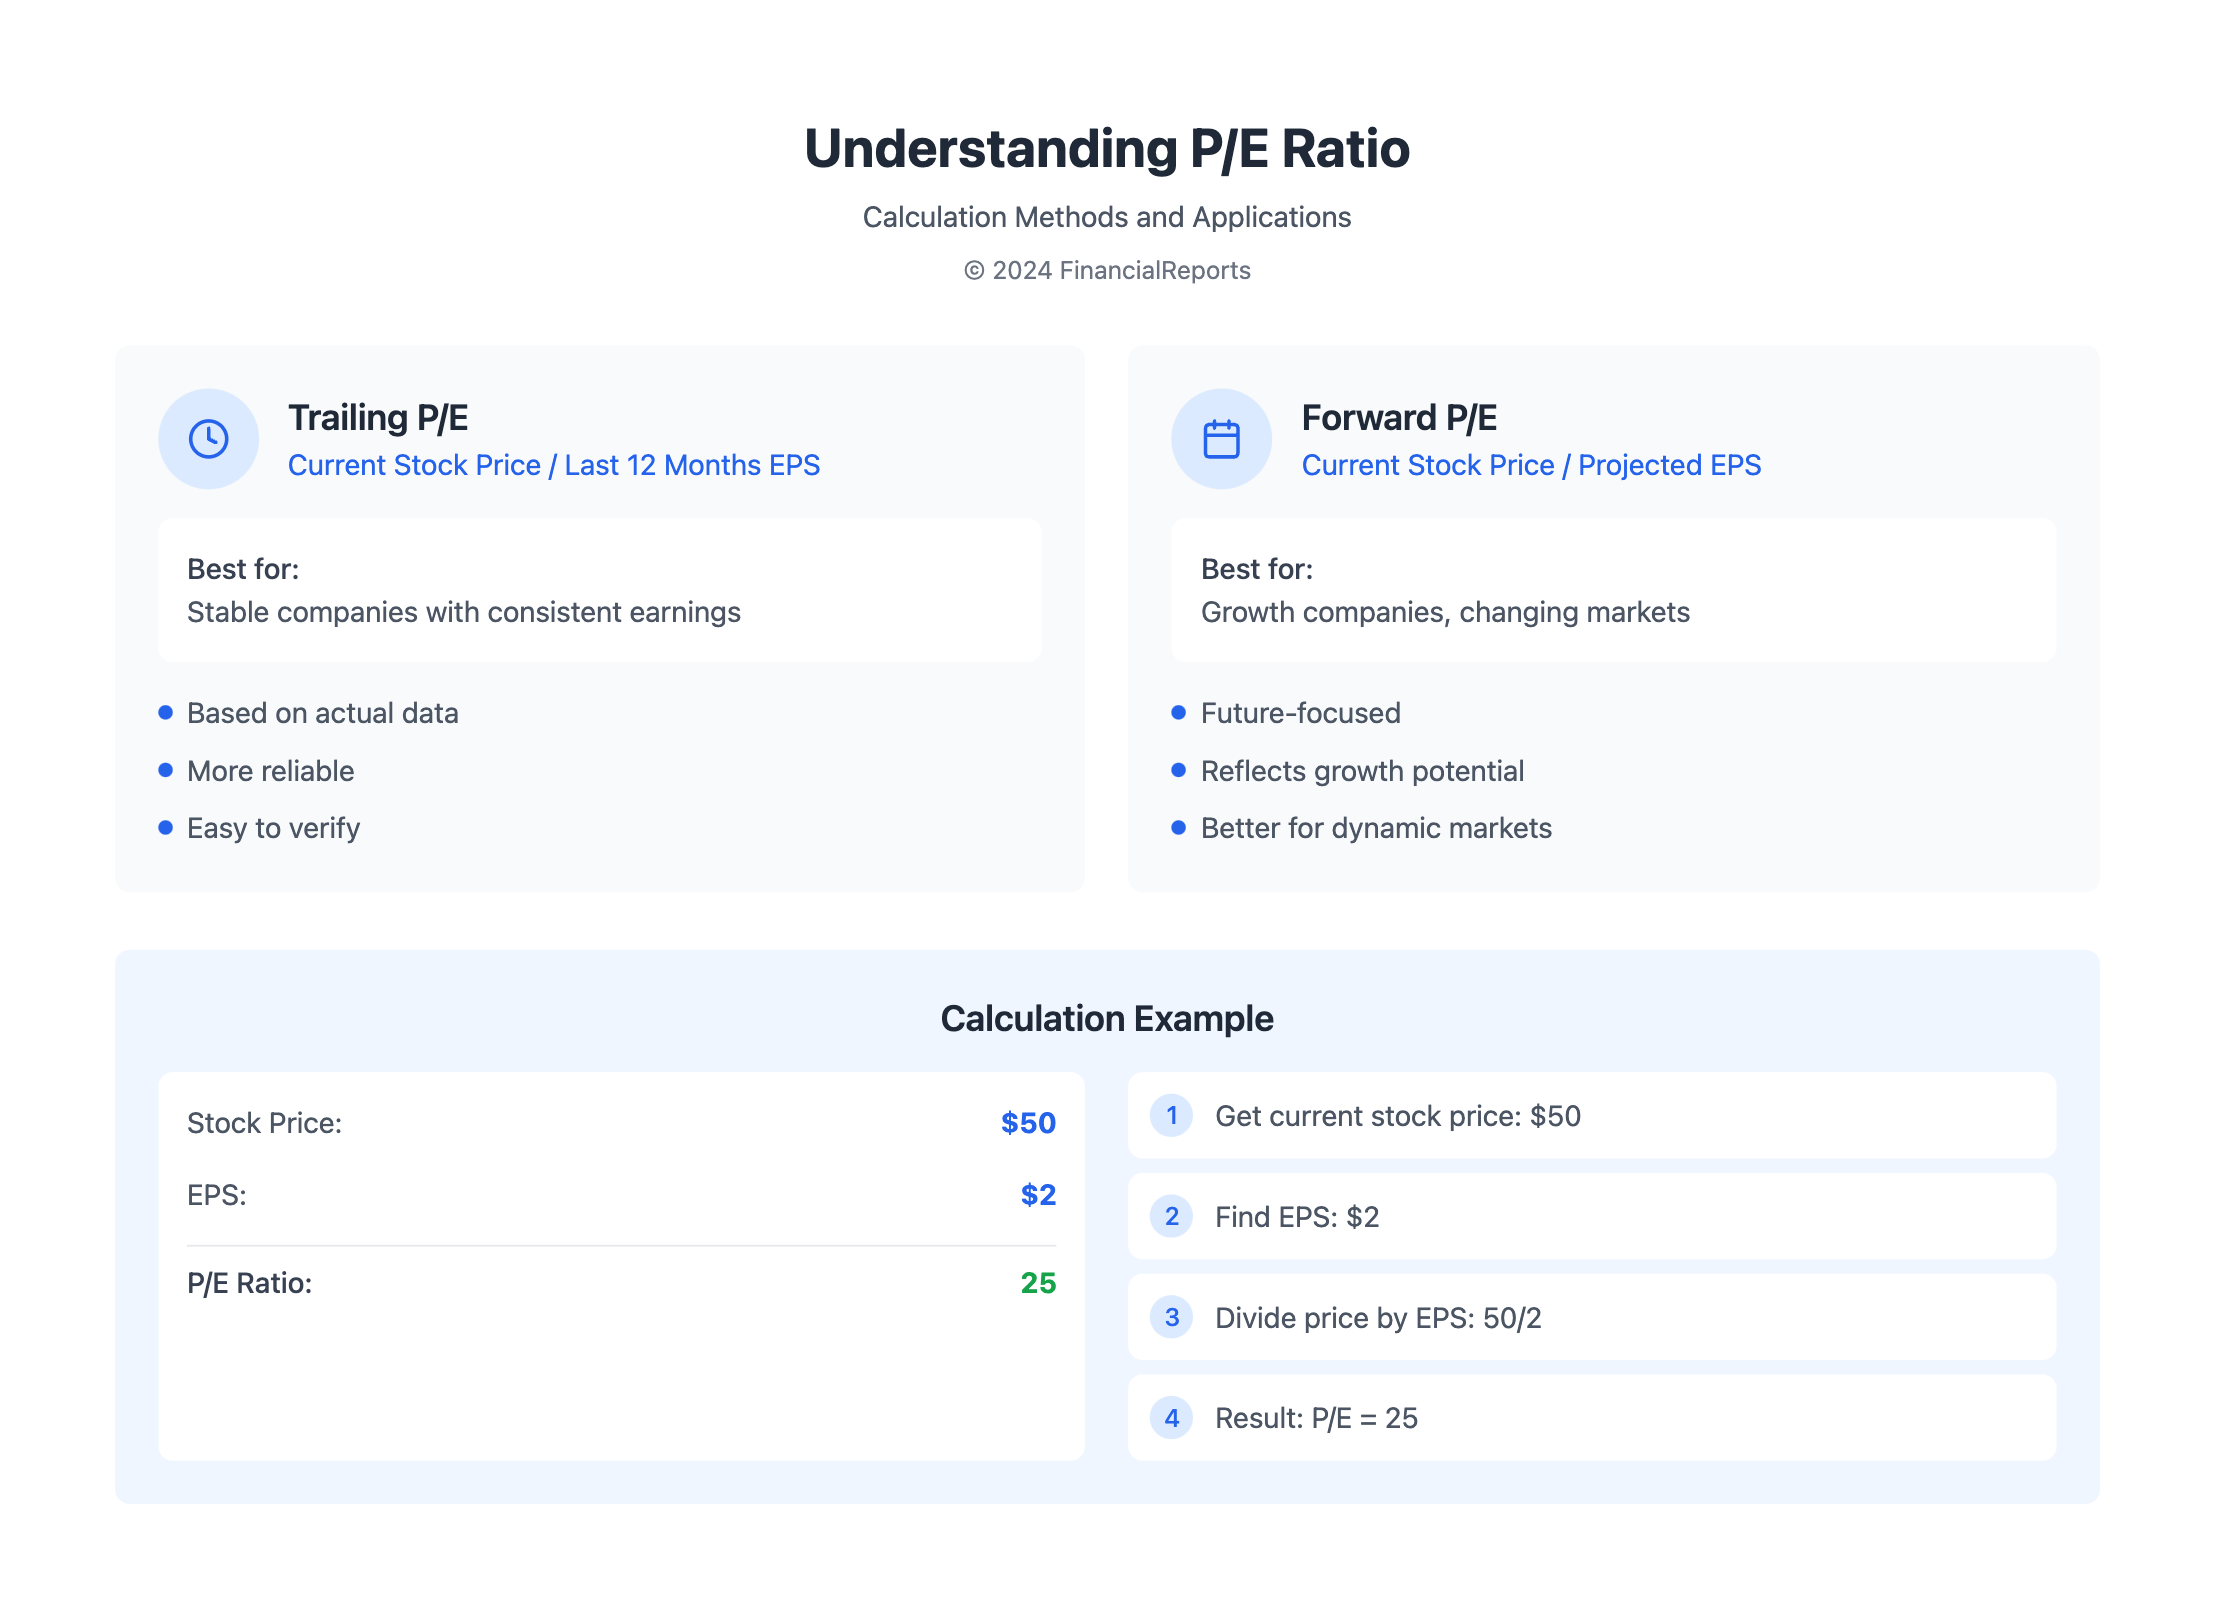
To find the price earnings ratio, you divide the stock price by the earnings per share (EPS). For instance, if the stock price is $50 and the EPS is $2, the P/E ratio is 25.
This calculation is key for evaluating a company's stock. It helps investors see if a company is growing and stable. Knowing how to calculate the P/E ratio helps investors make better choices.
Step 1: Obtaining the Stock Price
Getting the current stock price is the first step. You can find this on financial websites or through a stockbroker. It's important to use the latest stock price for accurate results.
Step 2: Finding the Earnings Per Share
The next step is to find the EPS. You can get this from the company's financial statements or a financial database. The EPS shows how profitable the company is.
Step 3: Performing the Division
After getting the stock price and EPS, you can calculate the P/E ratio. Just divide the stock price by the EPS. This simple step gives important insights into a company's performance and growth.
Interpreting the Results
When looking at the price earnings ratio, it's key to understand the price earnings multiple valuation. This helps figure out if a stock is overvalued or undervalued. A high ratio might mean investors think the company will grow a lot. On the other hand, a low ratio could mean the stock is a good deal.
The price earnings ratio is a vital tool in financial analysis. It shows how a company's stock price relates to its earnings per share. By looking at the price earnings multiple, investors can make better choices about their money.
Some important things to think about when you see the results include:
- Growth expectations: A high price earnings ratio might show investors believe in strong growth.
- Industry standards: Each industry has its own standards for price earnings ratios. It's important to compare companies in the same field.
- Market conditions: The price earnings ratio can change based on the market, like in bull or bear markets.
By carefully thinking about these points and looking at the price earnings ratio, investors can understand a company's value better. This helps them make smarter choices with their money.
Price Earnings Ratio Variations
The price earnings ratio is found by dividing the current market price per share by the earnings per share (EPS). This gives a quick look at a company's value. There are two main types: the trailing and forward P/E ratios.
The trailing P/E uses past numbers, dividing the current price by the EPS from the last 12 months.
It's key to look at these variations when checking a company's health. The forward P/E looks at future earnings, showing what's expected. On the other hand, the trailing P/E shows what's happened in the past.
Trailing vs. Forward Price Earnings Ratio
Choosing between the two P/E ratios depends on what you're looking for. The trailing P/E is good for companies with steady earnings. But, for those growing fast or with unpredictable earnings, the forward P/E is better.
Limitations of Standard Price Earnings Ratio
The standard P/E ratio has its downsides. It doesn't consider growth, which is a big issue for companies that are growing fast. Also, earnings quality matters a lot. Companies can change their earnings through tricky accounting. So, it's important to think about these things when looking at P/E ratios.
| P/E Ratio Type | Description |
|---|---|
| Trailing P/E | Based on past 12 months' EPS |
| Forward P/E | Based on projected future EPS |
In conclusion, knowing about the different P/E ratios is vital. By looking at both the trailing and forward P/E ratios and understanding the standard P/E's limits, you can really get to know a company's worth. This helps you make better investment choices.
Common Mistakes to Avoid
When using the price earnings multiple valuation, it's key to avoid common mistakes. These can lead to wrong investment choices. No single ratio can fully show a stock's value. Relying only on the price earnings multiple can be misleading.
Experts on valuation tools say a full analysis is needed to find a stock's true worth.
Some common errors include misinterpreting earnings figures. These can be changed or affected by one-time items. Also, ignoring industry context is a mistake. The price earnings multiple can differ a lot between companies in the same industry.
For example, tech companies like AMZN and TSLA often have a much higher P/E ratio than companies in other sectors, like utilities.
To avoid these mistakes, investors should look at more than one valuation metric. This includes the price-to-sales ratio, price-to-book ratio, and enterprise value-to-EBITDA ratio, along with the price earnings multiple. By using a more complete approach, investors can better understand a company's value. This helps make more informed investment choices.
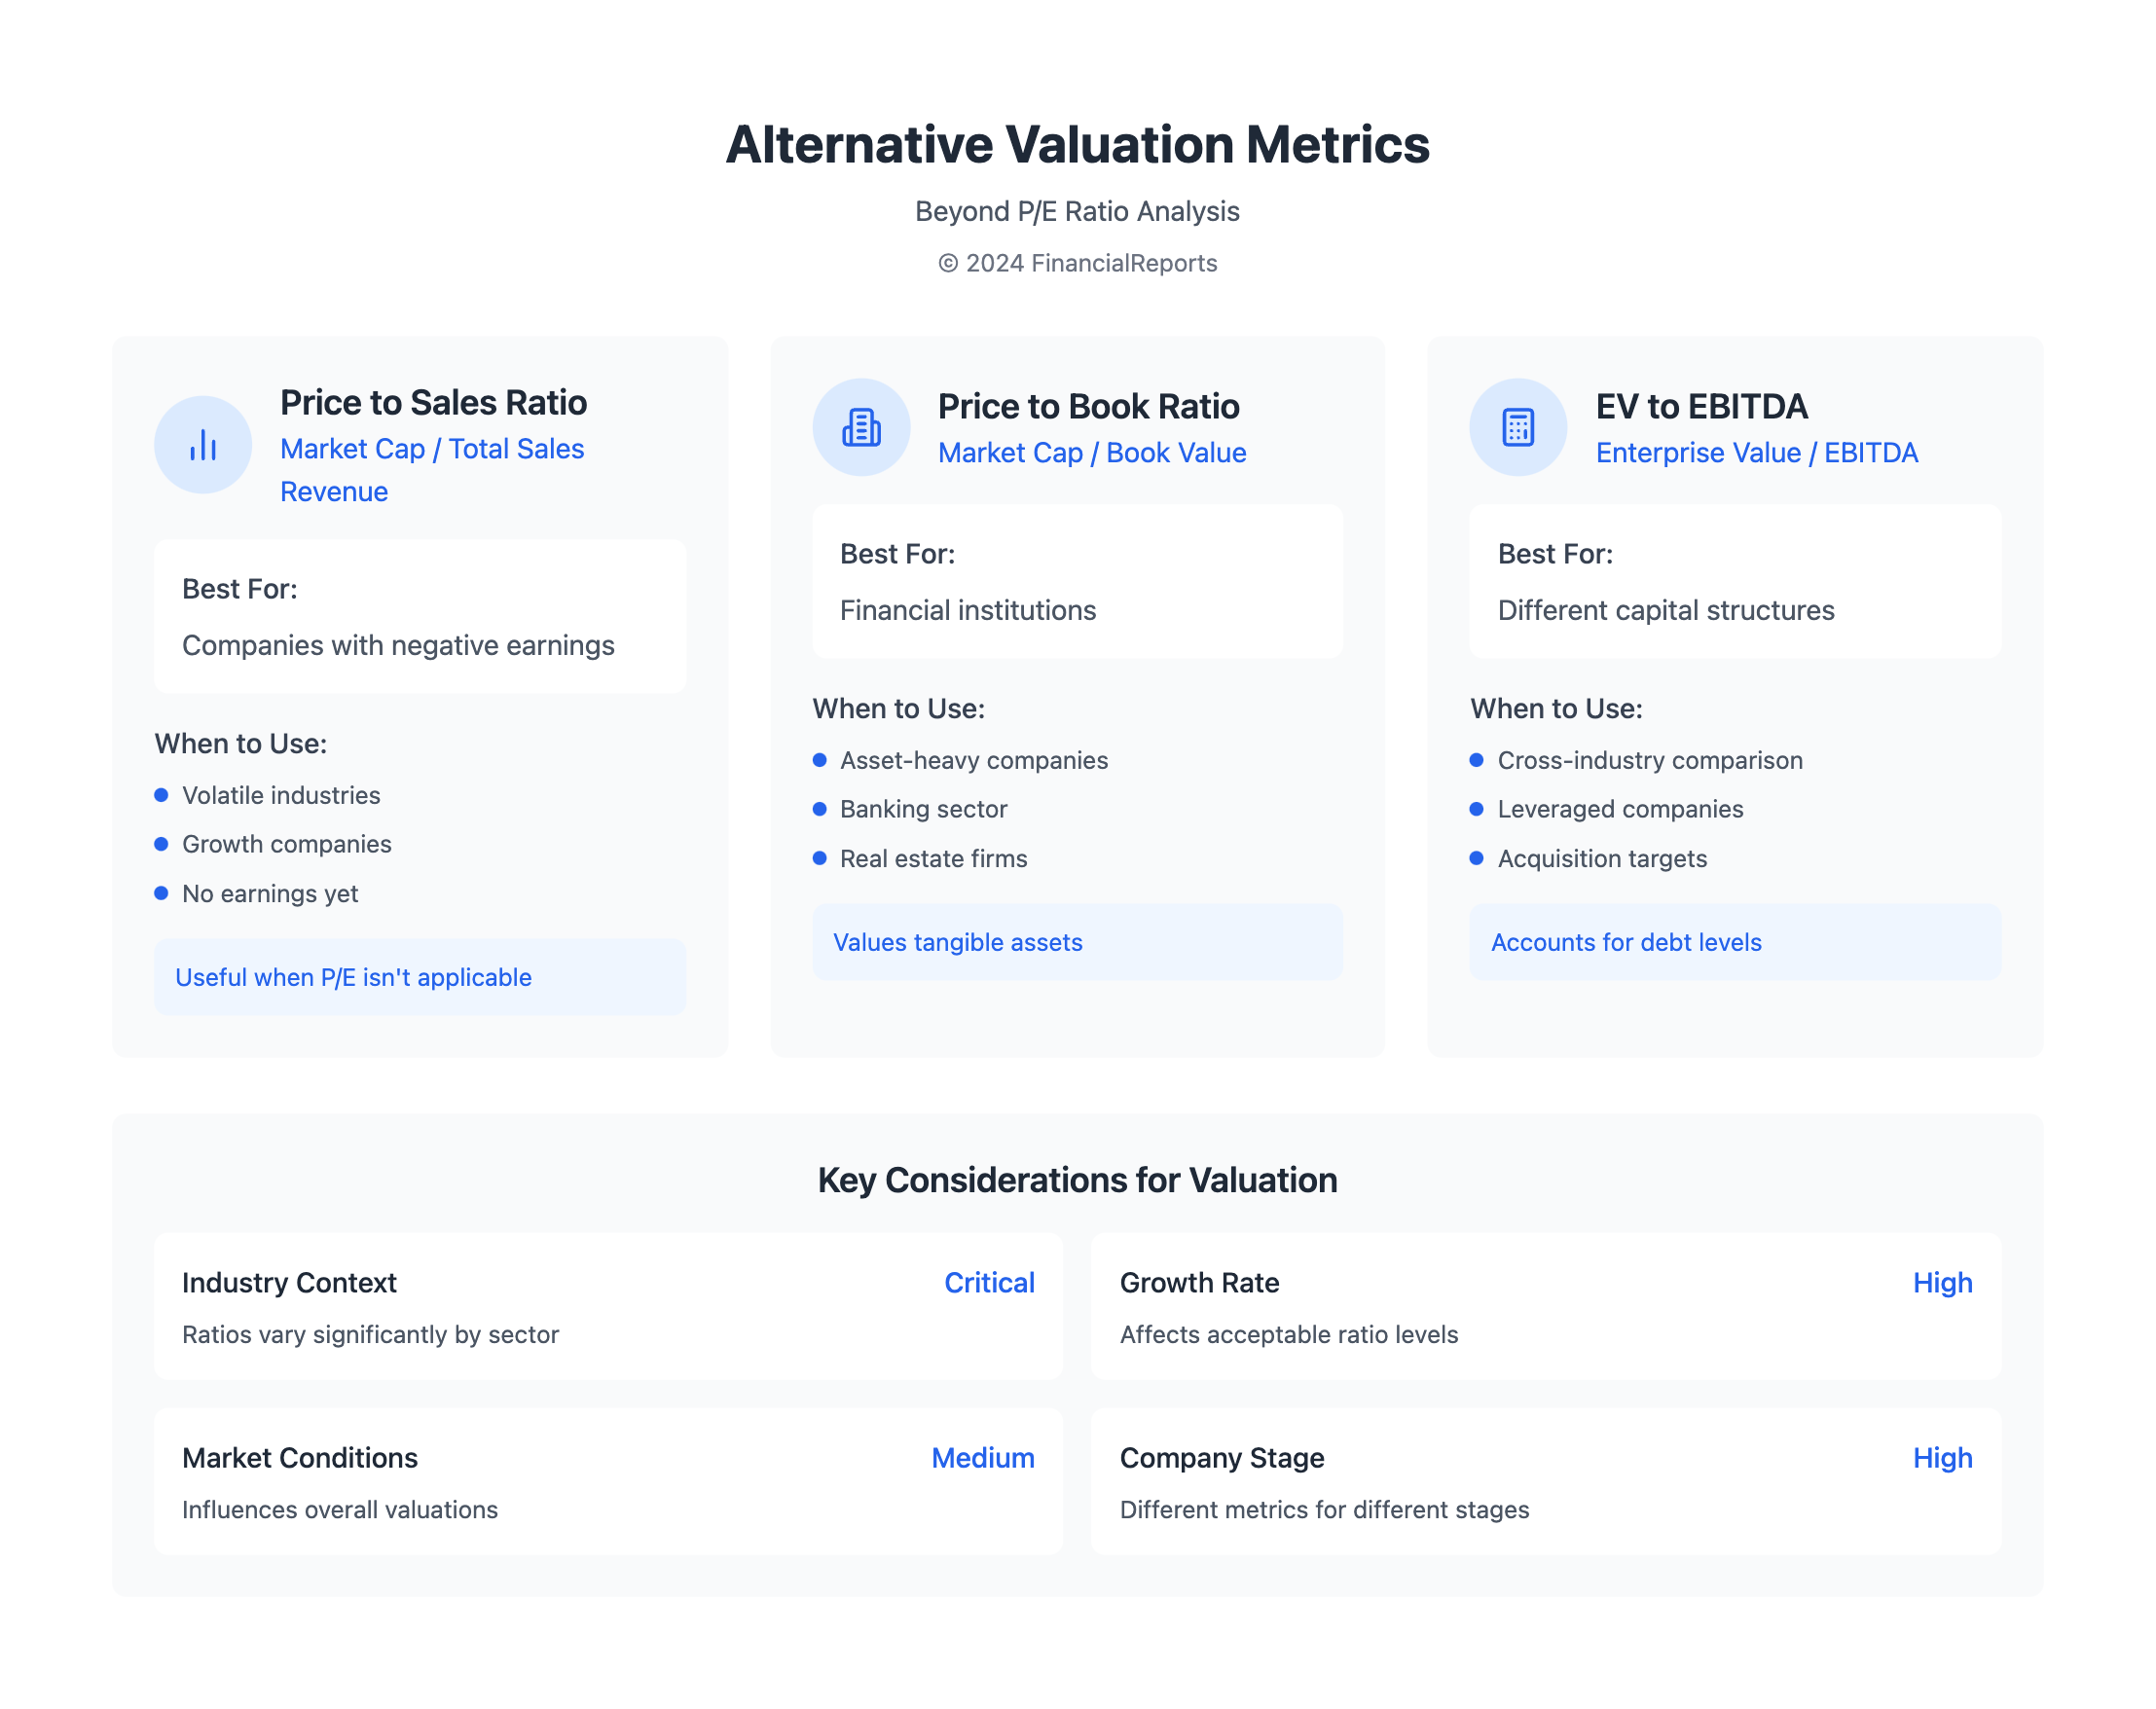
Alternative Valuation Metrics
When looking at stocks, it's key to use more than just the Price Earnings (P/E) ratio. The P/E ratio shows a company's stock price compared to its earnings per share (EPS). But, other ratios give more insights into a company's health and growth.
The Price to Sales Ratio is great for companies with no earnings or in shaky industries. It's found by dividing the company's market value by its sales.
Price to Book Ratio
The Price to Book Ratio is important for banks and companies with lots of assets. It shows how the market sees the company's assets. This ratio helps investors see the company's value.
Enterprise Value to EBITDA Ratio
The Enterprise Value to EBITDA (Earnings Before Interest, Taxes, Depreciation, and Amortization) Ratio looks at a company's whole value. It's good for comparing companies with different structures.
Using these other metrics helps investors understand a company's value better. The P/E ratio is just one part of the picture.
| Valuation Metric | Formula | Usefulness |
|---|---|---|
| Price to Sales Ratio | Market Capitalization / Total Sales Revenue | Companies with negative earnings or volatile industries |
| Price to Book Ratio | Market Capitalization / Book Value | Financial institutions and companies with significant tangible assets |
| Enterprise Value to EBITDA Ratio | Enterprise Value / EBITDA | Comparing companies with different capital structures |
Conclusion and Key Takeaways
Theprice earnings multiple valuationis a key tool for financial analysts. It helps investors understand a company's performance and future growth. A high P/E ratio might mean high market hopes, while a low one could show a stock is cheap or facing financial issues.
When using theprice earnings multiple valuationmethod, it's important to look at the bigger picture. Don't just focus on the P/E ratio alone. Comparing it with other companies in the same field gives a clearer view of a stock's value. Also, using other metrics like Price to Sales or Enterprise Value to EBITDA can give a fuller picture of a company's health.
As markets change and businesses face new hurdles, it's vital to keep up with financial analysis trends. We suggest readers keep learning and exploring new methods inprice earnings multiple valuationand other areas. With a deep and balanced approach to stock analysis, both financial experts and investors can make better choices. This helps them navigate today's complex markets.
FAQ
What is the Price Earnings Ratio (P/E Ratio)?
The Price Earnings Ratio (P/E Ratio) is a key financial metric. It's found by dividing a company's stock price by its earnings per share (EPS). It helps figure out if a stock is fairly priced.
How is the Price Earnings Ratio calculated?
To find the P/E Ratio, you divide the stock price by the earnings per share (EPS). This shows how the market values a company's earnings.
What is the significance of the Price Earnings Ratio in financial analysis?
The P/E Ratio is very important in finance. It shows how investors see a company's value and growth chances. It also lets people compare stocks in the same industry.
How does the Price Earnings Ratio reflect a company's performance?
The P/E Ratio shows what the market thinks about a company's future. A high P/E Ratio means investors think the company will grow a lot. A low P/E Ratio might mean they're not as optimistic.
What are the common variations of the Price Earnings Ratio?
There are two main types of P/E Ratios: Trailing P/E and Forward P/E. The Trailing P/E looks at the last 12 months' earnings. The Forward P/E looks at future earnings. These give different views based on the company's growth and earnings.
What are some common mistakes to avoid when using the Price Earnings Ratio?
Mistakes with P/E Ratios include misunderstanding earnings, ignoring industry factors, and only using the P/E Ratio. Always look at other financial metrics too. This helps make better investment choices.
What are some alternative valuation metrics to the Price Earnings Ratio?
Other metrics like Price to Sales Ratio, Price to Book Ratio, and Enterprise Value to EBITDA Ratio are useful. They offer different views on a company's value. Using them with the P/E Ratio gives a fuller picture of a company's finances.