How to Analyze Financial Data for Business Success
In the world of business, understanding financial data is crucial. It guides companies in making smart decisions. By closely looking at financial statements, businesses can get a clear picture of their health. This includes studying balance sheets, income statements, and cash flow statements. With deep analysis, companies turn complex data into valuable insights. Financial data analysis leads to better choices. Today, businesses use advanced tools for a sharper look at their finances. This means better management and foresight are within reach.
Key Takeaways
- Financial analysis forms the compass for navigating business strategy and success.
- Essential financial statements for analysis include balance sheets, income statements, and cash flow statements.
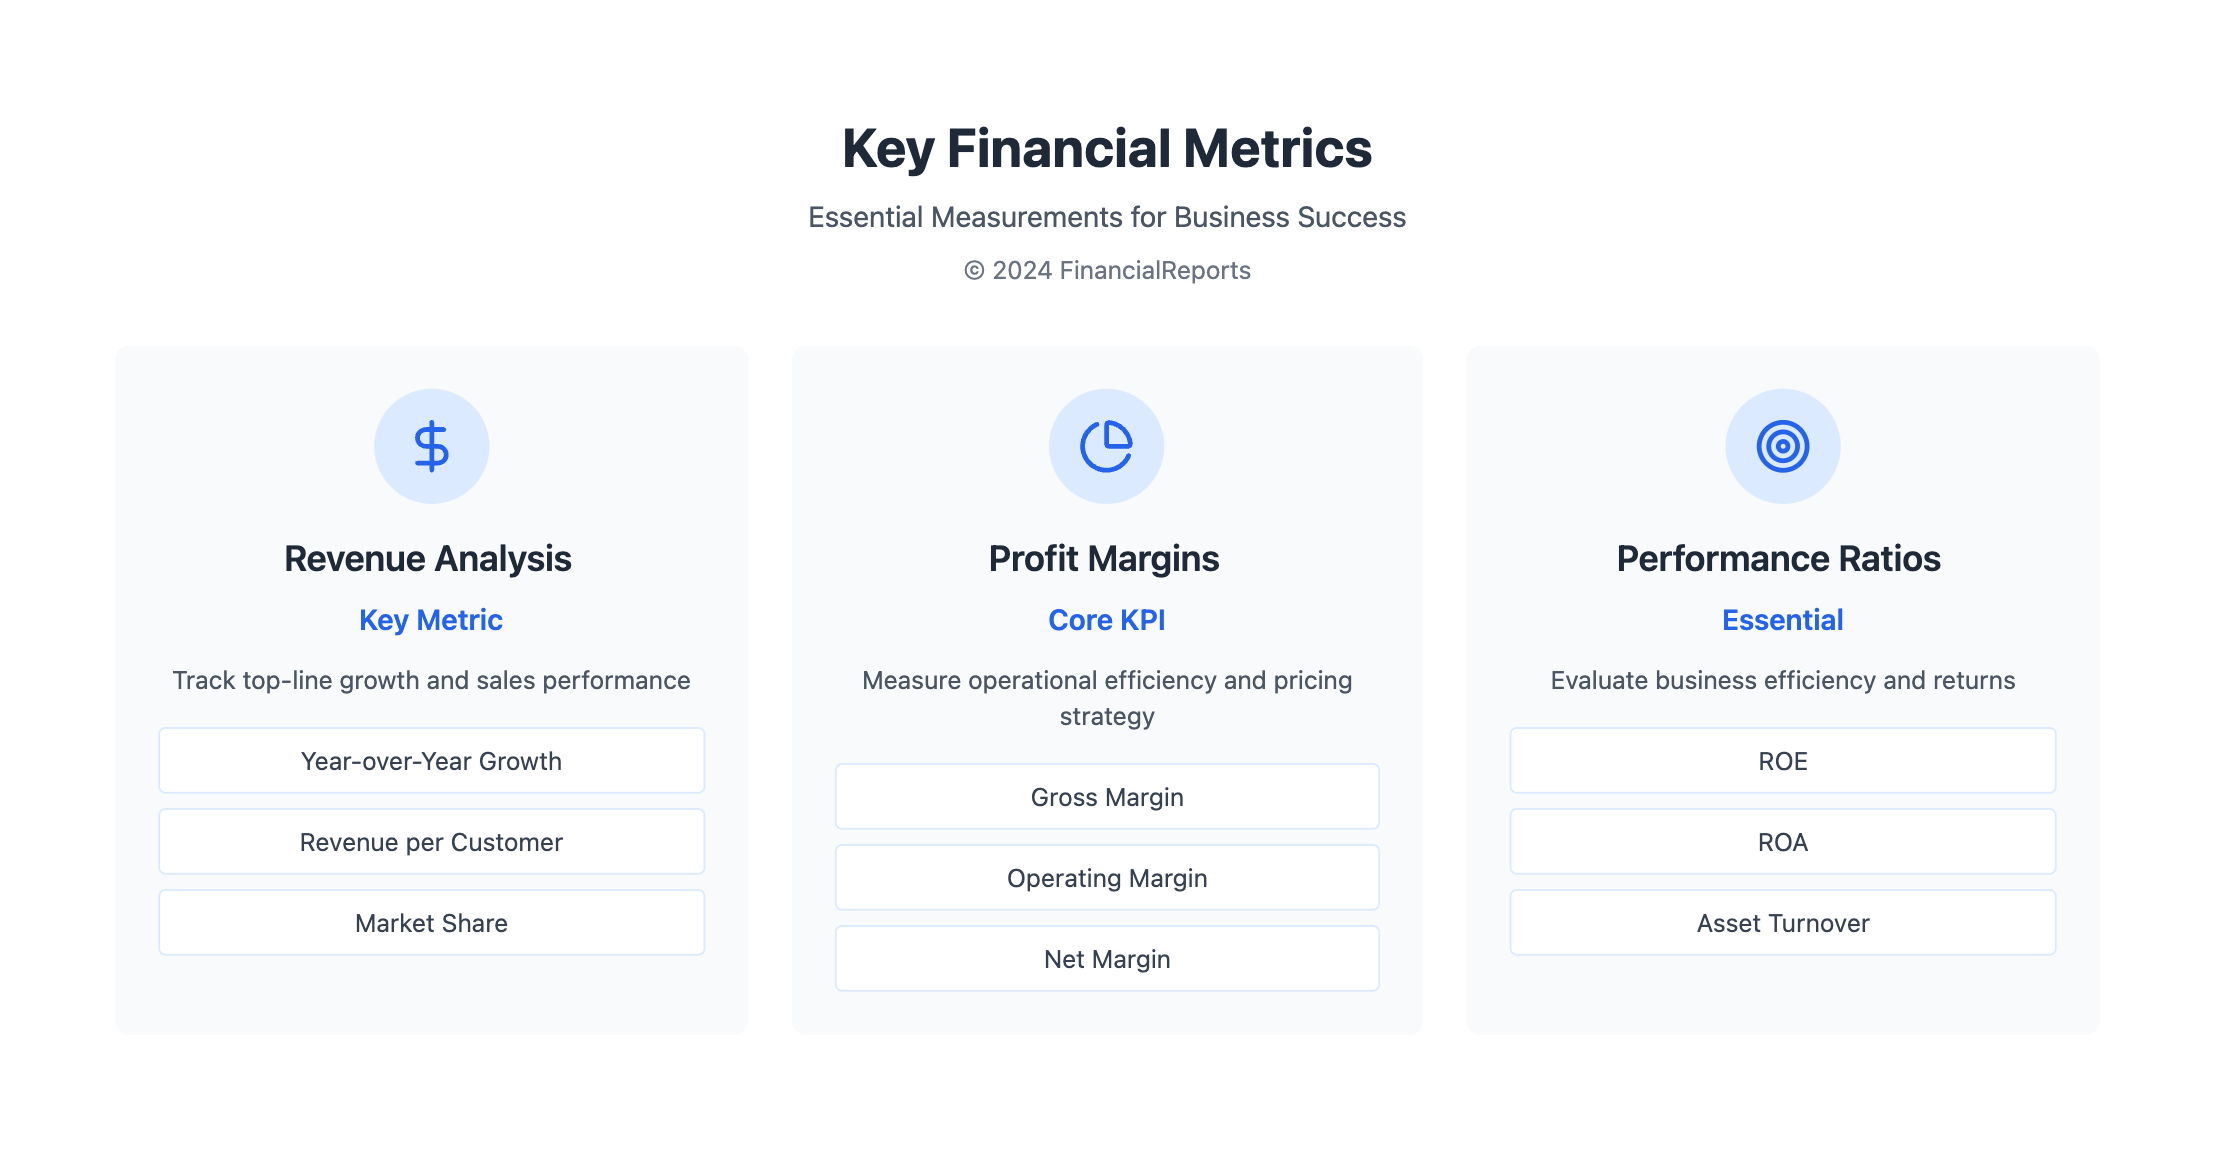
- Crucial ratios such as gross margin and net profit margin are indicators of financial health and efficiency.
- Advanced financial data analytics leverages machine learning and predictive modeling for superior forecasting.
- Comprehensive metrics like ROA and ROE provide a multifaceted view of a company's performance.
- Financial statement analysis benefits business comprehension and informed stakeholder decision-making.
- Techniques like ratio analysis and benchmarking are integral for a sound assessment of fiscal standing.
Understanding Financial Data Fundamentals
In business management, knowing how to analyze financial statements is key. These skills help leaders understand their company's current health. This lets them make smart choices. Over 75,000 companies use software like Fathom for deep financial statement analysis. This shows just how critical it is.
Key Financial Statements Explained
Understanding major financial documents is essential for good management. These documents show a company's financial activities and health. For instance, balance sheets list assets, liabilities, and equity. Income statements show earnings and expenses, revealing profitability. Cash flow statements break down how a company gets and spends cash, showing if it's liquid or not.
Types of Financial Data Businesses Should Track
Choosing and watching the right financial data is crucial. This usually includes info on revenue, expenses, profits, and cash flow. Here's why each matters: - Revenue Streams: Show where money comes from and if the business can last. - Expense Metrics: Track how well costs are managed. - Profit Margins: Are critical for seeing if the business can compete. - Cash Flow Details: Give insight into immediate financial health.
Detailed financial analysis helps in many ways. It improves communication, planning, and future performance predictions. This leads to smarter spending and better credit decisions.
| Financial Analysis Type | Usage | Benefits |
|---|---|---|
| Scenario Analysis | Projecting outcomes under various scenarios | Flexibility in planning, Risk assessment |
| Sensitivity Analysis | Assessing impact of variable changes | Precision in forecast, Better contingency plans |
| Financial Ratio Analysis | Comparative performance metrics | Operational efficiency tracking, Profitability review |
| Rate of Return Analysis | Investment performance evaluation | Investment attractiveness, Financial health indication |
Deep knowledge of financial data, with tools like Fathom, lets companies plan better and succeed more. By analyzing financial statements well, businesses can make informed moves towards long-term success.
The Importance of Financial Analysis
Understanding financial analysis is key for any business wanting to thrive. It helps a company look at its financial health and make plans to do better. This kind of analysis allows a business to check how well it's doing, organize its money better, and be clear with people involved.
With a thorough financial review, making big decisions gets easier. It shapes the plans a business makes. This is true for all types of businesses.
How Analysis Drives Business Strategy
Financial analysis is vital for making smart choices in business. It dives into details like how well investments are doing and if a business is turning its goods into cash quickly. This information is critical for a company to stay ahead in a tight market.
Take Amazon.com, for example. Their net income went from $3.2 billion in Q1 2023 to $10.4 billion in Q1 2024. Their operating profit margins also increased. This shows how good financial health helps in making profitable moves and beating the competition.
Identifying Trends and Opportunities
Financial analysis doesn't just keep a business running smoothly. It also spots chances to grow and sees upcoming risks. By looking at how well a company is doing compared to others, and checking profits, a business can stand out. It's about looking back to predict the future.
This helps in making plans that meet what the market will want. Knowing the importance of financial analysis in keeping a business healthy is crucial. Good financial analysis explains the numbers and why they're important. This way, a business can use this knowledge to succeed for a long time.
Tools and Software for Financial Analysis
In business, understanding financial information is crucial for making smart decisions. Many tools and software have been developed to make this easier. They help manage finances better and offer detailed examples of financial performance analysis.
Overview of Popular Financial Analysis Tools
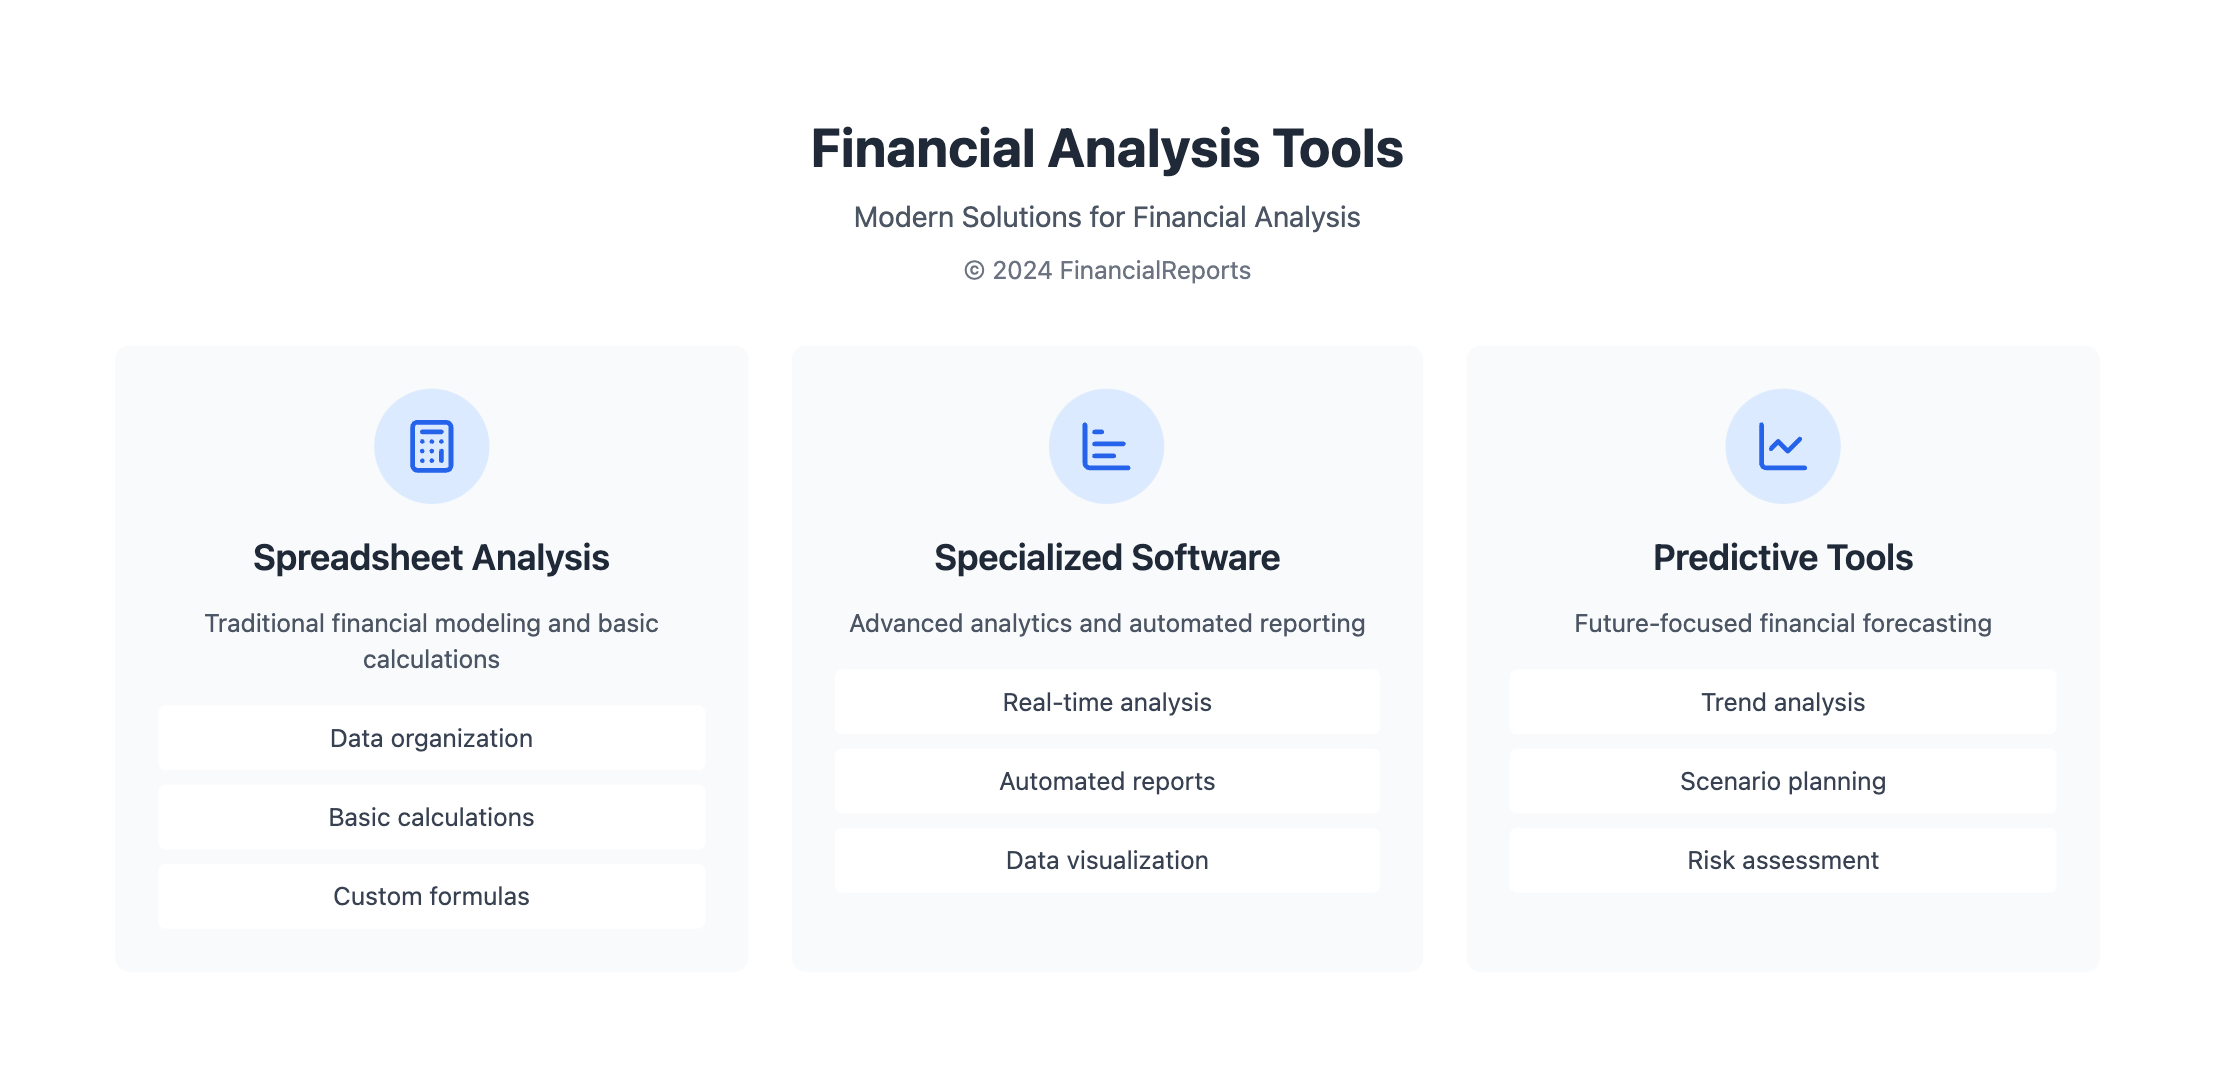
The tools available for financial analysis today go beyond old ways, like using spreadsheets. You can find advanced platforms like Oracle Essbase and QuickBooks. They also include newer ones like Vena and Cube. These tools provide live data analysis, forecast possibilities, and manage performance. They aim to increase financial accuracy and offer strategic insights.
Using Spreadsheets vs. Specialized Software
Spreadsheets are simple and adaptable, but specialized software can do more, especially with big data. This new software can automatically bring data together. This means less manual work and fewer mistakes. So, it guarantees more reliable data.
| Feature | Benefits | Examples of Tools |
|---|---|---|
| Real-time Data Analysis | Enables immediate insight into financial data, supporting quicker decision-making. | NetSuite, Domo |
| Embedded BI and AI Capabilities | Improves prediction accuracy and offers sophisticated scenario analysis. | Microsoft Power BI, Jedox |
| Automated Data Consolidation | Reduces manual data handling, enhancing efficiency and accuracy. | Vena, Planful |
| Ad Hoc Variance Analysis | Facilitates detailed financial scrutiny, identifying unexpected discrepancies. | Sage Intacct, Oracle Essbase |
| Integration with Office Applications | Streamlines workflows by seamlessly blending with familiar tools. | Anaplan, Cube |
You can choose the simple spreadsheets or go for specialized software. Both can improve your financial analysis. What you choose depends on what your business needs, how much data you have, and how deep you want to go in analysis.
Data Collection Methods
Getting accurate and complete data is key for effective financial analysis. It ensures the results are reliable and useful. Primary and secondary data each play their own important roles and offer benefits:
Primary vs. Secondary Data Sources
Primary data sources like surveys and interviews give new insights straight from people or groups involved. They use online forms to get specific demographic details. Or do interviews to gather in-depth opinions. Secondary data, like industry reports and financial records, adds extra context. This makes the insights from primary data even clearer, especially for a strong financial statement analysis sample.
Best Practices for Data Collection
To keep a 10k analysis balance income cash flow accurate, follow some key steps:
- Validation: Cross-checking information from different sources ensures it's correct.
- Cleaning: Constantly review data to catch and fix errors or duplicates.
- Data Management: Use powerful tools like Python or Tableau to organize and analyze big data sets effectively.
Knowing what financial analysis definition includes means understanding the importance of data quality and methods. Doing so leads to better predictions and choices in planning.
Interpreting Financial Ratios
Understanding and using financial ratio analysis is key in company finance. These ratios give deep insights for income statement analysis and checking a company's financial health. We will explore these important ratios and how to calculate them.
Common Financial Ratios and Their Significance
Financial ratios are tools for checking a company's efficiency and stability. Let's look at some important ratios:
- Liquidity Ratios: Such as the current ratio and quick ratio, evaluate the ability of a company to cover its short-term obligations.
- Solvency Ratios: Including debt to equity and interest coverage ratios, assess a company's capability to meet long-term obligations.
- Profitability Ratios: These include net profit margin and return on assets, crucial for examining the company’s ability to generate earnings relative to sales, assets, and equity.
- Efficiency Ratios: Metrics like inventory turnover and asset turnover focus on the management’s effectiveness in utilizing company assets.
- Market Prospect Ratios: Ratios such as P/E ratio and dividend yield, imperative for investors focusing on stock performance and company’s attractiveness in the market.
Applying and interpreting these ratios helps analysts make detailed financial assessments of a company. This enhances understanding of financial analysis.
How to Calculate Key Ratios
Knowing how to compute these ratios is crucial for effective analysis. Here's a brief outline of formulas for some key financial ratios:
| Ratio Type | Formula | Description |
|---|---|---|
| Current Ratio | Current Assets / Current Liabilities | Measures financial liquidity. |
| Debt to Equity Ratio | Total Liabilities / Shareholder’s Equity | Gauges financial leverage. |
| Net Profit Margin | Net Profit / Revenue | Assesses profitability from total revenues. |
| Inventory Turnover | Net Sales / Average Inventory | Evaluates stock management efficiency. |
| Return on Assets | Net Income / Total Assets | Indicates how profitably a company uses its assets. |
These calculations are crucial for financial analysts. They are key for in-depth ratio analysis and profitable company finance analysis.
Forecasting Financial Performance
Accurately predicting a business's financial future is vital for strategy and decisions. Financial forecasting uses different financial management analysis techniques. These techniques look at past and present data to guess future revenue, expenses, and cash flows. There are many methods for forecasting, so finance experts can choose the best one for their needs.
Techniques for Effective Financial Forecasting
To forecast finances well, picking the right methods and tools is crucial. The most common techniques in fs analysis include:
- Quantitative Methods: These methods like Percent of Sales, Straight Line, and Moving Average use numbers from the past to predict the future.
- Qualitative Methods: Methods like the Delphi Method and Market Research use expert opinions to guess future financial trends.
Tools such as pro forma statements help forecast finances by examining expected income and cash flows. This way, professionals can build detailed models for the future.
Common Pitfalls to Avoid in Forecasting
Even experts can make mistakes in financial forecasting. Some errors to watch out for include:
- Being too optimistic, which can lead to unrealistic expectations.
- Not considering the market or external factors in the forecast.
- Overfitting data to past events, which may not predict the future well.
- Not accurately estimating variable costs, affecting revenue forecasts.
Avoiding these mistakes helps in making more accurate financial plans.
| Method | Type | Common Uses |
|---|---|---|
| Percent of Sales | Quantitative | Revenue Forecasting |
| Straight Line | Quantitative | Expenses Forecasting |
| Moving Average | Quantitative | Cash Flow Analysis |
| Delphi Method | Qualitative | Market Size Prediction |
| Market Research | Qualitative | Competitor Analysis |
Effective financial forecasts provide valuable insights, helping with strategic planning and risk management. These insights are key for staying competitive and achieving long-term success.
Building a Financial Analysis Framework
Financial pros must learn how to analyze financial data effectively. Creating a solid financial analysis framework is crucial. This structure guides the review of financial statements and connects the dots with business goals. By focusing your analysis on the meaning of financial study, you go beyond just numbers. You'll find insights that matter for your business.
Steps to Create a Comprehensive Framework
- Define the Objective: Clearly state your goals for the financial analysis. Goals can vary from reviewing investment choices to checking company performance.
- Collect Data: Gather important financial info from annual reports and management notes. This ensures you have plenty of data to work with.
- Choose Analysis Methods: Select methods like Horizontal and Vertical analysis. These methods help compare data over time and with industry norms.
- Perform Ratio Analysis: Use ratios in five key areas—Liquidity, Activity, Debt, Profitability, and Market. These ratios help analyze financial trends and health.
- Analyze and Interpret Data: With tools like Lucanet for visuals, study the data to draw conclusions on financial performance.
- Develop and Present Conclusions: Turn the data into clear insights. These insights should meet your initial goals and be easy to share with others.
Incorporating Business Goals into the Framework
Adding business goals to your financial analysis makes your insights more useful and aligned with strategic aims. Using SMART goals—Specific, Measurable, Attainable, Relevant, Time-bound—is key. This makes sure your analysis stays focused and useful for decision-making. This way, financial strategies support business objectives well.
Knowing how to analyze financial statements with business goals in mind turns data into strategy. This leads to smarter decisions and helps your business last. It links number crunching and strategy planning, showing what a successful financial study should be.
| Analysis Technique | Description | Application |
|---|---|---|
| Horizontal Analysis | Compares financial data over multiple years to ascertain changes and trends. | Used to analyze growth patterns and decline rates across several periods. |
| Vertical Analysis | Expresses each amount as a percentage of a base figure within the same period. | Facilitates comparisons and highlights cost structure or revenue components. |
| Ratio Analysis | Examines relationships between different pieces of financial data. | Helps identify strengths and weaknesses in liquidity, profitability, and operational efficiency. |
Analyzing Cash Flow
Understanding how cash moves through a business is key to keeping it strong and stable. By examining cash flow closely, businesses can make wiser financial choices. Managing resources well relies on this knowledge.
Understanding Cash Flow Statements
Cash flow statements track cash entering and leaving a business, showing how liquid it is over time. They divide cash movements into operations, investments, and financing activities. For example, a report highlighted Company A making $53.666 billion from its main activities. This shows the business is doing well operationally.
Meanwhile, it spent $33.774 billion on investments and $16.379 billion on financing activities. These moves led to a positive cash flow of $3.5 billion at year's end. This boosted its cash and equivalents to $14.26 billion.
Managing Cash Flow for Business Stability
Good cash flow management helps a company pay bills on time and keep running smoothly. Watching over cash coming in and going out is crucial. Making smart choices about what you’re owed and what you owe others helps a lot.
Company A shows how it works. They maintained enough free cash flow to keep investors happy. This is key, especially in sectors that often pay dividends. Free cash is the cash left after paying for big expenses.
| Key Indicator | Company A (in billions) | Description |
|---|---|---|
| Net Operating Cash Flow | $53.666 | Cash generated from primary business operations |
| Free Cash Flow | Calculated from operating cash | Net operating cash minus capital expenditures |
| Cash from Investing Activities | $33.774 | Use of cash for investments like property and equipment |
| Cash from Financing Activities | $16.379 | Sources and uses of cash from debt and equity |
| End Year Cash Equivalents | $14.26 | Total liquid assets available at year-end |
Reviewing financial statements helps pros gain insights for growth, even in uncertain markets. Keeping an eye on cash flow details helps businesses face financial issues early. This way, they can stay stable and grow over time.
How to Analyze Profit Margins
Understanding how to do a profit margin analysis is key for a company's financial health. This finance analysis reveals how well a business turns sales into profits. It looks at gross, operating, and net profit margins in detail.
Gross, Operating, and Net Profit Margins Explained
The Gross Profit Margin shows the profit from selling products or services. It’s found by taking ((Revenue − COGS) / Revenue) × 100. For example, a 55% Gross Profit Margin means the company makes 55 cents for every dollar after costs.
The Operating Margin tells us about the company's operational efficiency. To get it, we do (Operating Income / Net Sales) × 100. If it's 31%, it means the business is doing well before taxes and interest are considered.
The Net Profit Margin includes all expenses like taxes and interest. It’s (Net Income / Revenue) × 100. A 21% Net Profit Margin means 21% of revenue is pure profit after all costs.
Strategies to Improve Profit Margins
To improve profit margins, companies can:
- Manage costs to directly raise margins.
- Optimize prices based on consumer demand and market situation.
- Increase efficiencies through better operations or technology.
- Expand into new markets for more revenue.
An analysis of profit margins should also look at industry averages. This shows how a company ranks against others and where it can improve.
| Margin Type | Calculation Formula | Example Calculation | Descriptive Insight |
|---|---|---|---|
| Gross Margin | ((Revenue - COGS) / Revenue) × 100 | 55% | Profit after COGS |
| Operating Margin | (Operating Income / Net Sales) × 100 | 31% | Core operational profitability |
| Net Margin | (Net Income / Revenue) × 100 | 21% | Total profitability |
Improving profit margins is an ongoing effort. It needs continuous finance analysis and smart planning. By using financial performance analysis examples, companies can set goals and improve profits.
Conducting a Competitor Financial Analysis
To stay ahead, companies must often look at their rivals' finances. Doing a competitor financial analysis helps companies see where they stand and plan better. It's important to know who you're up against and to gather financial data that gives you insights.
Identifying Key Competitors
With the North American Industry Classification System (NAICS), companies can figure out their main competitors. This system helps spot businesses in the same field, showing which ones might affect your strategy and performance.
Methods for Gathering Competitive Financial Data
Diving into your rivals’ finances requires different methods. You can do primary market research, like buying competitors’ products or running focus groups. Or, you can look into secondary research, checking out their websites and industry reports. Here's what you need to know:
| Analysis Type | Techniques | Frequency |
|---|---|---|
| Primary Research | Customer surveys, product testing | Bi-monthly refresh |
| Secondary Research | Industry databases, financial statements | Annual foundational review |
| Marketing Comparison | Social media, ad campaigns | Quarterly assessments |
| SWOT Analysis | Strengths, Weaknesses, Opportunities, Threats | At strategic intervals |
Looking at the "four Ps" — product, price, place, and promotion — offers a clear financial analysis example. This approach helps understand market trends and informs strategic choices.
Regularly reviewing how rivals market and operate is key. It sharpens your competitive edge and guides your market strategy.
Making Data-Driven Decisions
In this age, the power to make data-driven decisions is essential. Using detailed financial information analysis boosts financial choices. It gives a market advantage. This method relies on hard data for strategy, cutting risks, and predicting trends.
Aligning Financial Analysis with Business Decisions
Financial decision-making is improved when financial data and business strategies merge. This blend supports growth with strong data backing, focusing on indicators like profit margin, ROI, and efficiency. It leads to better business operations.
Case Studies of Successful Data-Driven Companies
Many top companies use financial information analysis for great results. For example, a global online retailer customizes ads and prices using customer data, boosting sales and happiness. A famous online streamer suggests shows based on user likes, cutting down unsubscribes.
| Company | Industry | Data Utilization | Outcome |
|---|---|---|---|
| Global Online Retailer | E-commerce | Personalized marketing and dynamic pricing | Increased sales and customer satisfaction |
| Online Streaming Service | Entertainment | Personalized content recommendations | Reduced churn rates |
| Global Coffee Brand | Retail | Optimized site selection strategy | Improved performance and higher sales |
These examples show the power of data-driven decision-making in improving finance and strategy. By valuing data-driven culture, companies make informed decisions. This leads to lasting success.
Continuous Improvement in Financial Analysis
In the finance world, continuous financial analysis improvement is key to staying ahead. Companies face a fast-changing economic scene. They need to keep their financial analysis both accurate and thorough. This requires a dedication to consistently updating and bettering analysis methods. This way, financial decisions can match up with the latest market trends.
The Role of Regular Financial Reviews
Regular financial reviews are vital for top-notch financial management. They lead to improved financial analysis, offering deeper insights and useful information. Instead of just looking for mistakes, these reviews also spot chances to save money and work more efficiently. It follows Lean and Six Sigma methods to boost a company's financial health and risk management. Advanced FP&A software plays a big role here, with its automation and real-time data access.
Adapting Analysis Techniques Over Time
Being able to change financial analysis methods is important as technology, rules, and trends shift. This includes the rise of AI in finance. As the market changes, the tools and ways we look at financial data must also evolve. Putting money into updating processes, like automation and working together on forecasts, makes financial analysis more about insight and planning than just reporting. Continual improvements mean making small changes regularly, greatly boosting the accuracy and speed of financial analyses over time. This way, financial analysis isn't just about now but also preparing for what's coming.
FAQ
What Are the Core Components of Financial Data Analysis?
Key parts of financial data analysis are looking at important financial documents. These include balance sheets, income statements, and cash flow statements. It also involves studying financial ratios and forecasting how a company will perform. This information is then used to shape business strategies and decisions.
How Do Financial Statements Aid in Strategic Planning?
Financial statements show a company's financial health. They reveal profitability, liquidity, and solvency. This data is vital for strategic planning. It helps businesses understand their financial status, set objectives, and make smart choices on spending, investment, and growth.
Why Are Financial Ratios Important in Financial Analysis?
Financial ratios turn detailed financial information into easier to understand metrics. They allow easy comparison over time or against industry standards. Ratios shed light on a company's efficiency, stability, profitability, and liquidity. These are crucial for gauging a business's health.
What Is the Difference Between Using Spreadsheets and Specialized Software for Financial Analysis?
Spreadsheets are great for organizing data and basic calculations. But specialized software has extra features for financial analysis. These include predictive analytics, data visualization, and handling large data sets. Specialized software gives deeper insights and makes analyzing complex data easier.
How Can Accurate Financial Forecasting Impact a Business?
Accurate financial forecasting is key for budgeting, planning, and managing risk. It helps predict cash flows, profits, and market trends. This lets businesses make forward-looking decisions and use resources wisely. The goal is to boost growth and profits.
What Are Some Best Practices for Financial Data Collection?
Good practices for collecting financial data include making sure the data is accurate and reliable. Use both primary and secondary sources for a full analysis. Keep data sets updated and clean. Use tech to make collecting data easier and more efficient.
How Should Businesses Approach the Development of a Financial Analysis Framework?
When making a financial analysis framework, start with clear goals. Define the main things to measure, gather accurate data, and then analyze deeply. The framework should match business aims and be flexible for changes.
What Are Some Common Pitfalls in Financial Forecasting?
Mistakes in financial forecasting include relying too much on past data and being too optimistic. Not considering market changes and big economic factors is also risky. To avoid these, consider several scenarios and use a data-based approach for different possible outcomes.
Why Is Cash Flow Analysis Critical for Business Stability?
Cash flow analysis is crucial for understanding a business's liquidity. It shows if there is enough cash to meet expenses and liabilities. Good cash management helps a business stay up and running, grow, and stay solvent.
How Do Businesses Conduct a Competitor Financial Analysis?
To analyze competitors, collect financial data from various sources. Use analysis tools to compare performance indicators. This reveals strengths and areas to improve.
What Role Does Regular Financial Review Play in Continuous Improvement?
Regular financial reviews are key for ongoing betterment. They ensure data is right, refine analysis methods, and keep analyses up-to-date with the market and laws. This makes financial reports accurate and relevant.