Financial Analysis Report Example: Best Format Guide
An effective financial analysis report is key for businesses. It showcases their financial wisdom to investors and stakeholders. It offers an in-depth look at the company's economic status.
This kind of report helps make important investment decisions. It provides the vital details investors need to know before putting in their money. It shows where capital allocation is best.
Such reports meet the Securities and Exchange Commission's standards for U.S. public firms. They're more than just mandatory paperwork. They also spotlight a company's financial highs and lows.
Using financial statements, these reports reveal much about a firm's future financial path. Balance sheets, income statements, and cash flow statements are combined to tell this story. This tool is crucial for understanding complex financial information.
Key Takeaways
- Essential for illustrating financial stability and attracting investment.
- Must include SEC-mandated financial statements for publicly listed companies.
- Returns on investment ratios and valuation methods gauge company's stock value.
- Ratio analysis, risk assessment, and investment analysis are integral components.
- Detailed sections provide visual summaries of financial status using charts and graphs.
- Annual and monthly reports offer different temporal snapshots of financial well-being.
- Clearly structured and researched reports bolster transparency and financial clarity.
Introduction to Financial Analysis Reports
Financial Analysis Reports are key for making smart money decisions and finding ways to grow economically. They help manage financial data, letting organizations figure out how they're doing financially and where they're headed. We'll talk about why these reports matter, what they're for, and what's in them.
Importance of Financial Analysis
Understanding financial health and results is crucial. This knowledge informs choices, shapes investment plans, and shows where growth is possible. By looking at different financial measures, stakeholders can make choices that fit both now and the future.
Purpose of the Report
The main goal of a financial analysis report is to give a clear and full picture of a company's financial path. It helps in managing financial data by gathering, studying, and presenting financial info. This supports strategic planning and managing risks. Decision-makers get the info they need, leading to smarter financial steps.
Key Components of Financial Analysis
Good financial analysis reports have several important parts, each boosting the business strategy. Here's a brief look at these key pieces:
| Component | Description | Impact on Decision Making |
|---|---|---|
| Profitability Ratios | Metrics like Net Profit Margin, ROA, and ROE show how well money is managed and used. | Helps choose investments and changes to increase profits. |
| Liquidity Ratios | Numbers like the Current Ratio and Quick Ratio check if the firm can pay off short-term debts. | Makes sure the company can handle unexpected money needs, keeping finances steady. |
| Solvency Ratios | Figures such as Debt-to-Equity Ratio and Interest Coverage Ratio look at long-term financial health. | Aids in planning how to manage debt and fund projects for growth. |
| Market Value Ratios | Metrics like P/E Ratio and EPS show a company's worth and market standing. | Affects how investors see the company and its market strategy, showing performance and prospects. |
So, financial analysis reports are essential in giving structured insights into a company's financial condition. They improve how financial data is handled, strengthen decision-making in finances, and help find economic growth chances.
Common Types of Financial Analysis Reports
Financial analysis reports are key for businesses to keep and boost their financial health. Each report shines a light on different financial areas such as liquidity, profitability, and how a business compares to others in its sector.
Standard Financial Statements
Standard financial statements are crucial for financial analysis. They show a company's financial status at a certain time. These statements include the balance sheet, income statement, and cash flow statement. Together, they give a full view of the company's financial journey and how well it operates.
Ratio Analysis
Ratio analysis is a vital method to evaluate a company’s financial metrics. This includes looking at liquidity ratios and profitability ratios.
It highlights key figures like Return on Assets (ROA) and Earnings Per Share (EPS). These figures help understand a company's financial health and its efficiency. For example, ROA indicates how well a company uses its assets to make money. Liquidity ratios, like current and quick ratios, assess if a company can pay its short-term debts.
Comparative Financial Analysis
Comparative financial analysis is crucial for setting benchmarks in the industry and spotting financial trends. It compares a company's financial metrics against those of its competitors. This is done side-by-side, often using horizontal and vertical analyses. These insights show where a company stands against its competitors and its market performance.
For example, operating margins reveal a lot about a company's operational effectiveness and profit levels. A case in point is Amazon, which saw its operating margin increase from 3.7% in 2023 to 10.7% in 2024. This kind of information is invaluable for understanding improvements and profitability.
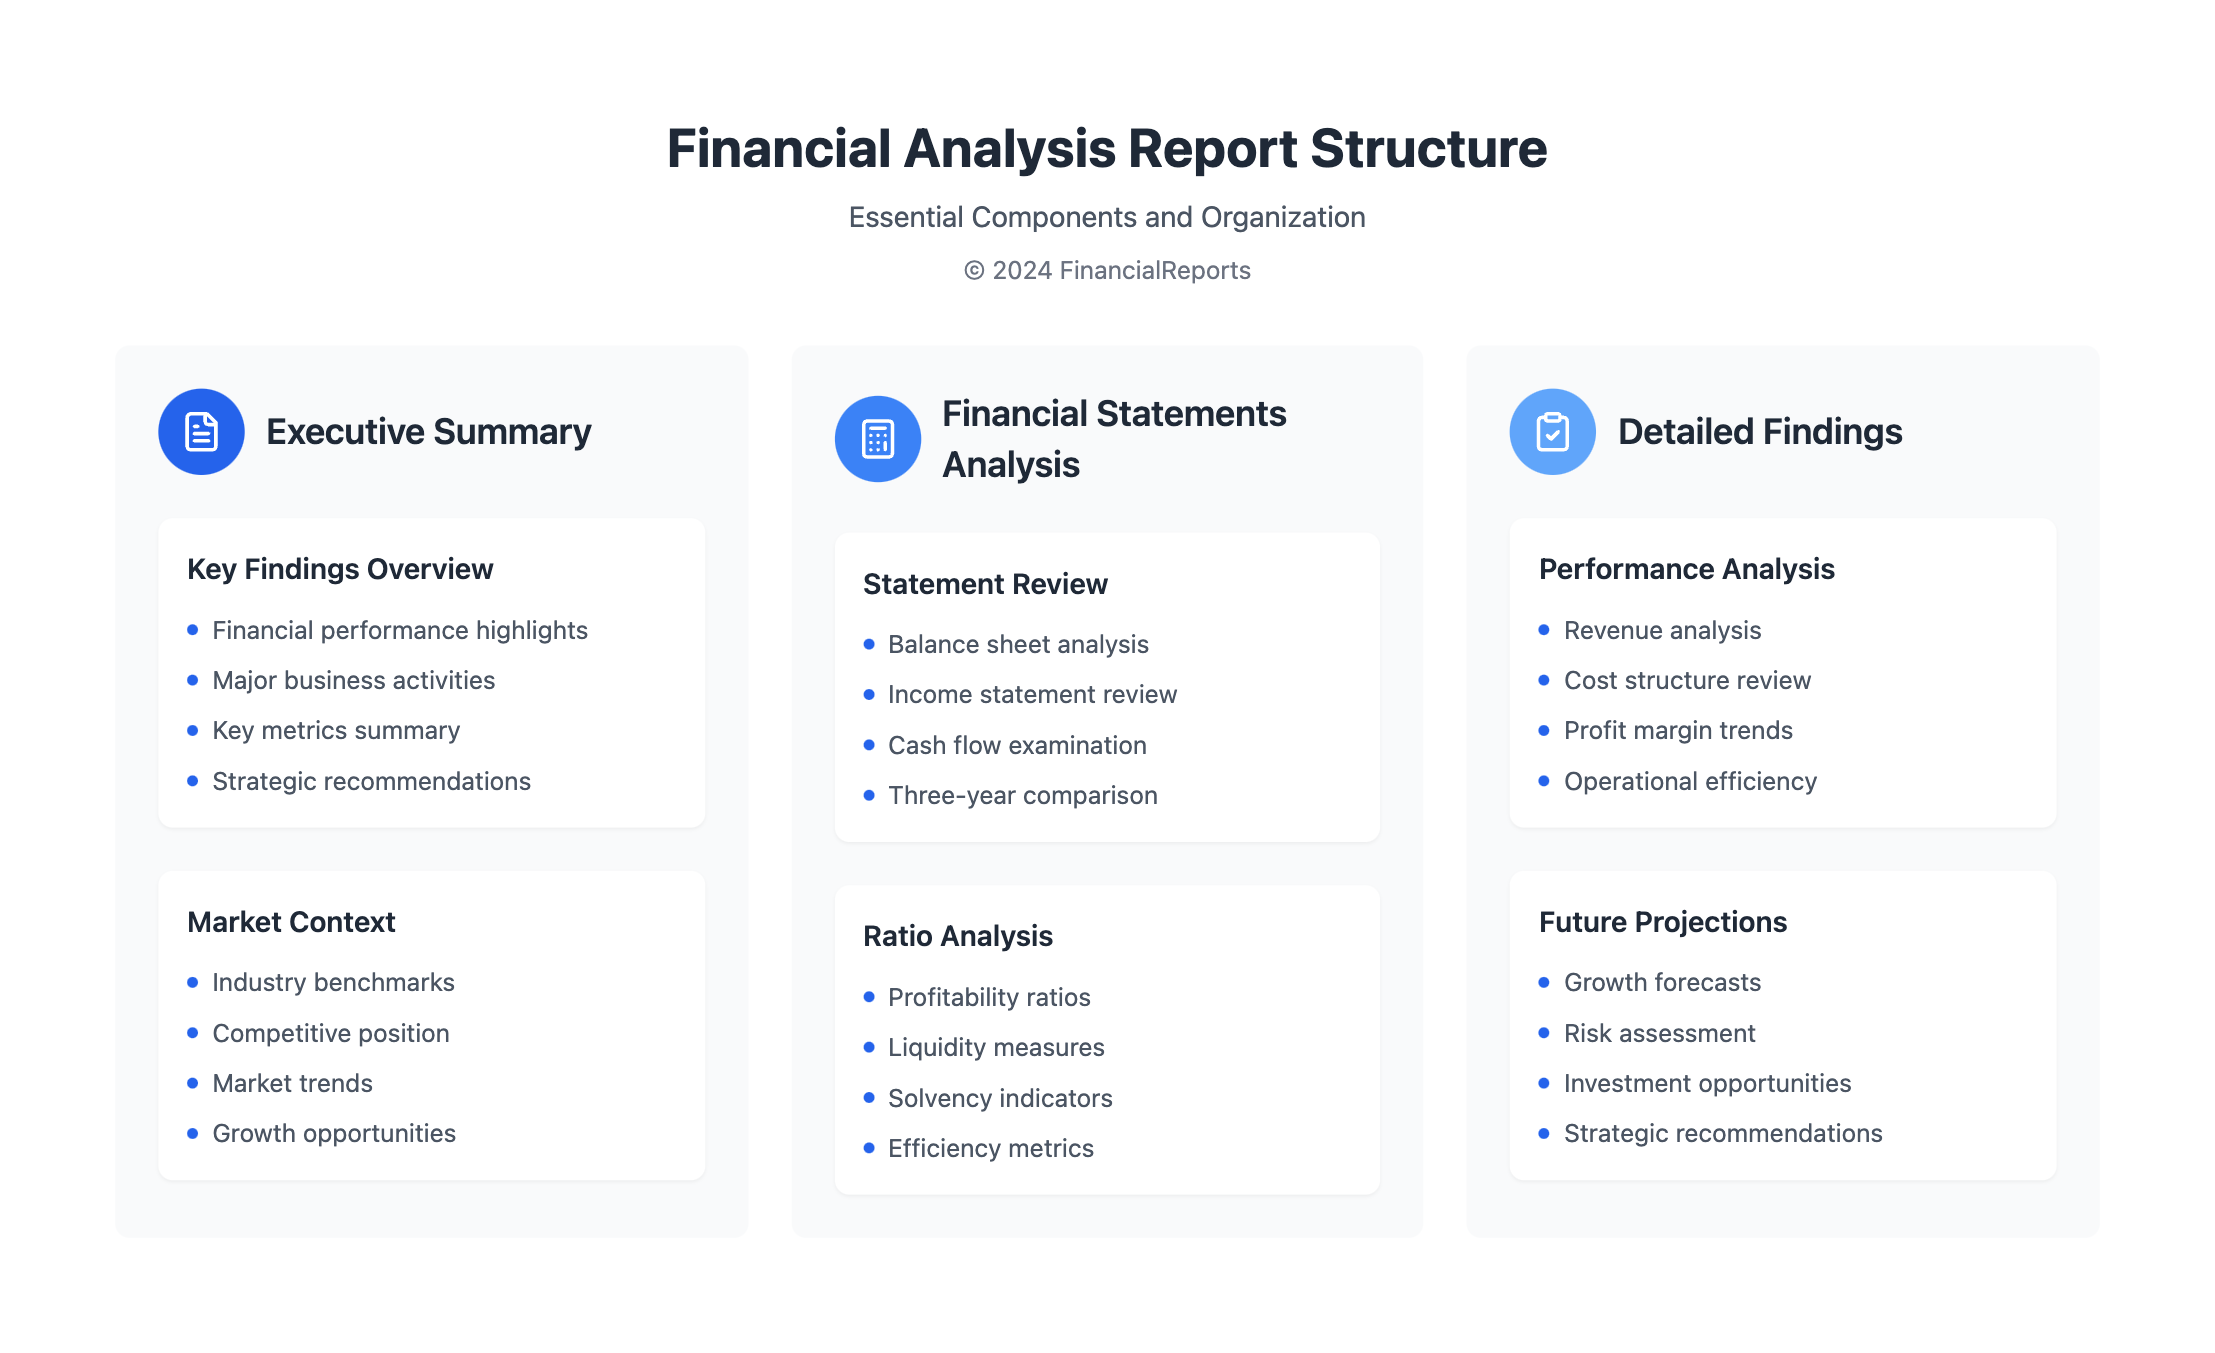
Structure of a Financial Analysis Report
A financial analysis report is vital for understanding a company's health and future plans. It includes several important sections. Together, these sections give a full view of the company's financial status and what they plan next.
Executive Summary
The executive summary gives a brief look at the company's financial performance. It focuses on major financial metrics and important business activities. This helps readers quickly get the main points about the company's financial health and trends. The summary prepares readers for a deeper look into the findings.
Detailed Findings
The detailed findings section goes into the company's finances with great attention to detail. It looks at financial statements, such as the balance sheet and income statements, over the last three years. This offers an in-depth analysis of the company's money matters.
It doesn't just stick to usual financial measures. The section also looks into cash flows, changes in equity, and examines the footnotes for extra insights. It helps readers understand the company's financial performance and health in great detail.
Components of the Financial Analysis Report
Today's market leaders need clear financial insights. A well-crafted Financial Analysis Report is crucial. It opens up an organization's fiscal story by closely examining important financial information. This helps highlight how well the company is performing and its overall health.
Financial Statements Overview
A solid financial analysis report starts with a detailed look at financial statements. These documents are key for understanding a company's financial actions and position. Important parts include the balance sheet, income statement, and cash flow statement. Each gives important insights into the company's financial well-being.
Key Financial Ratios
Digging into key financial ratios can tell us a lot about a business's performance and stability. Such ratios include:
- Profitability Ratios: Ratios like the Net Profit Margin show how well revenue turns into profits. They are important for understanding overall financial health and cash management.
- Liquidity Ratios: This includes the Liquidity Ratio formula (Assets/Liabilities). It's key for checking the business’s short-term financial stability.
- Solvency Ratios: Ratios such as Solvency Ratio (Debt/Shareholder Equity) assess long-term obligation capability. They give insights into debt management.
- Operational Efficiency Ratios: These ratios evaluate asset use in earning generation. The Operating Expense/Revenue ratio is a key metric here.
Each ratio provides critical data for a deep understanding of financial positioning. This info helps identify strategic improvement areas.
Summary of Findings
The Summary of Findings offers key insights from financial statement and ratio analysis. It turns complex information into understandable, useful points. Stakeholders can see what's working and what needs improvement. This is crucial for strategic decisions, focusing on making operations more efficient, handling risks, and planning growth.
Integrating these elements, a Financial Analysis Report shows a company's financial status. It also guides strategic improvements. This ensures the company's growth and survival in a competitive market.
How to Prepare a Financial Analysis Report
Creating a financial analysis report is key to knowing a company’s financial strength and its future. This process involves several important steps. It starts with gathering data, goes through a detailed analysis, and ends with drafting the report. This guide will focus on critical steps like forecasting using data, predicting through financial models, and assessing investment potential.
Gathering Financial Data
Collecting essential financial data is the first step in financial analysis. You start with the income statement. This shows a company's profitability over time by listing revenue, expenses, and net income. Next, the balance sheet gives a snapshot of the company’s financial position, showing assets, liabilities, and shareholder equity. The cash flow statement then tracks the flow of cash in and out, revealing how well the company generates cash. Additional checks like trial balances ensure the accuracy of all records.
Analyzing the Data
Once you have the financial data, analysis begins. Analysts use data forecasting to predict future trends from past data. They calculate financial ratios such as gross profit margin and operating ratio. These measures help assess profitability, efficiency, and liquidity. Such analysis helps create predictions about the company’s growth and sustainability. It aids in strategic decisions and points out areas that need improvement.
Drafting the Report
The final step is to draft the financial analysis report. This document combines data and insights. It starts with financial statements, followed by a detailed analysis. The analysis discusses findings from the financial models and their investment implications. Charts and graphs might be used here to easily show the company's performance against industry benchmarks.
| Ratio | ABC Company | XYZ Company |
|---|---|---|
| Current Ratio | Better positioned | Lower ability to repay short-term debts |
| Quick Ratio | Superior instant obligation coverage | Less coverage |
| Net Profit Ratio | Lower profitability | Better at converting revenue into actual profit |
| Return on Equity | Lower return to shareholders | Higher value generation for equity holders |
| Debt to Equity Ratio | Higher leverage, greater risk profile | Better debt management |
This detailed approach includes data collection, precise analysis, and careful drafting. It helps each report offer a comprehensive understanding of a company's operations, financial health, and potential for investment. This way, the report makes the company's financial status clear and guides investment decisions.
Formatting Your Financial Analysis Report
When it comes to financial reports, how you present the info is key. A well-crafted report shows your professionalism. It also makes complex data easier to understand. By focusing on a professional report design, using accessible financial visuals, and keeping a consistent style, your financial stories become both compelling and user-friendly.
Report Layout Guidelines
A good report starts with a clear layout. It should have sections like an executive summary, analysis body, and conclusions. These sections should flow smoothly, leading the reader through your findings. Use headers, subheaders, and a table of contents for easy navigation. This helps both skimmers and deep divers find what they need.
Use of Visuals and Charts
Financial data can be hard to grasp. Charts and graphs make this information more accessible. You might use bar charts, line graphs, and pie charts for showing trends or demographics. Make sure every visual has a title, a short description, and labeled axes. This helps readers understand the data quickly.
Consistent Style and Font
The fonts and styles you choose are more important than you might think. They ensure your report is easy on the eyes. Stick to professional fonts like Times New Roman or Arial, and use at least 11 pt size for the body text. Larger fonts should be reserved for section titles. Keeping a uniform color scheme, bullet points, and text alignment makes your report look professional. This focus keeps readers engaged with the content, not distracted by the design.
| Year | Total Assets ($) | Total Liabilities ($) | Net Fixed Assets ($) |
|---|---|---|---|
| 2007 | 1,149,939 | 1,070,826 | 384,253 |
| 2008 | 1,216,614 | 1,121,601 | 412,458 |
Adding these features to your financial reports boosts their readability. And it aids in making a user-friendly financial report. Clear designs, insightful visuals, and uniform formatting elevate your report's impact. It makes it more usable and well-received.
Sample Financial Analysis Report Templates
Sample financial analysis report templates help create reports easily. They are streamlined for various business needs. These templates are perfect for understanding key finances and using industry analysis.
Basic Template Example
The basic template is simple, ideal for any business. It uses adaptable financial templates. The focus is on important financial statements and key performance metrics like:
- Revenue and Profit
- Operating Expenses
- Gross and Net Profit Margins
These aspects are key to evaluating company performance. They are the base for a monthly financial review.
Detailed Template Example
Detailed templates go into the financial details of a company. They have sections such as:
- Financial Modeling
- Scenario Analysis
- Risk Management and Mitigation Strategies
They use lots of data, like past financials and forecasts. This helps in deep analysis and making strategic choices.
Industry-Specific Templates
Some businesses need specific solutions. Industry-specific templates are made for this. They focus on standards and metrics for sectors like:
- Banking and Financial Services
- Healthcare
- Manufacturing
They're tailored for watching industry performance closely. These templates help tailor financial analysis to fit sector needs.
| Feature | Basic Template | Detailed Template | Industry-Specific Template |
|---|---|---|---|
| Customization Level | Low | High | Medium to High |
| Key Metrics Included | Revenue, Profit Margins, Expenses | All Basic + Advanced Financial Projections, Risk Analysis | Industry-dependent Metrics, Competitive Benchmarking |
| Best Suited for | Small to Medium Businesses | Large Corporations, Complex Business Structures | Specialized Industries with Specific Compliance Requirements |
| Tool Support | Excel, Simple Financial Software | Advanced Financial Modeling Software like Tidemark | Industry-specific Tools and Platforms |
Using these templates makes finance documentation better. It helps in industry analysis frameworks. It also makes the streamlined creation of reports easier. This supports decision-making and analyzing stakeholders’ needs.
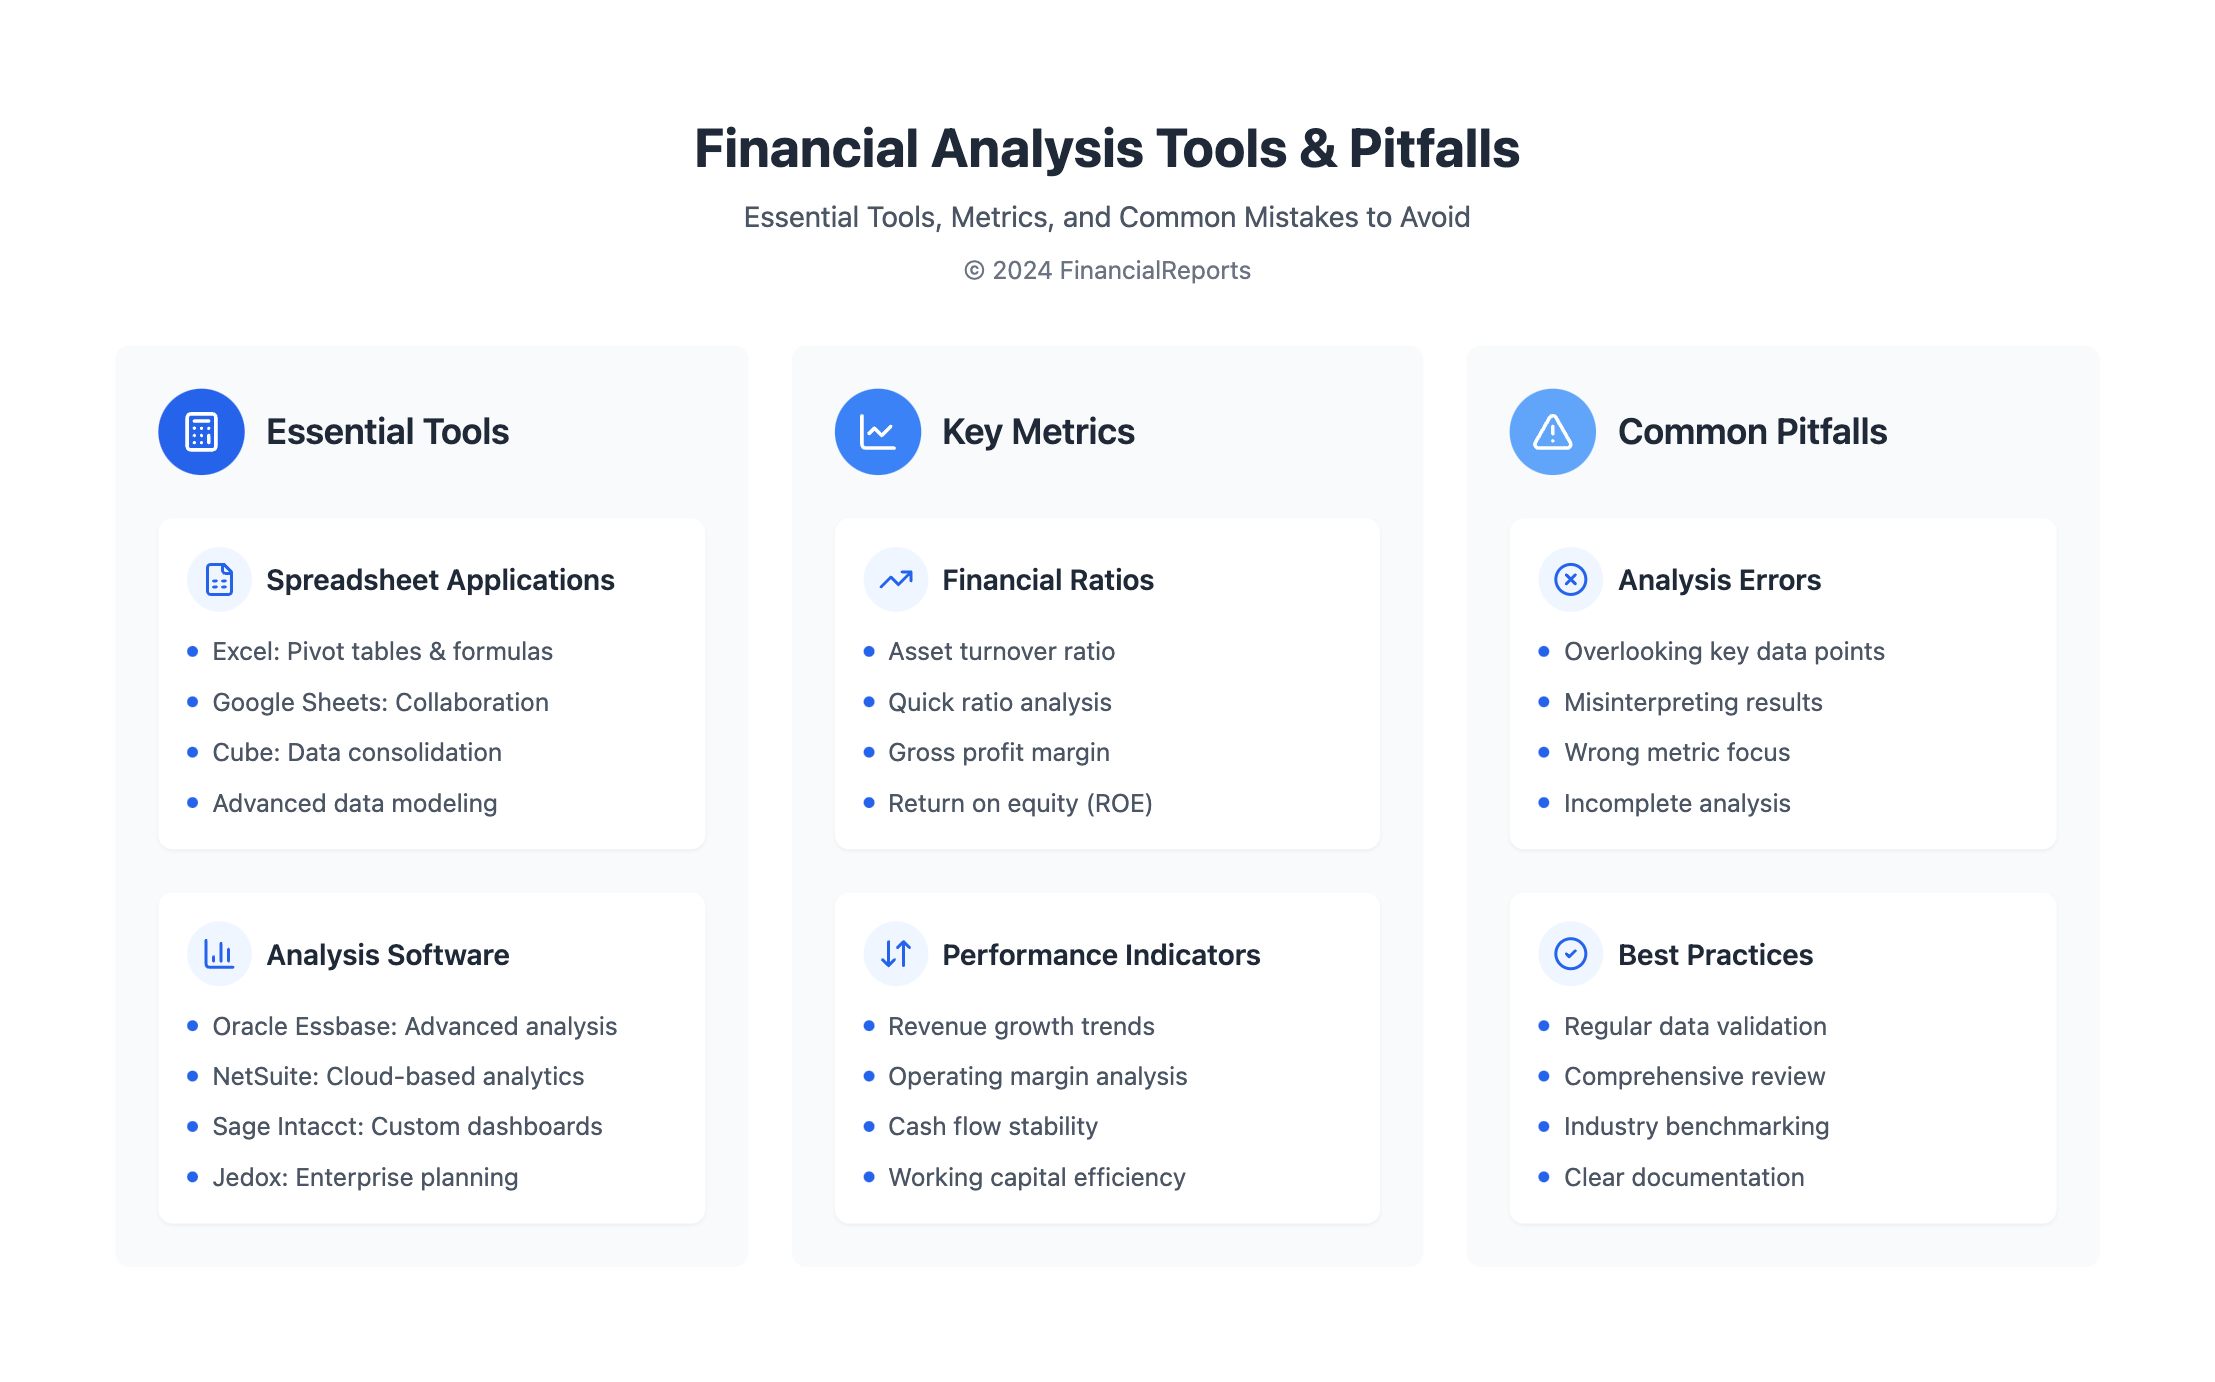
Tools and Software for Financial Analysis
Today, data is king. The right tools and software are critical for financial analysis. These technologies simplify complex tasks. They also make financial reports more accurate and efficient. Here, we highlight essential tools every finance expert should know.
Spreadsheet Applications
Spreadsheet programs, like Microsoft Excel, were among the first for financial reports. Excel is still key, known for pivot tables, complex formulas, and chart making tools. Also, platforms like Cube enhance these functions. They blend with Excel and Google Sheets, adding features like automatic data consolidation and scenario analysis.
Financial Analysis Software
- Oracle Essbase: Offers advanced data analysis, aiding in detailed financial statement review and complex financial modeling.
- NetSuite: A cloud-based software, NetSuite manages analytics, CRM, and inventory with live data updates.
- Sage Intacct: Provides instant insights into financial health via custom dashboards, making analysis tools readily accessible.
- Jedox: Focuses on enterprise performance, offering extensive budgeting, planning, and forecasting tools, along with powerful financial analysis models.
Visualization Tools
Clear data presentation is crucial in finance. Microsoft Power BI and Tableau transform complex data into interactive visuals. These tools are vital for spotting trends and making informed choices. Platforms like Domo and Clockwork offer cloud-based analysis and detailed visuals. They take financial data presentation and analysis to the next level.
Using a mix of basic spreadsheets, advanced software, and cutting-edge visualization tools, finance experts enhance their reporting and analysis. Each tool offers unique benefits. Together, they revolutionize financial reporting.
Interpreting Financial Data Effectively
Understanding financial data well is key to good proactive financial management. It helps businesses use their financial statements to grow. This part focuses on getting the meaning of financial performance indicators and their impact on evaluating investment attractiveness.
Key Metrics to Focus On
Critical financial metrics include asset turnover, quick ratio, gross profit margin, and return on equity (ROE). These show how efficient, liquid, profitable, and healthy a company is. Knowing the important aspects of balance sheets, income statements, and cash flow statements helps stakeholders. They can see how the company is doing now and guess future performance.
Trends and Patterns Analysis
Looking at and understanding trends over time is important. It helps companies predict market changes and opportunities. Important trends to watch are those in revenue growth, how expenses are managed, and if cash flow is stable. By reviewing these patterns, companies can make better plans for using their resources and adjusting their operations proactively.
Making Data-Driven Decisions
Making choices based on data depends on correctly using and understanding financial information. With insights from financial analysis, companies can make decisions that match their long-term goals. This improves how attractive they are to investors. Good financial management requires keeping an eye on and adjusting to financial data and performance indicators regularly.
| Financial Statement | Key Component | Indicator |
|---|---|---|
| Balance Sheet | Current Assets | Liquidity Ratios |
| Income Statement | Gross Profit | Profitability Ratios |
| Cash Flow Statement | Operating Activities | Cash Flow Adequacy |
In the end, being able to interpret financial data well lets businesses keep stable and look into their growth chances. Knowing how to analyze well makes understanding financial statements essential. It lifts up financial performance indicators and makes a company more attractive to invest in.
Common Pitfalls in Financial Analysis Reporting
In financial analysis, getting things right is crucial. This means accurate analysis and careful checking of financial details are key. But, there are common mistakes that can mess up these reports.
Overlooking Key Data
It's a mistake to ignore important data or small details. For example, overlooking little transactions can cause big mistakes. Over time, this can significantly affect financial statements.
Misinterpretation of Results
Understanding financial data deeply is a must. Errors like wrong revenue recognition or misclassifying expenses can lead to incorrect insights. This may end up affecting business decisions.
Focusing on the Wrong Metrics
Choosing the wrong financial metrics to focus on is a problem. It's important to select metrics that match the company's goals. This ensures the analysis is useful and relevant.
Looking into internal control issues shows common financial reporting problems. Here's a summary of these issues:
| Deficiency Type | Description | Common Examples |
|---|---|---|
| Design Control Deficiency | Lapses in control design preventing timely error detection | Failures in inventory management and improper account reconciliations |
| Significant Deficiency | Less severe than material weakness, but noteworthy | Issues with payroll and bank reconciliations needing attention |
| Material Weakness | Potential for material misstatements going undetected | Substantial overstatement of assets, underreporting of liabilities |
| OIG Report Findings | Shows ineffectiveness in asset controls and reporting discrepancies | Unsupported non-federal shares, discrepancies in payroll |
By understanding and avoiding these pitfalls, financial analysis can be much more precise and reliable. Accurate data analysis and attention to detail are crucial for presenting a company's true financial state.
Conclusion and Best Practices for Financial Analysis Reports
In finance, we value clearness and accuracy most. They help investors, bosses, or regulators make big decisions. This piece covers the core of good financial reporting. It shows that these reports guide us not just through what's gone but towards future opportunities too. Achieving strong communication of financial insights is crucial.
Take Amazon's detailed income and cash reports, or new tech that improves these methods. At their heart, they promote openness and thorough analysis.
Recap of Key Points
Every financial report must follow the rules of GAAP. This ensures clarity and makes them understandable to everyone. Adding visuals like charts makes the data easier to grasp. Also, comparing financial trends over time and against others in the industry is vital.
Reports should match the reader's financial knowledge. This means using simple language for complex ideas. Keep your financial info up-to-date to stay correct and relevant.
Future Trends in Financial Analysis
Looking ahead, we see more use of automation and advanced analytics in finance. These will make reports faster and dig deeper into the data. As things change, finance pros need to keep learning to stay sharp.
Resources for Further Learning
Finance pros must never stop learning, as innovation never pauses. Merging tech with solid financial basics ensures reports are not only informative but actionable. Spending just 4 minutes reading up like this can aid in keeping ahead in this fast-moving field.
FAQ
What is the purpose of a financial analysis report?
A financial analysis report provides an in-depth look at a company's financial standing. It evaluates financial operations and helps in making money-related decisions. This report is essential for stakeholders to understand the company's fiscal strengths and weaknesses.
What are the key components of a financial analysis report?
Key parts of a financial analysis report include an executive summary and financial statement assessment. There's also ratio analysis, comparison with industry standards, and strategic advice based on the findings. These components help explain the company's financial status and future potential.
What common types of financial analysis reports are there?
There are different types of financial reports. These include standard financial statements that show the company's resources and debts. Ratio analysis looks into the company's financial health, and comparative analysis compares it to other companies in the same sector.
Why is formatting important in financial analysis reports?
Good formatting makes a financial report professional and easy to read. It helps in presenting complex information clearly with the use of visuals. Consistent formatting ensures readers can easily follow and understand the contents.
How do you prepare an effective financial analysis report?
Preparing a good financial report means carefully studying financial statements and calculating key ratios. You also need to forecast future performance using this data. Then, put together a clear report that shares the company's financial outlook accurately.
What tools and software can aid in the creation of a financial analysis report?
Several tools help in making a financial report. Excel is great for data management and calculations. Special financial software offers more detailed assessments. And data visualization tools help in making financial data easy to understand.
What are sample financial analysis report templates used for?
Sample templates guide the report creation process. Basic templates lay out the report structure, while detailed ones provide deeper financial evaluations. Industry-specific templates tailor the report to fit sector standards. Templates ensure the report is thorough and organized.
What common pitfalls should be avoided in financial analysis reporting?
When reporting financial analysis, avoid missing key data and misinterpreting results. Bias and focusing on irrelevant metrics can lead to wrong conclusions. A strategic, unbiased approach is needed for accurate and useful reports.
How should financial data be effectively interpreted?
Effective data interpretation focuses on indicators of financial health and attractiveness. It checks financial trends and market movements. A good analysis makes informed decisions that match the company's goals. It promotes sound management and strong investor relationships.
What should the conclusion of a financial analysis report include?
The conclusion should recap the report's main findings, emphasizing financial insights and opportunities for growth. It also points out resources or trends valuable for continuous financial analysis. This ensures the readers are kept up to date with financial developments.