Explore the Latest Cape Ratio Trends
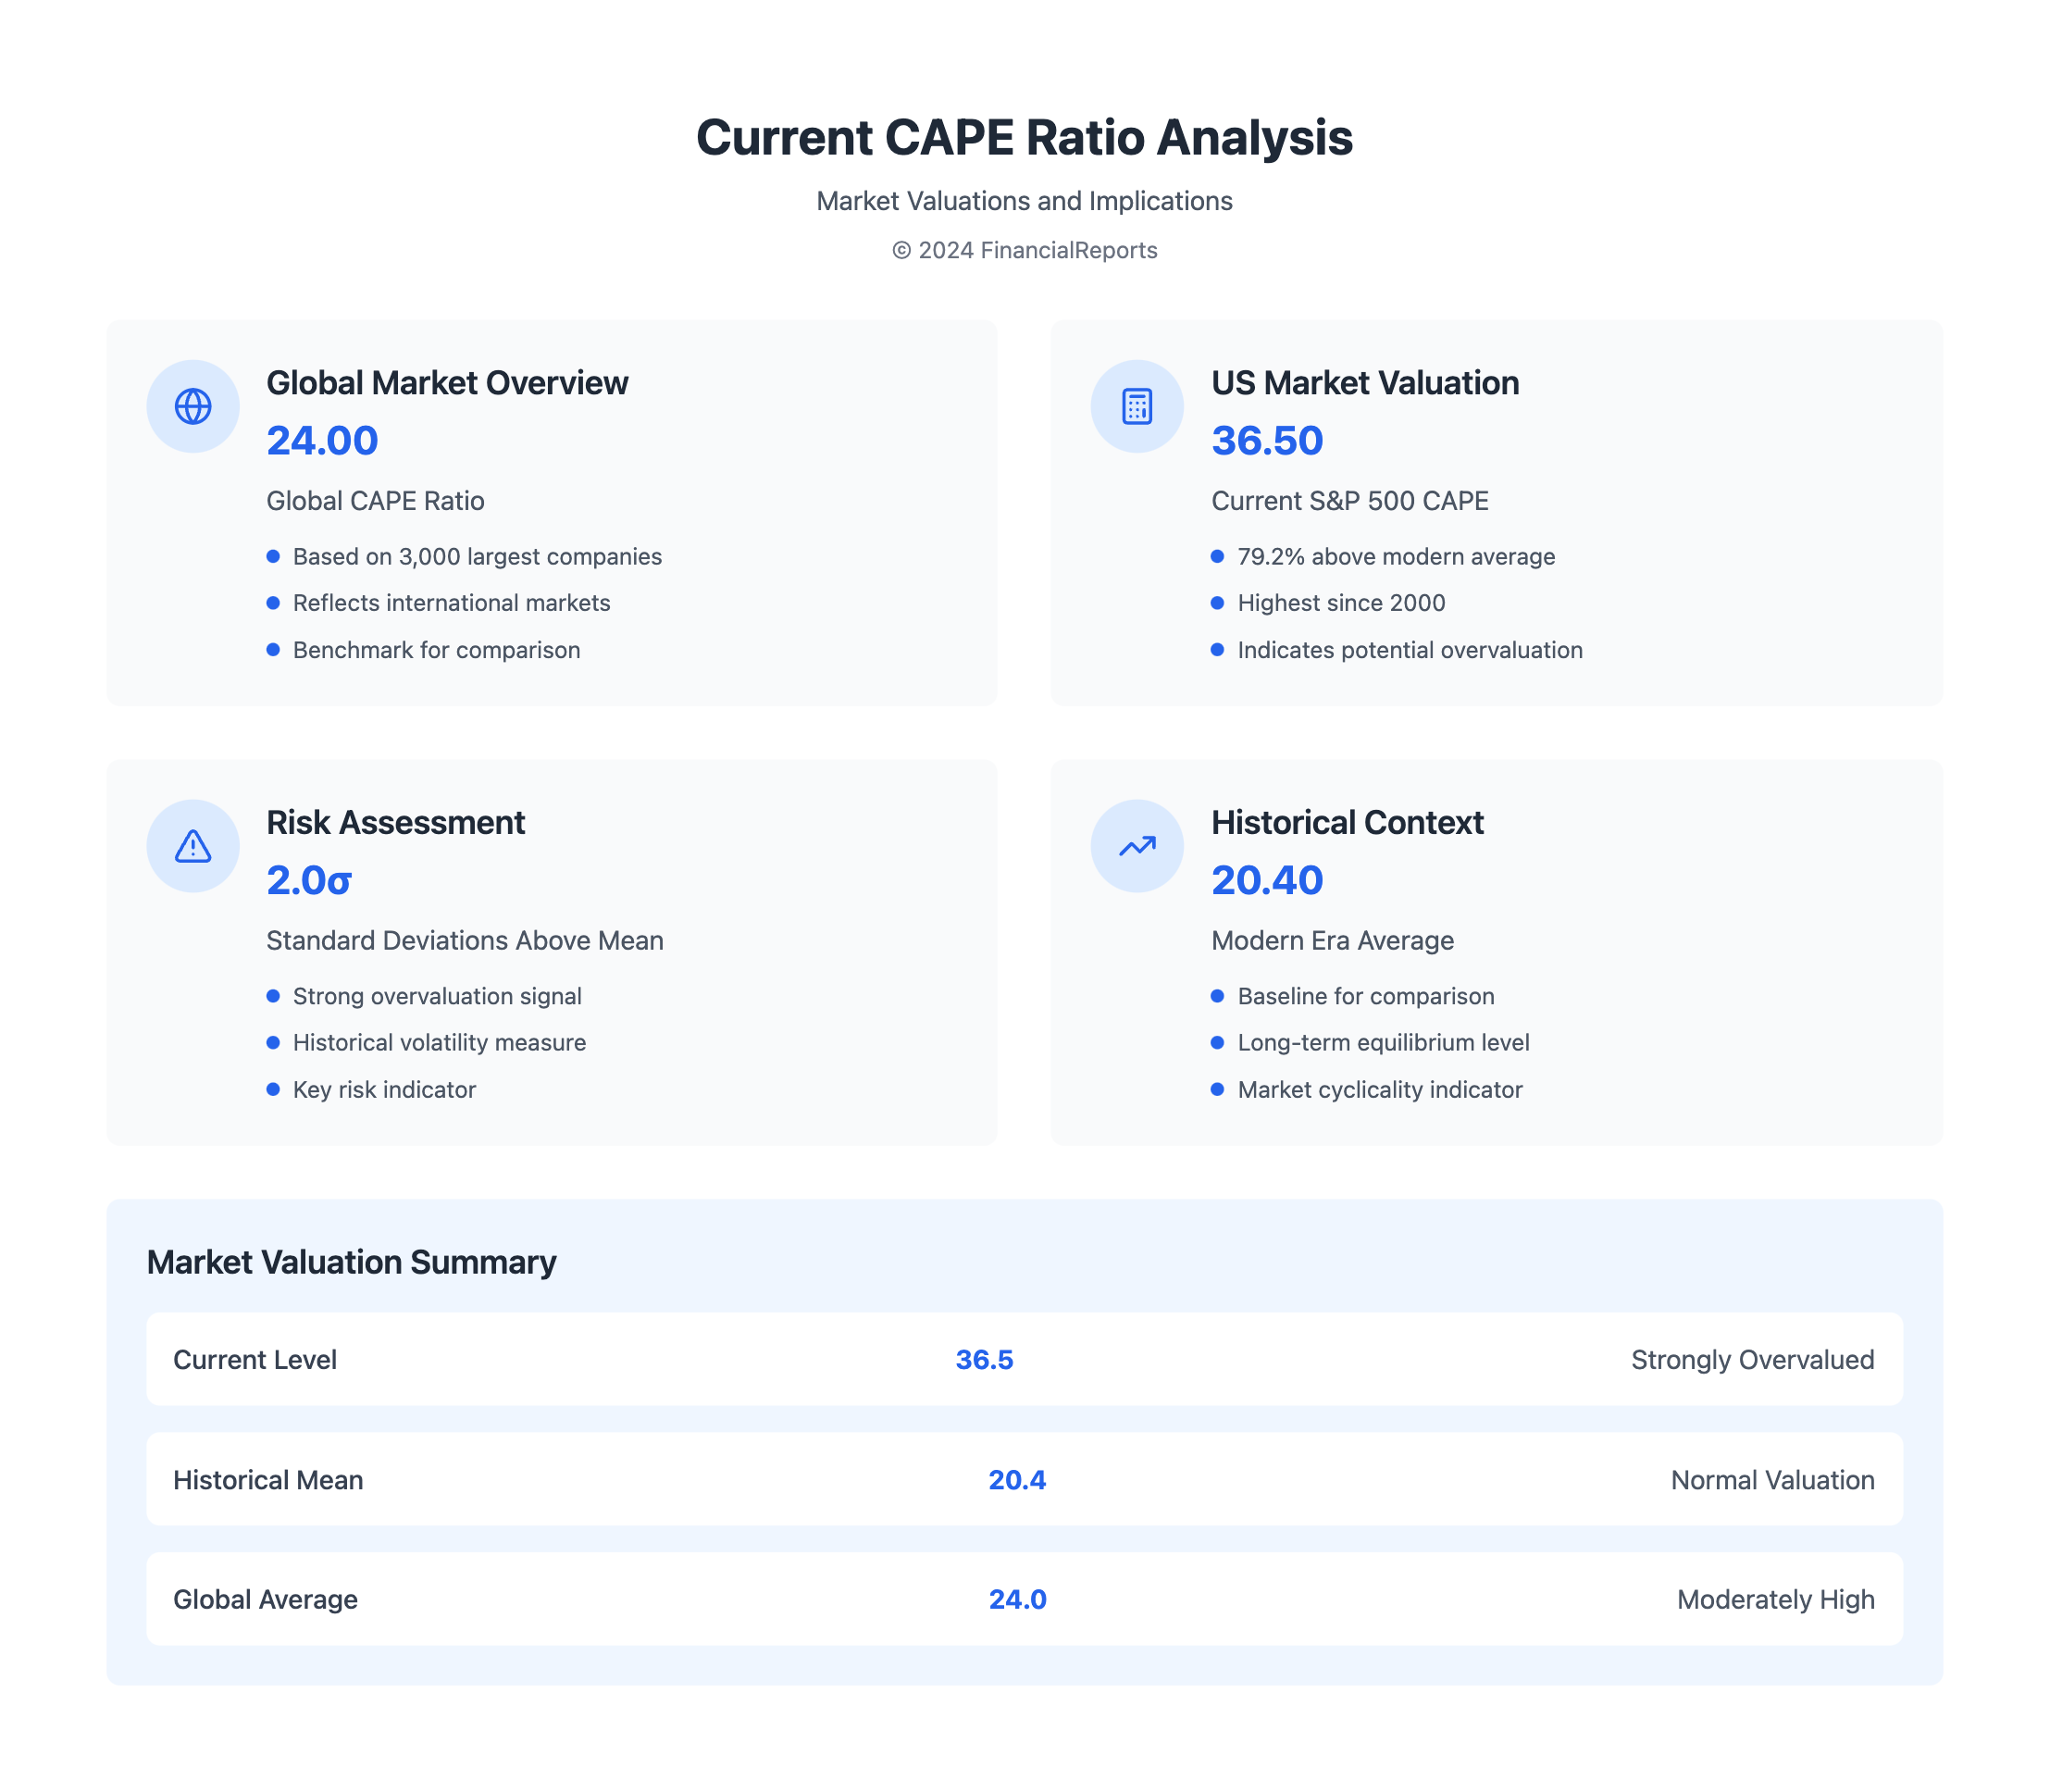
The current cape ratio, also known as the cyclically adjusted pe, is key in financial analysis. It gives insights into market valuations. As of September 30, 2024, the S&P500 P/E ratio is 79.2% above its modern era average. This shows the market is strongly overvalued.
The cape shiller, or cape ratio, looks at the current price divided by the average earnings over the past 10 years. It offers a smoothed-out trend like the current PE ratio.
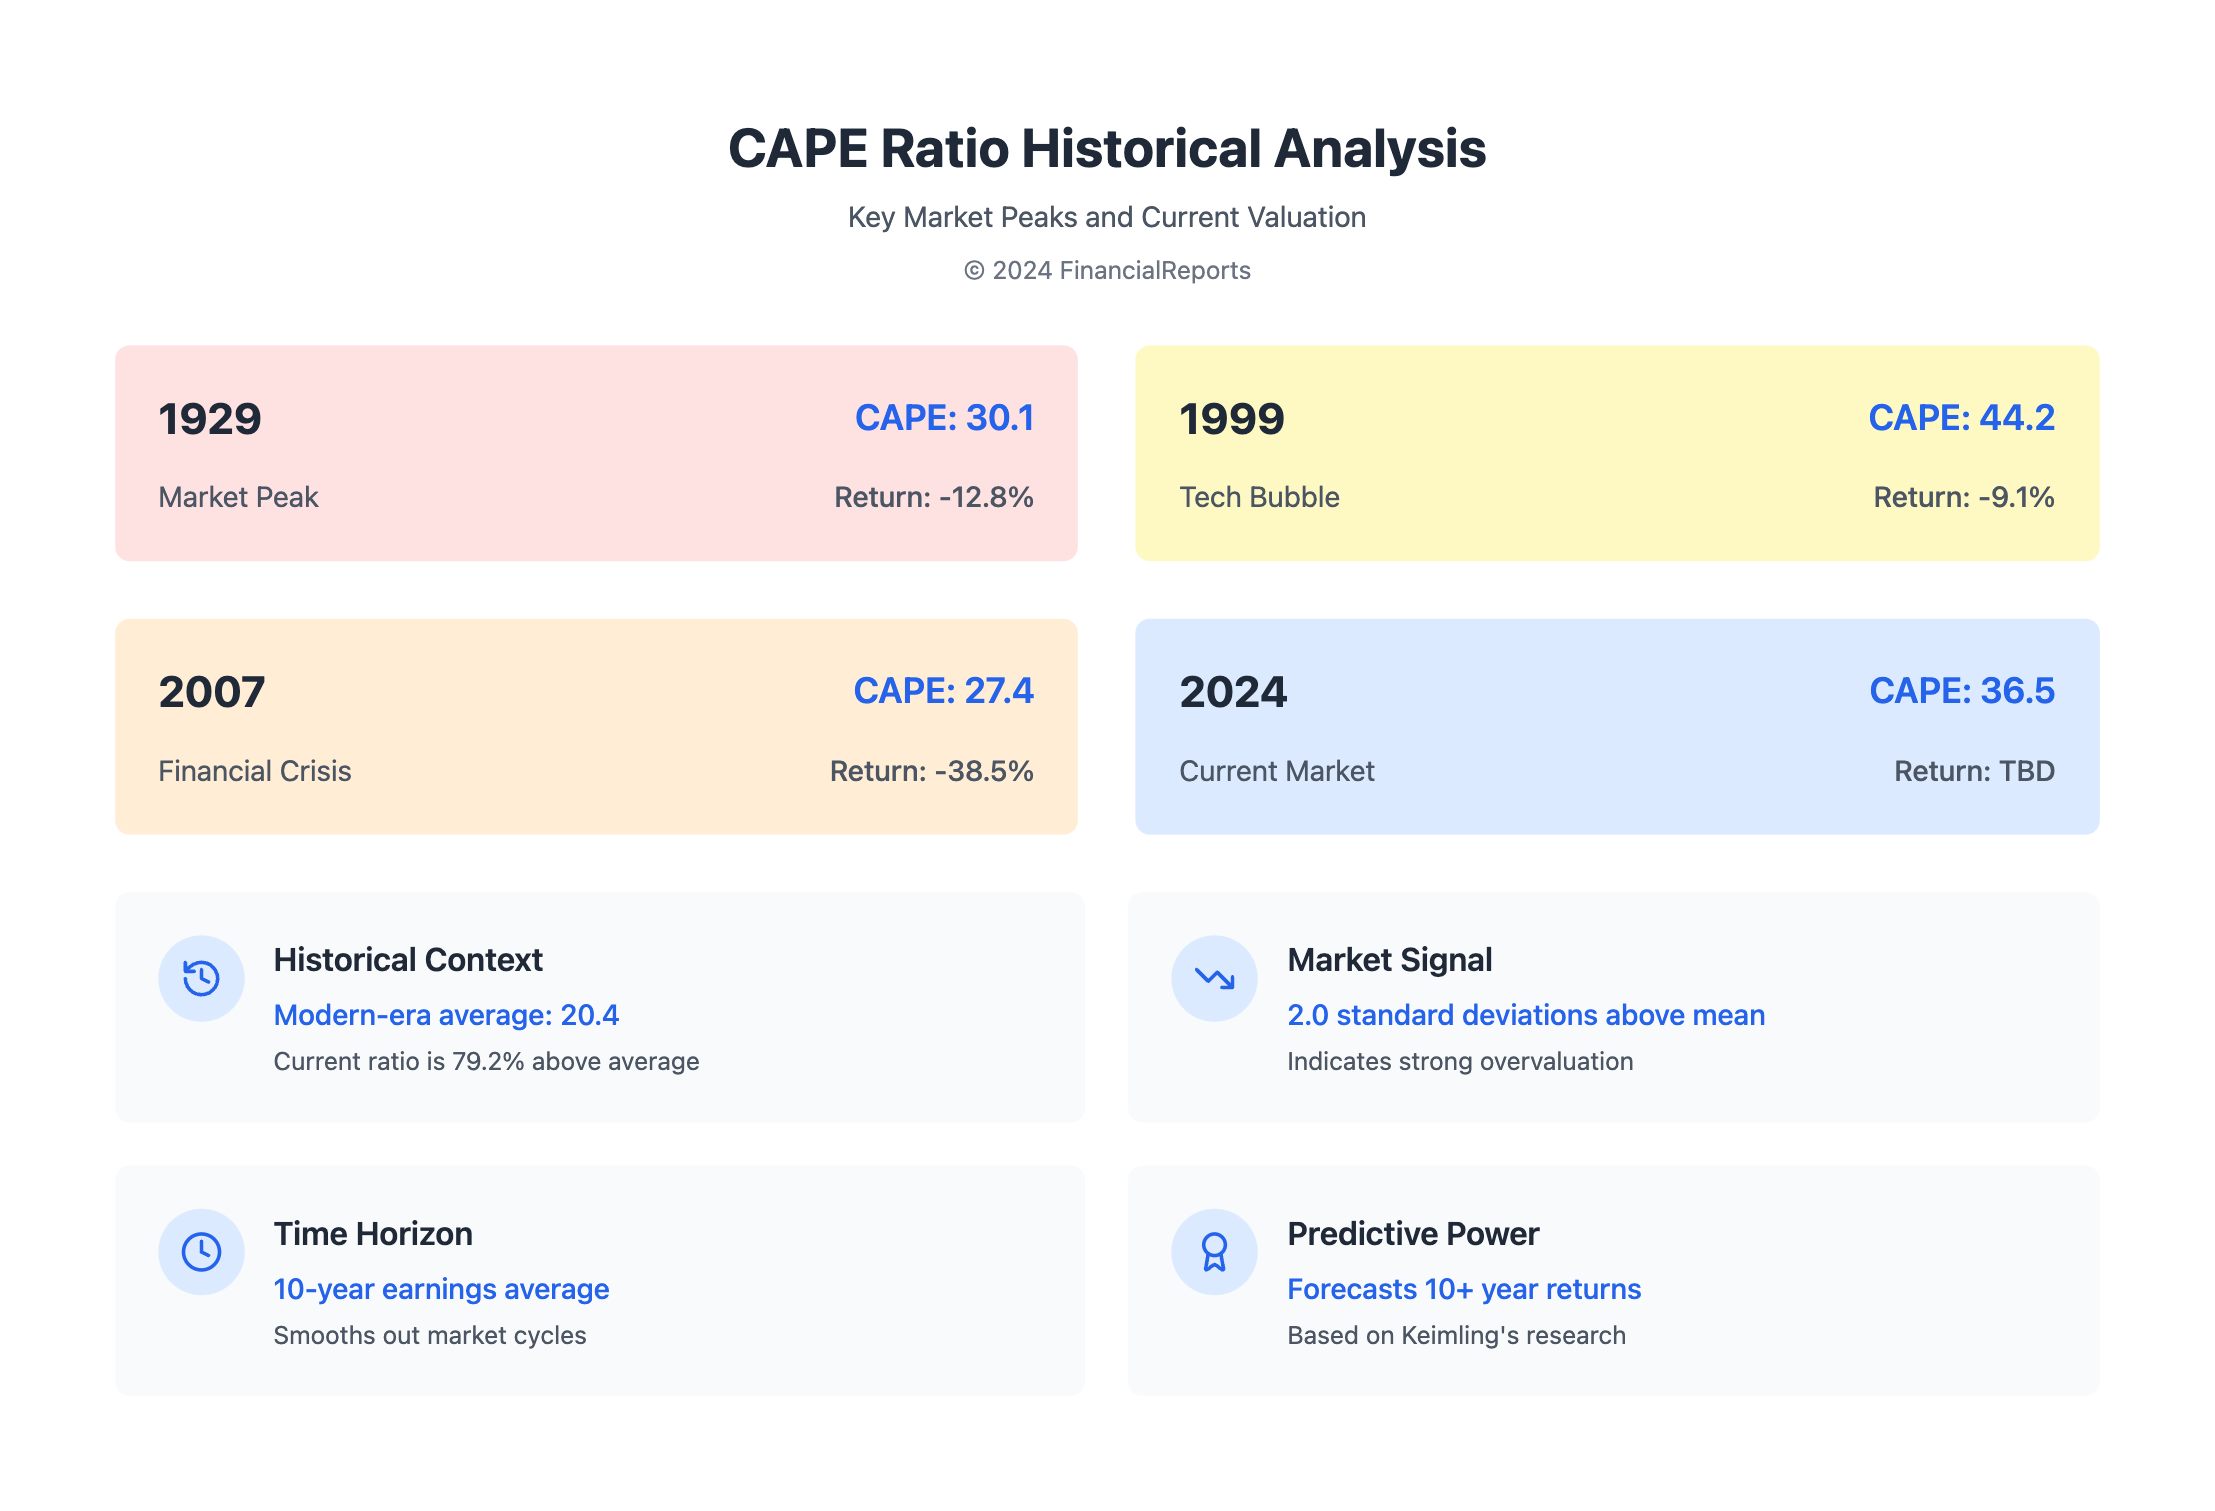
The cape ratio helps estimate the long-term expected real return of the stock market. Norbert Keimling's study found it can forecast long-term returns in the S&P 500 for more than 10 years using the CAPE 10. With the current cape ratio at 36.5, it's 2.0 standard deviations above the modern-era average of 20.4. Investors and financial professionals need to think carefully about this metric's impact on their strategies.
Key Takeaways
- The current S&P500 10-year P/E Ratio is 36.5, which is 79.2% above the modern-era market average of 20.4.
- The cape ratio is a critical metric in assessing market valuations and estimating long-term expected real returns.
- The current cape ratio is 2.0 standard deviations above the modern-era average, indicating a strongly overvalued market.
- Norbert Keimling's study highlights the CAPE 10's ability to forecast long-term returns in the S&P 500.
- Investors and financial professionals must carefully consider the implications of the current cape ratio on their investment strategies.
- The cyclically adjusted price earnings ratio (CAPE) provides a smoothed-out trend similar to the current PE ratio.
- The cape shiller, or cape ratio, is essential in understanding the current market valuations and making informed investment decisions.
Understanding the Cape Ratio and Its Importance
The cyclically adjusted price earnings ratio, or CAPE, shows how a company's stock price compares to its adjusted pe ratio over 10 years. It's also known as the cyclically adjusted price to earnings ratio. This ratio helps see how a company does financially through different economic times. It's calculated by dividing the share price by the 10-year average of cape earnings, adjusted for inflation.
The CAPE ratio is key for investors. It gives a fuller view of a company's value than regular price-to-earnings ratios. By using a 10-year average, it smooths out earnings swings. This gives a clearer view of a company's long-term value. The adjusted pe ratio also helps compare companies' values over time.
Definition of Cape Ratio
The CAPE ratio is the stock price divided by the 10-year average cape earnings, adjusted for inflation. It's used to check a company's value and compare it to others. The cyclically adjusted price to earnings ratio is a valuable tool for investors. It offers a deeper look at a company's value than traditional ratios.
Historical Context and Relevance
The CAPE ratio has been around for decades, starting in the 1920s. Economist Robert Shiller introduced it to evaluate the stock market's value. Many investors and analysts use it to forecast stock market returns. The adjusted pe ratio also helps evaluate and compare company valuations.
| Year | CAPE Ratio | Stock Market Return |
|---|---|---|
| 1929 | 30.1 | -12.8% |
| 1999 | 44.2 | -9.1% |
| 2007 | 27.4 | -38.5% |
Analyzing the Current Cape Ratio Trends
The S&P500 10-year P/E Ratio is now at 36.5, which is 79.2% higher than the average of 20.4. This big difference in market valuation is key. The cyclically adjusted price to earnings ratio, or Shiller CAPE index, helps us understand these trends.
The cape pe ratio is found by dividing the current price by the average earnings over the last 10 years, adjusted for inflation. A high cape price earnings ratio means stocks might be overvalued. A low ratio suggests they might be undervalued. With the high shiller cape index now, investors might be ready to pay more for stocks. This could lead to lower returns in the future.
Several factors are affecting the cyclically adjusted price to earnings ratio trends. These include:
- Monetary policy and its effect on interest rates
- Economic recovery and growth
- Trends and dynamics in different sectors
By looking at the current cape ratio trends and what affects them, investors can make better choices. The shiller cape index is a great tool for checking market valuation. It helps investors make smart decisions for the long term.
Cape Ratio: A Tool for Valuation Assessment
The cape pe ratio, or shiller price earnings ratio, helps investors check market values. It compares a stock's current price to its average earnings over 10 years, adjusted for inflation. This tool has been trusted by investors for decades, showing its skill in spotting market trends.
When using the cape ratio, keep these points in mind:
- The average shiller pe ratio over 20 years is about 26, but now it's nearly 36. This shows a big jump in value.
- High shiller pe ratios often mean lower returns in the next decade. This shows a link between high prices and future performance.
- The cape ratio helps check market values, evaluate stocks, and guide investment choices.
Using the shiller index and cape pe ratio helps investors make better choices. Robert Shiller, a Nobel Prize winner in economics, says the cape ratio is great for checking stock values and predicting trends.
Geographic Variations in Cape Ratios
The cyclically adjusted pe ratio, or Shiller CAPE ratio, helps us see how stock markets are valued. As of July 1st, 2024, the global stock market CAPE ratio is 24.00. This number comes from an index of the 3,000 biggest public companies worldwide.
Looking at the shiller index pe and shiller cape ratio across markets shows big differences. For example, the cape ratio today in the U.S. is higher than in some other countries. These differences come from things like economic growth, money policies, and what kinds of companies are listed.
Some important things to think about when looking at CAPE ratio differences include:
- Differences in economic conditions and market structures between regions
- Varying levels of investor sentiment and market confidence
- Distinctive characteristics of each market, such as sector composition and company size
Understanding these differences and what causes them helps investors make better choices. It can also help them find growth opportunities in different markets.
The Role of Economic Indicators in Cape Ratio Analysis
The cape ratio is shaped by many economic factors, like inflation and interest rates. It's key for investors to grasp how these factors affect the cape indices. The shiller price earnings ratio, or shiller ratio, looks at 10 years of earnings adjusted for inflation. This gives a solid view of a stock's long-term worth.
When looking at the cape ratio, here are some important things to remember:
- The cape ratio uses earnings from over a decade to offer a stable way to check a stock's value.
- The shiller ratio gives a peek into future stock valuations by looking at long-term earnings.
- Economic growth and inflation rates greatly affect the cape indices. So, it's vital to watch these indicators when using the cape ratio for investment decisions.
By looking at the current cape ratio along with economic indicators, investors can better understand the market. This helps them make smarter investment choices. The cape ratio is useful for spotting market bubbles, undervalued periods, and overall market conditions. Its ideas can also be used worldwide to check stock markets in different countries.
Critiques of the Cape Ratio
The cape shiller, or cyclically adjusted pe, is a key tool for market valuation. Yet, it has its drawbacks in today's markets. It struggles to grasp the nuances of modern markets, like those with lots of intangible assets.
One major issue is its inability to keep up with changes in accounting and market structures. For example, tech giants like Apple and Amazon have changed the game. Their rapid growth and increased market presence skew the cape ratio's view of U.S. stocks versus foreign ones.
Other metrics, like Tobin's Q ratio or the Buffett Indicator, offer a more complete picture. They help investors make better choices. By understanding the cape ratio's flaws, investors can use a variety of tools to evaluate markets more accurately.
| Valuation Metric | Description |
|---|---|
| Cape Ratio | A measure of market valuation that adjusts for inflation and business cycles |
| Tobin's Q Ratio | A measure of market valuation that compares the market value of a company to its replacement cost |
| Buffett Indicator | A measure of market valuation that compares the total market capitalization of a country to its GDP |
How Investors Use the Cape Ratio
Investors use the CAPE ratio, also known as the cyclically adjusted price to earnings ratio, to make smart choices. It looks at a stock's price compared to its cape earnings over 10 years. This gives a clearer view of a company's value.
The shiller cape index helps investors see if the market is overvalued or undervalued. A high CAPE ratio might mean the stock is too expensive. On the other hand, a low ratio could mean it's a good time to buy.
Incorporating Cape Ratio in Portfolio Management
Investors can use the CAPE ratio to manage their portfolios. They can adjust how much of their money goes into different stocks. This helps them make the most of their investments.
Strategies for Maximizing Returns
Here are some ways to use the CAPE ratio to boost returns:
- Sector rotation: switching between sectors based on their CAPE ratio
- Global asset allocation: spreading investments across different areas and types of assets
- Tactical asset allocation: changing how much money is in each stock based on the CAPE ratio
| Strategy | Description |
|---|---|
| Sector Rotation | Rotating between sectors based on their relative valuation |
| Global Asset Allocation | Allocating assets across different regions and asset classes based on their relative valuation |
| Tactical Asset Allocation | Adjusting portfolio allocations based on changes in equity valuation |
The Future of the Cape Ratio
The cyclically adjusted price to earnings ratio, or cape pe ratio, helps predict the stock market's long-term returns. It's important to watch the market and economic trends to guess how the cape ratio will change in the future.
Studies show the cape pe ratio is good at predicting stock market returns over long periods. For instance, a 2016 study by Swedroe found the CAPE 10 can forecast S&P 500 returns for more than 10 years. Also, a new measure called P-CAE has made the cape ratio even more accurate for earnings estimates.
Predictions Based on Current Data
Right now, the cape ratio is at 35.5, which is quite high. This makes some worry the market might be overvalued. But, it's key to look at the cape ratio with other economic signs like inflation and interest rates for a full picture.
Potential Shifts in Economic Conditions
Changes in economic conditions, like new monetary policies, can really affect the cape ratio. For example, higher interest rates might lower the cape ratio, while lower rates could raise it. Keeping an eye on these changes is vital for adjusting investment plans.
Historical Performance of the Cape Ratio
The shiller price earnings ratio, or shiller cape pe, is a key tool for market valuation. It uses the shiller index and shiller index pe to analyze the stock market's past. Over 20 years, the CAPE ratio has seen big ups and downs.
Lower CAPE ratios often lead to better returns over the next five years, data shows. For example, before Black Monday, the CAPE ratio was 14.7. But after, it rose to 25.8. Today, it's at 28.9, suggesting possible lower returns ahead.
The following table summarizes the historical CAPE ratio data:
| Year | CAPE Ratio | Average Return |
|---|---|---|
| 2000 | 44.2 | -2.1% |
| 2010 | 21.3 | 10.2% |
| 2020 | 28.9 | 12.1% |
The shiller index and shiller index pe help forecast future returns. The CAPE ratio is seen as a good predictor using earnings averages and future returns. Yet, the debate on its reliability for predicting returns is ongoing.
Understanding the Cyclically Adjusted Price-to-Earnings (CAPE) Ratio
The Cyclically Adjusted Price-to-Earnings (CAPE) ratio, also known as the Shiller PE Ratio, is a key metric in stock market analysis. It provides a more accurate view of stock prices by adjusting for inflation and the business cycle. This ratio helps investors understand the true value of stocks and make informed decisions.
The CAPE ratio today is calculated by taking the current stock price and dividing it by the average earnings over the past 10 years, adjusted for inflation. This method helps to smooth out short-term fluctuations and provides a clearer picture of the market's valuation.
By comparing the CAPE ratio today to its historical levels, investors can gauge whether stocks are overvalued or undervalued. A high CAPE ratio indicates that stocks may be overvalued, while a low ratio suggests undervaluation. This information is essential for making strategic investment decisions.
Investors can use the CAPE ratio to identify market trends and make informed decisions. By analyzing the CAPE ratio today and comparing it to historical levels, investors can gain valuable insights into the stock market's valuation and make more informed investment choices.

Benefits of Using the CAPE Ratio
Using the CAPE ratio offers several benefits for investors:
- Long-term perspective: The CAPE ratio provides a long-term perspective, allowing investors to assess the market's valuation over an extended period.
- Inflation adjustment: By adjusting for inflation, the CAPE ratio helps investors account for the impact of rising prices on stock valuations.
- Business cycle consideration: The CAPE ratio takes into account the business cycle, helping investors avoid making decisions based on short-term market fluctuations.
- Valuation insights: By comparing the CAPE ratio today to its historical levels, investors can gain valuable insights into the stock market's valuation and make more informed investment decisions.
Overall, the CAPE ratio is a powerful tool for investors to assess the stock market's valuation and make informed investment decisions. By understanding the CAPE ratio today and its historical levels, investors can gain valuable insights into the market's valuation and make more informed investment choices.
FAQ
What is the current CAPE ratio?
As of September 30, 2024, the S&P500 CAPE ratio is 36.5. This is much higher than its average in recent times.
How is the CAPE ratio calculated and what does it measure?
The CAPE ratio, or Shiller PE, is found by dividing current stock prices by the average earnings over 10 years. It helps smooth out earnings swings, giving a long-term view of market values.
What factors are contributing to the current elevated CAPE ratio?
Several factors are pushing the CAPE ratio up. These include monetary policy, economic recovery, and specific sector trends. Looking at different market sectors helps understand the CAPE ratio's trends.
How can investors and financial professionals use the CAPE ratio to inform their investment strategies?
The CAPE ratio helps assess long-term market values. It guides investors in spotting over- or undervalued markets. Yet, it's best used with other financial metrics and qualitative factors.
How do CAPE ratios differ across global markets?
CAPE ratios vary by market, influenced by economic growth, policies, and market makeup. These differences highlight global market opportunities and risks.
How do economic indicators such as inflation and interest rates impact the CAPE ratio?
Inflation and interest rates greatly affect the CAPE ratio. High inflation reduces real earnings, while interest rate changes alter future earnings' value. These are key in the CAPE ratio calculation.
What are the limitations and critiques of the CAPE ratio?
The CAPE ratio has its drawbacks. Changes in accounting, market structures, and economic conditions can make it less reliable. Investors should consider other valuation tools alongside the CAPE ratio.
How can investors practically apply the CAPE ratio in their investment strategies?
Investors can use the CAPE ratio for sector rotation, global asset allocation, and other decisions. Success stories and pitfalls should guide its use.
What is the future outlook for the CAPE ratio and its continued relevance in financial analysis?
The CAPE ratio's future hinges on tech, global economics, and investor behavior. Data and economic shifts offer insights into its ongoing relevance in finance.
How has the CAPE ratio performed historically, and what lessons can be learned from past data?
Examining the CAPE ratio's past 20 years reveals valuable lessons. It shows how it has predicted market trends and its limitations in different conditions.