Essential Financial Report Format Guidelines for Business
Today, understanding the financial report format is essential, not just a choice. Companies deal with tons of data and aim for clear, precise financial clarity and compliance. A well-structured financial report shows a company's financial health. It greatly affects how stakeholders make decisions.
According to Databox's State of Business Reporting, finance is closely watched. How financial reports are presented is very important. These reports, whether quarterly or annually, show how business resources change over time. For example, a business with a median gross profit of $73,790 a month showcases what's possible. Reports include income statements and balance sheets, among others.
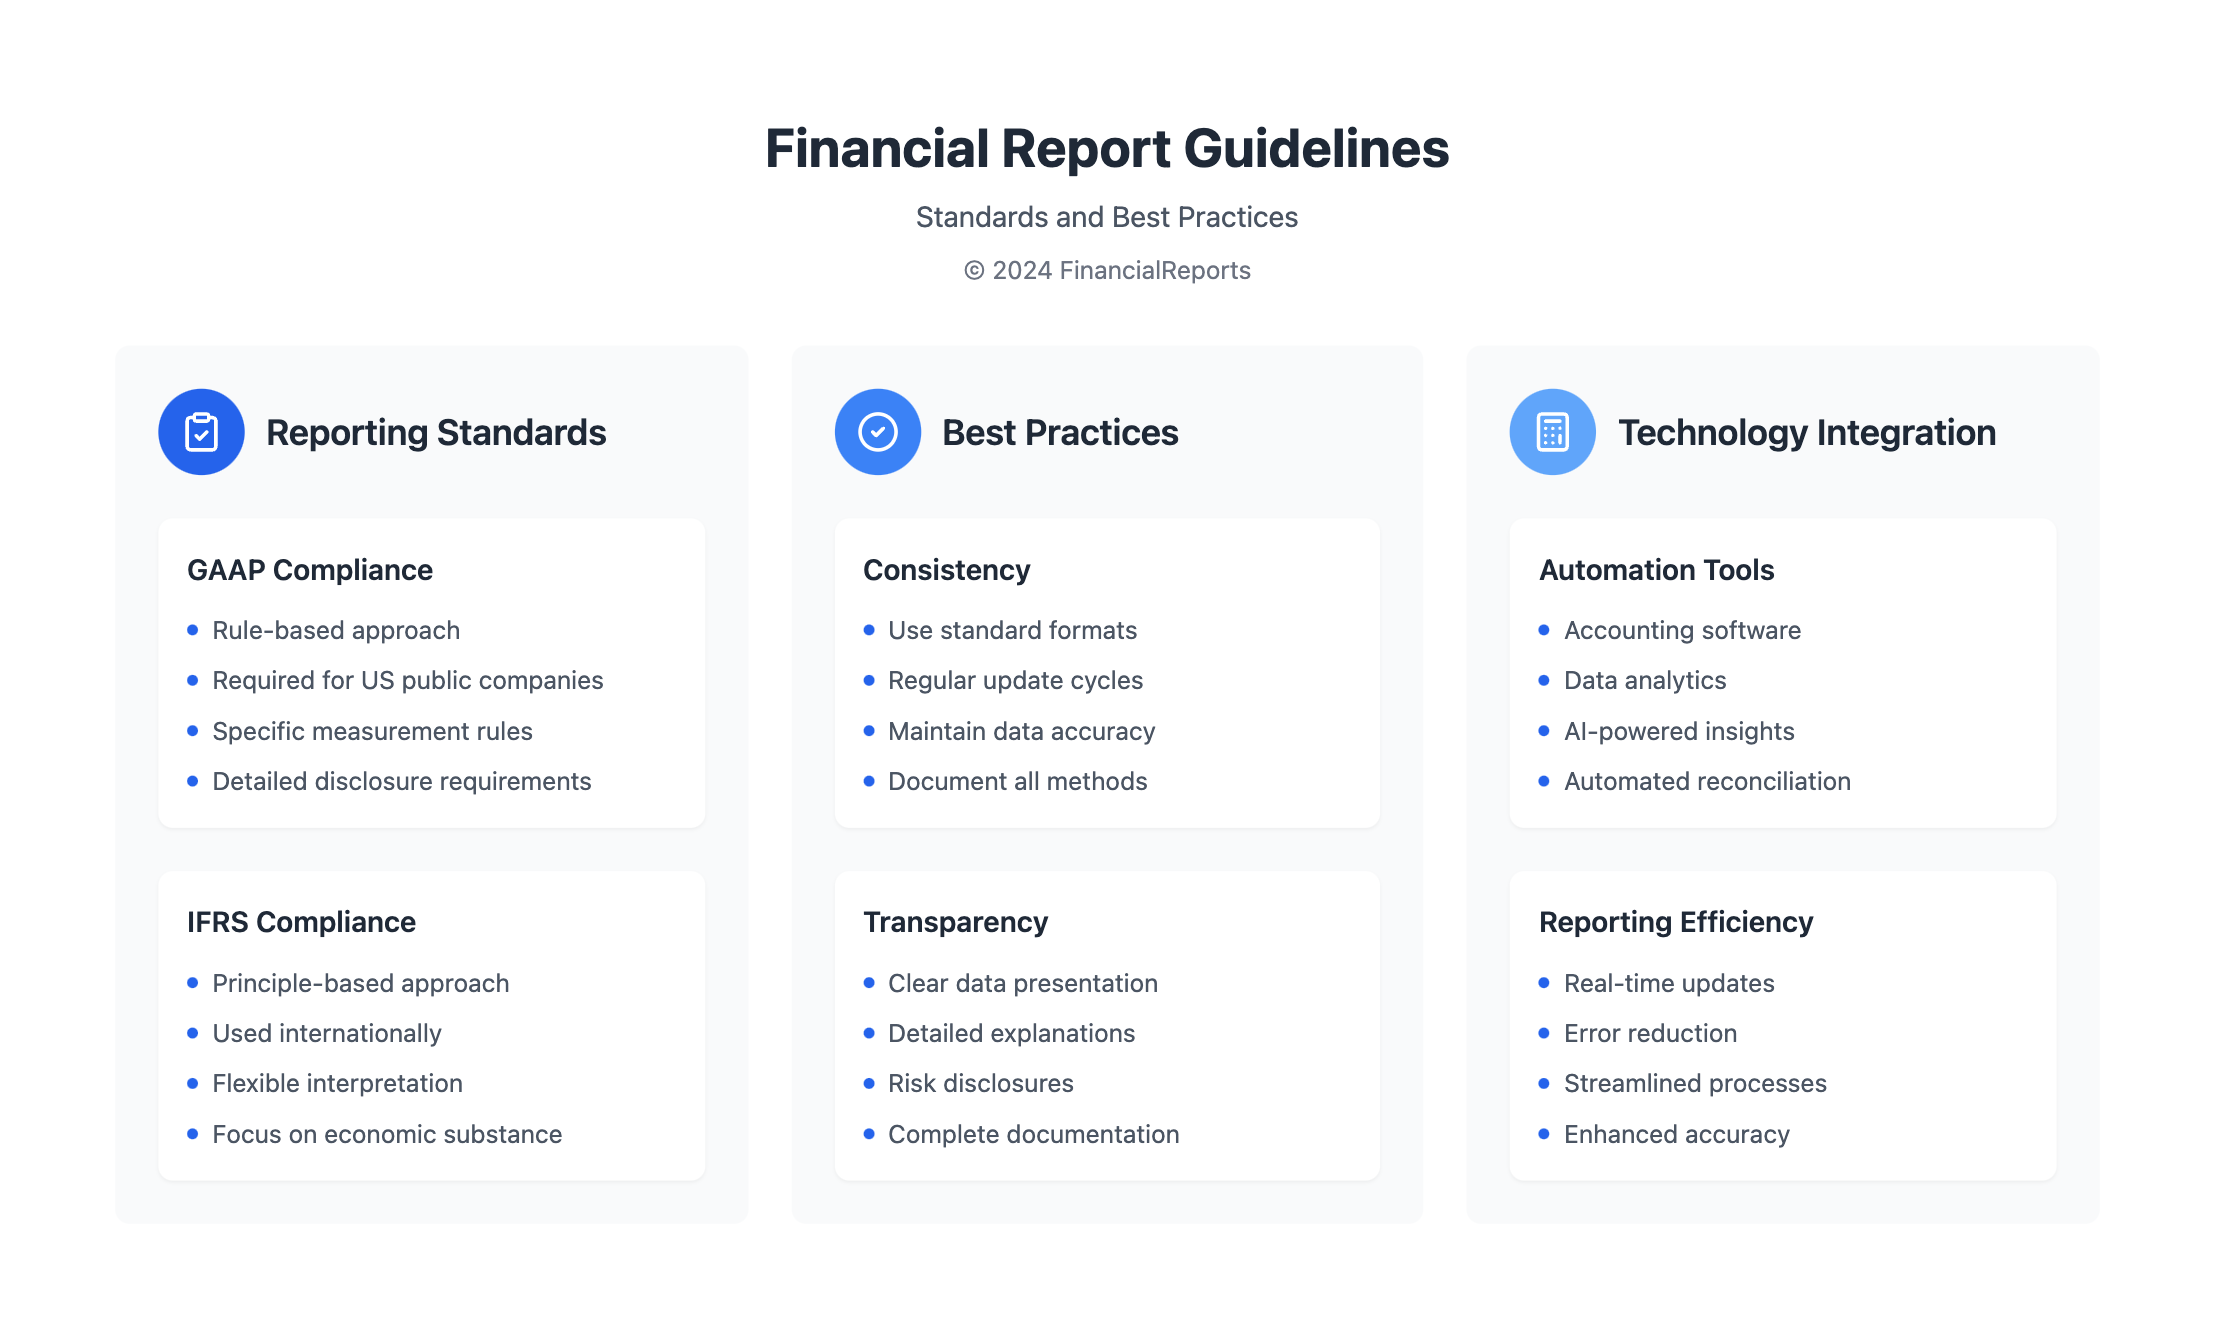
In the US, companies must follow GAAP, while international ones often use IFRS. This highlights how vital the financial report's format and its preparation are. They must meet industry standards and clearly communicate important financial information.
Key Takeaways
- Skilled financial report writing shows an accurate financial status.
- Well-organized reports clarify a company's story, keeping transparency and compliance.
- Knowing GAAP and IFRS is crucial for correct reporting in all countries.
- Regular reports reveal big economic trends and opportunities, like Susie's Cookies' 300% sales growth.
- Detailed reports point out risks and future predictions, such as cautioning against Mrs. Fields' expansion due to high costs.
Introduction to Financial Reports
Financial reports track a company's financial activities during a certain time. They are vital for measuring financial success and shaping future business strategies. Stakeholders like managers, investors, and government agencies use these documents. They provide a clear view of the company's financial state and its operations.
What is a Financial Report?
A financial report is a detailed summary of a company's finances, made every year or quarter. It has sections like balance sheets, income statements, and cash flow statements. These show the company's financial position in different areas. The main goal is to give investors information, promote openness, and fulfill regulatory needs.
Importance of Accurate Reporting
Being precise in financial reports is crucial. It builds investor trust and aids in making informed business choices. True reports show the real financial health and follow rules set by organizations like GAAP and IFRS. These organizations set the standards for financial reports in the U.S and globally.
Overview of Common Formats
Financial reports come in various styles, depending on the audience and the company's needs. But, common ones include Annual and Quarterly Reports. These provide crucial information for detailed analysis and making important decisions. Next, you will see a table showing different financial report templates and what they offer:
| Report Type | Key Components | Typical Use Case |
|---|---|---|
| Annual Report Template | Full year financial summary, CEO letter, Future Outlook | Annual shareholder meetings, Comprehensive year-end review |
| Q1 Report Template | Quarterly earnings, Forecasts, Segment Analysis | Quarterly investor updates, Internal strategic assessment |
| Financial Dashboard Template | Real-time financial data, KPIs, Trends | Management dashboards, Continuous financial monitoring |
| Business Report Template | Business activity analysis, Financial health indicators | Internal review, Business strategy planning |
Each reporting format meets different needs for how often and in-depth the financial monitoring and compliance are. They also help show trends in financial performance. This is key for the business to grow in a healthy way.
Key Components of a Financial Report
To understand a corporation's financial health, it's important to know three key statements. These statements together show the company’s financial success and performance. They give a full picture of financial status, which is vital for making strategic decisions.
Income Statement Explained
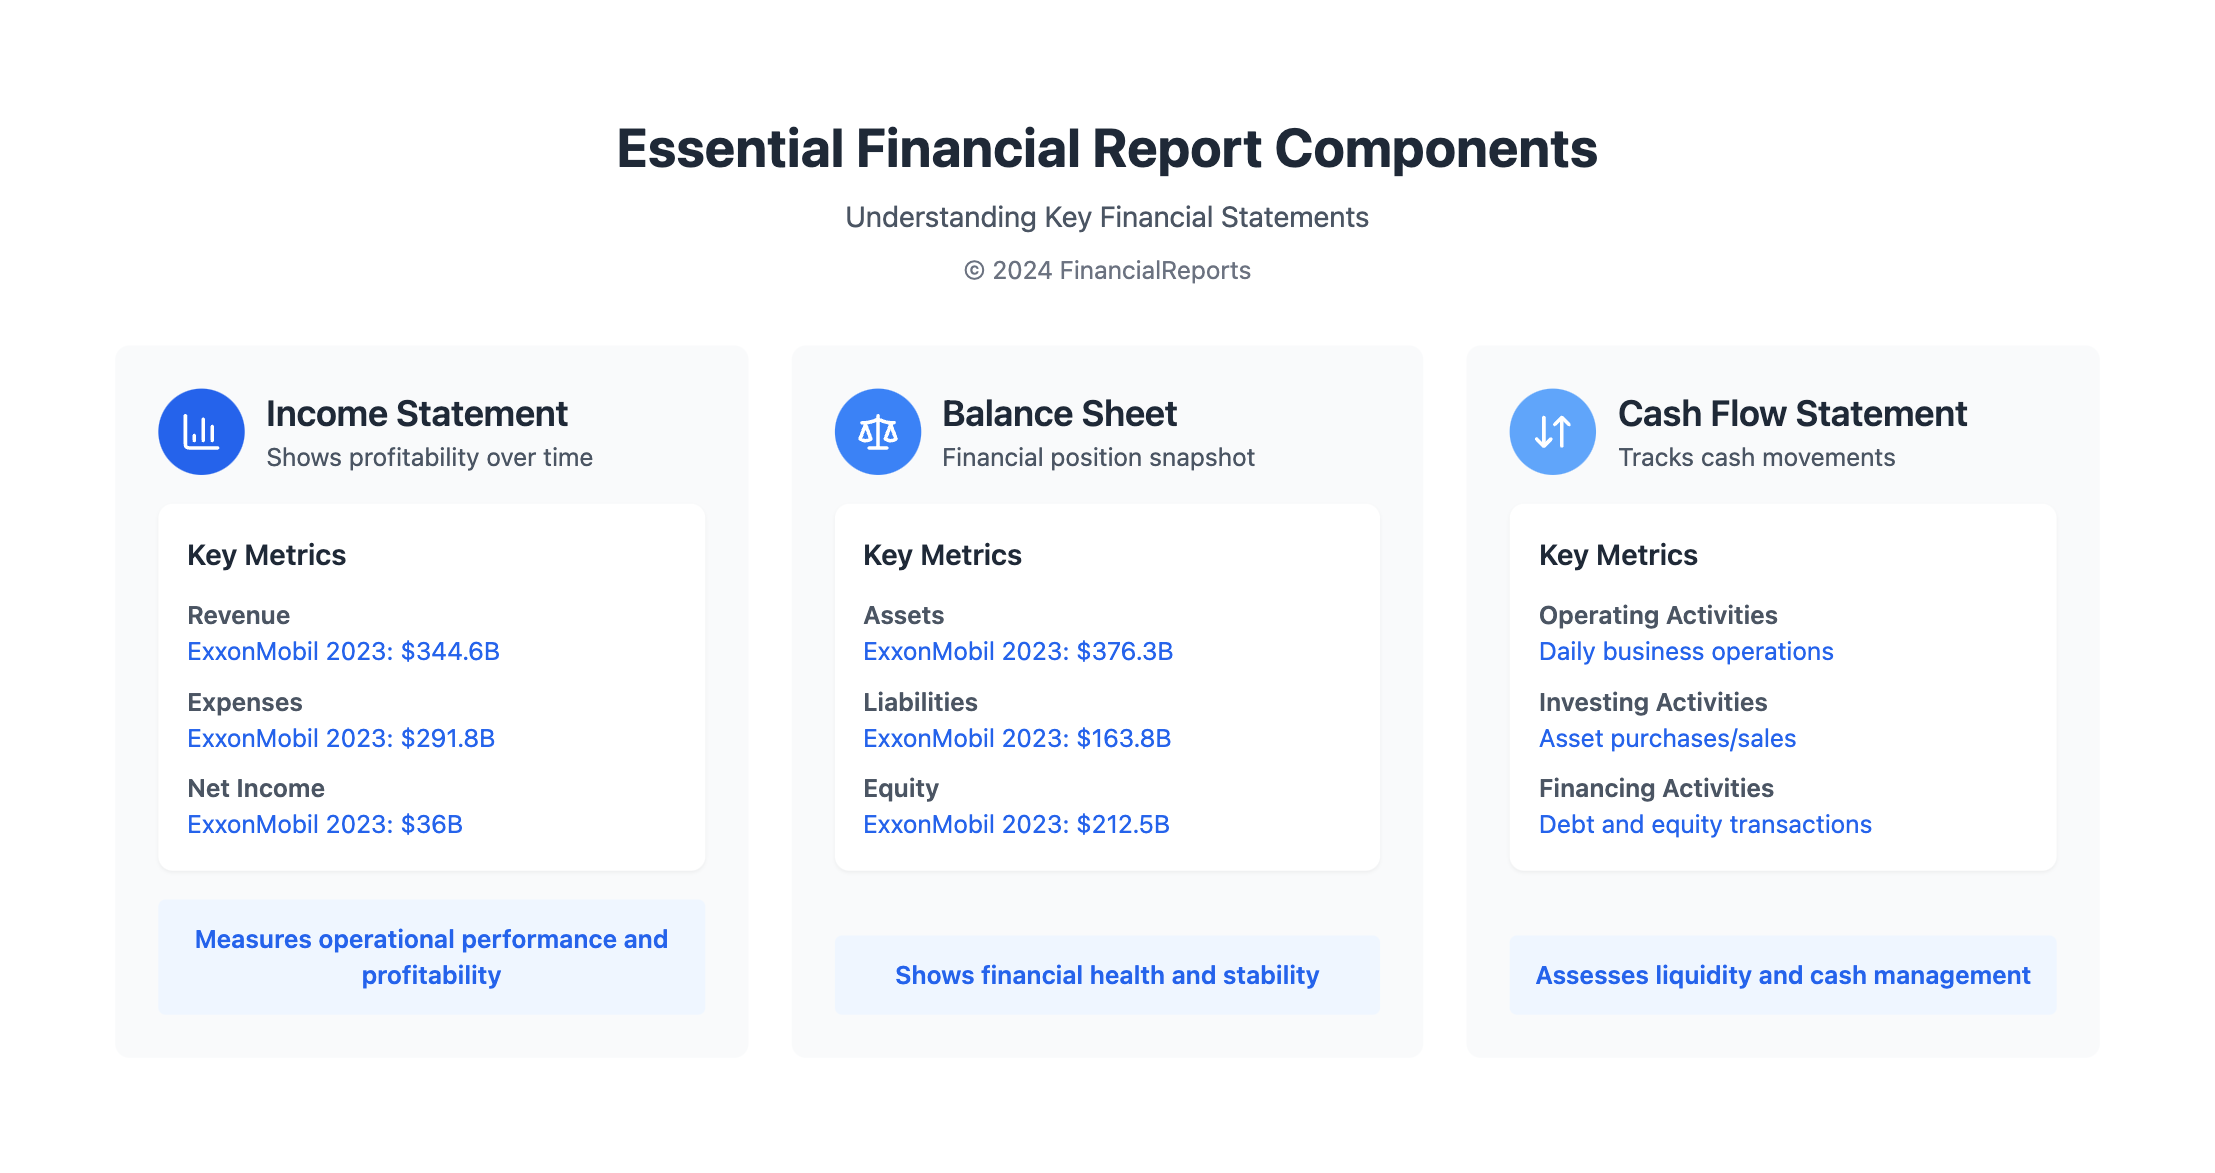
The income statement shows a company's profit during a certain time. It adds up all the money made and subtracts the costs to find the net income. For example, ExxonMobil Corporation had $344.6 billion in revenue and $291.8 billion in costs in 2023. This left them with a net income of $36 billion. This helps people see if the company is doing well over time and making money.
Balance Sheet Essentials
A balance sheet shows a company's financial situation at a specific time. It lists what the company owns and owes and the owners' share of the company. ExxonMobil's balance sheet in 2023 had assets of $376.3 billion and debts of $163.8 billion. Their equity was $212.5 billion. This info helps see if the company is financially strong or has too much debt.
Cash Flow Statement Overview
The cash flow statement tracks how cash moves in and out of the company. It is divided into operating, investing, and financing activities. This tells us how well the company is generating and using cash. Proper analysis of cash flow makes sure the company has enough money for its needs and to grow. This is key for the company's ongoing financial health and winning the trust of stakeholders.
- Asset Liquidity: Quick access to cash or assets that can easily be turned into cash is crucial for covering short-term needs.
- Debt Management: It's important to have good strategies for handling debts to improve the company’s financial standing.
- Cash Flow Analysis: Regularly checking cash flow helps with planning finances and running the business smoothly.
- Financial Prosperity: Being financially solid is necessary for lasting success and attracting more investments.
- Company Performance: Keeping an eye on financial numbers is important to understand the business's current state and future direction.
In summary, from the income statement to the cash flow statement, each part is crucial. They work together to show the full financial picture. This helps in making plans that lead to lasting financial success and great company performance.
Standard Financial Report Formats
Understanding financial standards and regulatory compliance is challenging for businesses. The choice between GAAP and IFRS impacts international reporting and business documentation. This decision is crucial for multinational corporations.
GAAP vs. IFRS: What’s the Difference?
GAAP is mainly used in the United States. It focuses on following specific rules and guidelines. IFRS is more common worldwide. It allows more flexibility based on the transaction context. It emphasizes general principles.
Choosing the Right Format for Your Business
Choosing the right reporting format is a strategic step. It affects how others view a company's financial health internationally. The format should match the company’s operations and local laws.
| Type of Report | Purpose | Key Components |
|---|---|---|
| Balance Sheet | Snapshot of financial position at a specific point in time | Assets, Liabilities, Equity |
| Income Statement | Show profitability over a period | Revenues, Expenses, Profits/Losses |
| Cash Flow Statement | Insight into cash inflows and outflows | Operations, Investing, Financing |
| Statement of Changes in Equity | Track changes in equity during the period | Net Income, Dividend Payments, Share Transactions |
Correctly using financial reports is key for regulatory compliance. It is vital for international work. It ensures transparency and consistent decision-making in international reporting and business documentation.
Understanding Financial Terminology
In finance, knowing a wide range of financial terms is key. This knowledge helps in analyzing and reporting data well. It's not just about learning new words. It's also about using this knowledge in real situations. This helps in making smart decisions and planning finances strategically.
Key Terms Defined
Many terms make up the financial world. They describe different parts of a business's finances. Here are some important terms:
- Liquidity: This tells us how fast assets can turn into cash. It's important for paying off short-term bills.
- Equity: This is what the shareholders own in the company. It's found by subtracting liabilities from total assets.
- Depreciation: This is when the value of a fixed asset goes down over time. It accounts for things like wear or becoming outdated.
Commonly Used Metrics and Ratios
There are important metrics and ratios for checking a company's financial health. Let's take a look at some common ones:
- Debt-to-Asset Ratio: This shows how much of a company's assets are covered by debt. It's total liabilities divided by total assets.
- Return on Investment (ROI): This measures how good an investment is doing. It helps compare different investments too.
- Current Ratio: This ratio is crucial. It shows if a company can pay its short-term bills with its short-term assets. You find it by dividing current assets by current liabilities.
Using these metrics and ratios helps financial pros give better insights. They offer a clearer picture of a company’s position. Knowing these financial basics is crucial. They help in making accurate financial reports and clear communication. This is essential for making informed decisions.
Customizing Your Financial Report
In today's fast-moving world, creating custom financial reports is essential. It’s crucial for meaningful stakeholder communication. By using report personalization and visual data representation, firms make financial details clearer and more impactful to their audience.
Tailoring to Stakeholder Needs
Adjusting financial reports is more than changing looks. It’s about showing data that matches what different stakeholders want. For example, managers may need deep details on performance, while investors might just want profit summaries. Each report can spotlight what matters most to its reader.
Platforms like NetSuite help craft these custom reports. They can design balance sheets, income statements, and cash flow reports with data presentation suited for countries like Australia, Canada, and the United States.
Incorporating Visual Elements
A report's design plays a big role in its success. Using colors, graphs, charts, and tables makes it more engaging and easier to understand. It's all about making complex data simple to navigate.
With tools like Common Size Statements, comparing financial data over time becomes easier. Adding custom sections or specific calculations in NetSuite also enhances a report. These features ensure every financial report is informative and meets high corporate standards.
Best Practices for Financial Reporting
Following best practices in financial reporting is key. It ensures financial accuracy, report consistency, strategic analysis, and business accountability. These practices help meet regulations and improve decision-making. They also keep investor trust high.
Consistency and Accuracy
For consistent and accurate reports, it's good to use standard formats and stick to key principles like GAAP. Doing this makes sure reports stay true over time. They become more reliable and comparable.
To keep reports accurate, checking the data carefully is a must. This includes reconciliations and reviews. A strong system for managing data ensures financial reports are trustworthy. It's important to have data that is correct, current, complete, and consistent.
Regular Updates and Reviews
It's crucial to update financial reports regularly. This ensures decisions are based on the latest information. Following guidelines from organizations like GFOA helps speed up year-end closings.
Reviewing reports often and communicating with auditors helps catch problems early. This avoids delays and keeps the financial integrity intact. It also makes sure the insights from the reports are timely and useful.
| Report Type | Key Components | Importance in Strategic Analysis | Frequency |
|---|---|---|---|
| Income Statement | Revenue, Expenses, Profit/Loss | Assess Operational Efficiency | Monthly/Quarterly/Annually |
| Balance Sheet | Assets, Liabilities, Equity | Evaluate Financial Health | Quarterly/Annually |
| Cash Flow Statement | Operating, Investing, Financing Activities | Understand Liquidity Position | Monthly/Quarterly/Annually |
| AR Aging Report | Current, 30, 60, 90+ Days Outstanding | Monitor Collection Efficiency | Monthly |
| Budget vs. Actual | Planned vs. Actual Spending and Revenue | Control Budget Variances | Quarterly/Annually |
Adding these practices into the reporting process secures compliance. It also helps in refining financial management and strategic planning.
Legal Considerations in Financial Reporting
In financial reporting, it's crucial to stick to ethical reporting and follow the laws closely. This makes sure that all financial details shared are clear. It helps in maintaining strong financial governance and meeting regulatory standards.
Compliance with Regulations
For accurate financial reporting, companies must follow local and international rules. In the U.S., the Generally Accepted Accounting Principles (GAAP) are key. Around the world, International Financial Reporting Standards (IFRS) are more common. Standards like SAS No.122, since December 15, 2012, also play a big role in keeping audits up to the mark.
Audits include checks to make sure laws and rules affecting financial statements are followed. These steps prevent legal issues like fines or lawsuits from mistakes in reporting. Being fully compliant enhances ethical reporting and strengthens a company's financial reputation.
Avoiding Misleading Information
Avoiding false financial information is very important. Regular checks ensure the accuracy of financial data and guard against significant mistakes. Auditors are critical in this process. They work to confirm that the financial info reflects the true financial state of a company.
Audits involve talking to management and reviewing communications with regulators. This thoroughness is vital not only to follow financial laws but to keep reporting transparent and reliable. It supports ethical reporting and regulatory standards.
| Financial Statement | Compliance Requirement | Framework | Effective Date |
|---|---|---|---|
| Balance Sheet | Full disclosure under GAAP/IFRS | GAAP (FRS 102) | On/after 15 Dec 2012 |
| Income Statement | Accurate profit and loss reporting | IFRS | On/after 15 Dec 2012 |
| Cash Flow Statement | Reflection of actual cash flows | Direct/Indirect method under IFRS | On/after 15 Dec 2012 |
| Statement of Equity | Changes in equity must be detailed | IFRS/UK GAAP | On/after 15 Dec 2012 |
These rules and specific needs for different statements highlight the commitment to honest reporting. They show the importance of following financial laws to keep governance strong.
Utilizing Technology in Financial Reporting
Technology has changed financial reporting a lot. It makes things faster and more accurate. Financial reporting automation helps finance professionals make better decisions.
Role of Accounting Software
Updates in financial report software bring new accounting innovation and technological efficiency. AI and data analytics help teams work better with financial data. For example, using AI in financial report software leads to more accurate financial forecasts.
Automation Tools for Efficiency
Data automation tools make tasks like data entry quicker and with fewer mistakes. This keeps financial data accurate, which is very important. These systems work well with current financial setups, making things more open and responsible.
| Technology | Benefits | Usage % Increase Forecast |
|---|---|---|
| AI and Automation | Accuracy, speed, fewer SEC inquiries/restatements | 97% in 3 years |
| Natural Language Processing | User-friendly data requests, higher adaptation | N/A |
| Financial Reporting Automation | Increased productivity, fraud prevention | N/A |
The table shows how much companies trust technology for better financial reporting. Many are upgrading their systems with the best software and tools. This change is essential for meeting today's financial challenges.
Analyzing Financial Reports
Understanding financial reports is key for managing well and making smart decisions. With tools like financial analysis, business intelligence, and performance evaluation, you can predict and plan better. This knowledge helps in looking ahead and mapping out strategies.
Interpreting Financial Statements
Financial statements show a company's financial health. Each has a unique role in this. By analyzing them, we can see if a company is doing well and where it stands in the market.
Using different analysis methods, experts find out about a company's finances. This includes details on assets, debts, earnings, and money flow. These give a full picture of the company's financial moves.
Identifying Trends and Insights
Looking at financial trends helps predict the future and check a company's health. Key metrics guide in making forecasts and choices. This analysis is vital for spotting risks and chances and making sure business plans fit with market needs.
It helps companies navigate through tough financial situations.
| Financial Metric | Description | Impact on Business Decisions |
|---|---|---|
| Profit Margin on Sales | Indicates the percentage of revenue that turns into profit | Helps in assessing pricing strategies and operational efficiency |
| Debt-to-Equity Ratio | Compares the company's total liabilities to its shareholder equity | Crucial for analyzing financial leverage and risk management |
| Current Ratio | Measures liquidity by comparing assets that can be converted into cash within a year to liabilities due within a year | Assists in evaluating short-term financial stability |
| Inventory Turnover Ratio | Shows how often a company's inventory is sold and replaced over a period | Important for managing inventory levels and optimizing stock to meet sales |
| Return on Equity | Measures profitability by revealing how much profit a company generates with the money shareholders invested | Used to gauge the efficacy of management in using equity investments to grow the business |
Presenting Your Financial Report
Before you show a financial report, learn the skill of financial storytelling. This makes sure the data teaches and keeps the audience interested. A structured format helps. It appeals to the logical and imaginative sides of those listening. This approach makes a report presentation effective.
Structuring a Presentation
Structuring your financial talk is more than just slide order. You need to deeply get what you're saying and its bigger picture. This kind of structure guides listeners through your money story clearly. Every part should back up the main message.
You should highlight important numbers and get ready for detailed analysis. Also, think about the questions your audience might ask. This helps make your message clear.
Engaging Your Audience
Financial information is often complex. So, using strong visual tools and methods is crucial to keep your audience interested. Tools like PowerPoint, Excel, and Tableau make complex data simple. They also focus on important points visually. Make sure your visuals match what your audience knows about finance. This makes your report easy to understand and useful.
| Tool | Description | Usage Tip |
|---|---|---|
| Excel | Spreadsheets that allow detailed data analysis | Use pivot tables for summarizing data |
| Tableau | Advanced analytics and business intelligence | Incorporate dynamic elements like live dashboards |
| PowerPoint | Presentation software for straightforward slide creation | Employ strong visual themes to maintain consistency |
Turning numbers into a story makes them more impactful. This storytelling with your data helps with better insights and decisions. Using these methods not only boosts your financial storytelling but also keeps your audience engaged. It makes your financial report successful.
Sample Financial Report Formats
Financial landscapes are always changing. This means we need strong financial templates and benchmark formats. They must be clear and give actionable insights. Financial reports let stakeholders understand a company's financial health. They follow industry standards. Sample reports show how top companies share their financial details. This way, they are easy to understand and meet rules. We'll look at some leading company reports below. They are great examples of how to communicate financial information well.
Template Overview
Financial templates and standards are very important in the business world. They are more than just documents. They are guides for telling the financial story of a company. These templates make complex financial data easy to understand. They turn numbers into strategic insights. Every part of the template highlights key financial info like cash flows, earnings, and debts. This makes sure they meet industry standards and rules.
Examples from Leading Companies
Looking at reports from big firms shows how detailed and organized they are. Other companies can learn from these examples. This could help them improve their own financial reports. Below, you'll see how different reports aim to meet various business goals and the needs of their audiences.
| Type of Report | Visualization Used | Frequency | Primary Audience |
|---|---|---|---|
| Annual Financial Report | Bar graphs, pie charts | Yearly | Investors, Regulatory Bodies |
| Daily Cash Flow Report | Line graphs | Daily | Internal Management |
| Monthly Financial Reports | Stacked column charts | Monthly | Department Heads, External Auditors |
| Profit and Loss Statement | Comparative columns | Quarterly | Board Members, Financial Analysts |
| Yearly Budget Report | Area chart | Yearly | Stakeholders, Budget Committees |
These examples show the variety in financial reporting. It all depends on the benchmark formats and leading company reports. The basics stay the same to meet industry standards. Yet, the way data is shown can change a lot. It all depends on who needs to see it and what the company's goals are.
Conclusion and Next Steps
The study of financial report formats shows they're important for strategic management. These formats give business insights. This helps financial pros make reports better.
It's key to note the success of New Status Determinations, with an 81.2% finish rate in 90 days. This sets a standard for timely, efficient financial reports.
Recap of Key Takeaways
We've looked at the deep details of financial reports. This includes income and balance statements and year-end report nuances. These elements help predict future finances.
It's crucial to follow rules like GAAP and use tech like automation. Continuous learning in finance terms is needed too. Daily checks ensure financial reports are exact and thorough.
Resources for Further Learning
Many resources are there for learning more, including templates. These compare actual financials to plans. They help see past and future finances through strategic planning.
With 91.7% of reports filed on time and a high rate of timely successor status decisions, financial reporting shows dedication to betterment and precision. We must keep pushing for excellence and accuracy.
FAQ
What is the purpose of a financial report?
A financial report details a company's financial activities over a period. It shows cash flows, assets, and more. This info helps in making important decisions.
Why is accuracy important in financial reporting?
Accuracy is key to trust in a company's financial health. It helps meet laws, make decisions, and guide investments. Being accurate supports good corporate management too.
What are the common formats of financial reports?
Financial reports come as income statements, balance sheets, and cash flow statements. They can be quarterly or yearly. They follow standards like GAAP in the US or IFRS globally.
How does GAAP differ from IFRS?
GAAP is US-based with specific rules. IFRS offers broad guidelines for global use. The choice depends on location and regulations.
What is the significance of understanding financial terminology?
Knowing financial terms is essential for clear reports. It makes data precise and relevant, helping assess financial status.
Why should financial reports be tailored to stakeholder needs?
Custom reports help stakeholders understand better. They focus on what's important, making information more useful.
What are the best practices for financial reporting?
Good reporting means being consistent and accurate. It follows standards, is updated regularly, and clearly presents data.
How can companies ensure compliance with financial regulations?
Following standards like GAAP or IFRS helps with compliance. Stay updated on laws, audit regularly, and be transparent.
What role does technology play in financial reporting?
Technology offers tools for better reporting. It brings efficient data handling and accuracy, improving the whole process.
How is financial report analysis conducted?
Analysis looks at performance and trends from reports. It uses data to predict future finances and assess health.
What considerations should be taken into account when presenting a financial report?
Present reports clearly and engage your audience. Use storytelling to share the company's journey and goals.
Where can businesses find sample financial report formats?
Look at industry leaders for sample formats. They offer templates that guide clear and compliant reporting.