Discover the Ideal PEG Ratio for Smart Investing
The price/earnings-to-growth ratio, or peg ratio, is key for figuring out a stock's worth. It looks at the company's expected earnings growth. This gives a clearer view of a stock's value than just the P/E ratio.
Knowing what makes a good peg ratio is vital for smart investing. It helps spot undervalued stocks and boost returns. The peg ratio is simple: it's the stock's P/E ratio divided by its earnings growth for a set time.
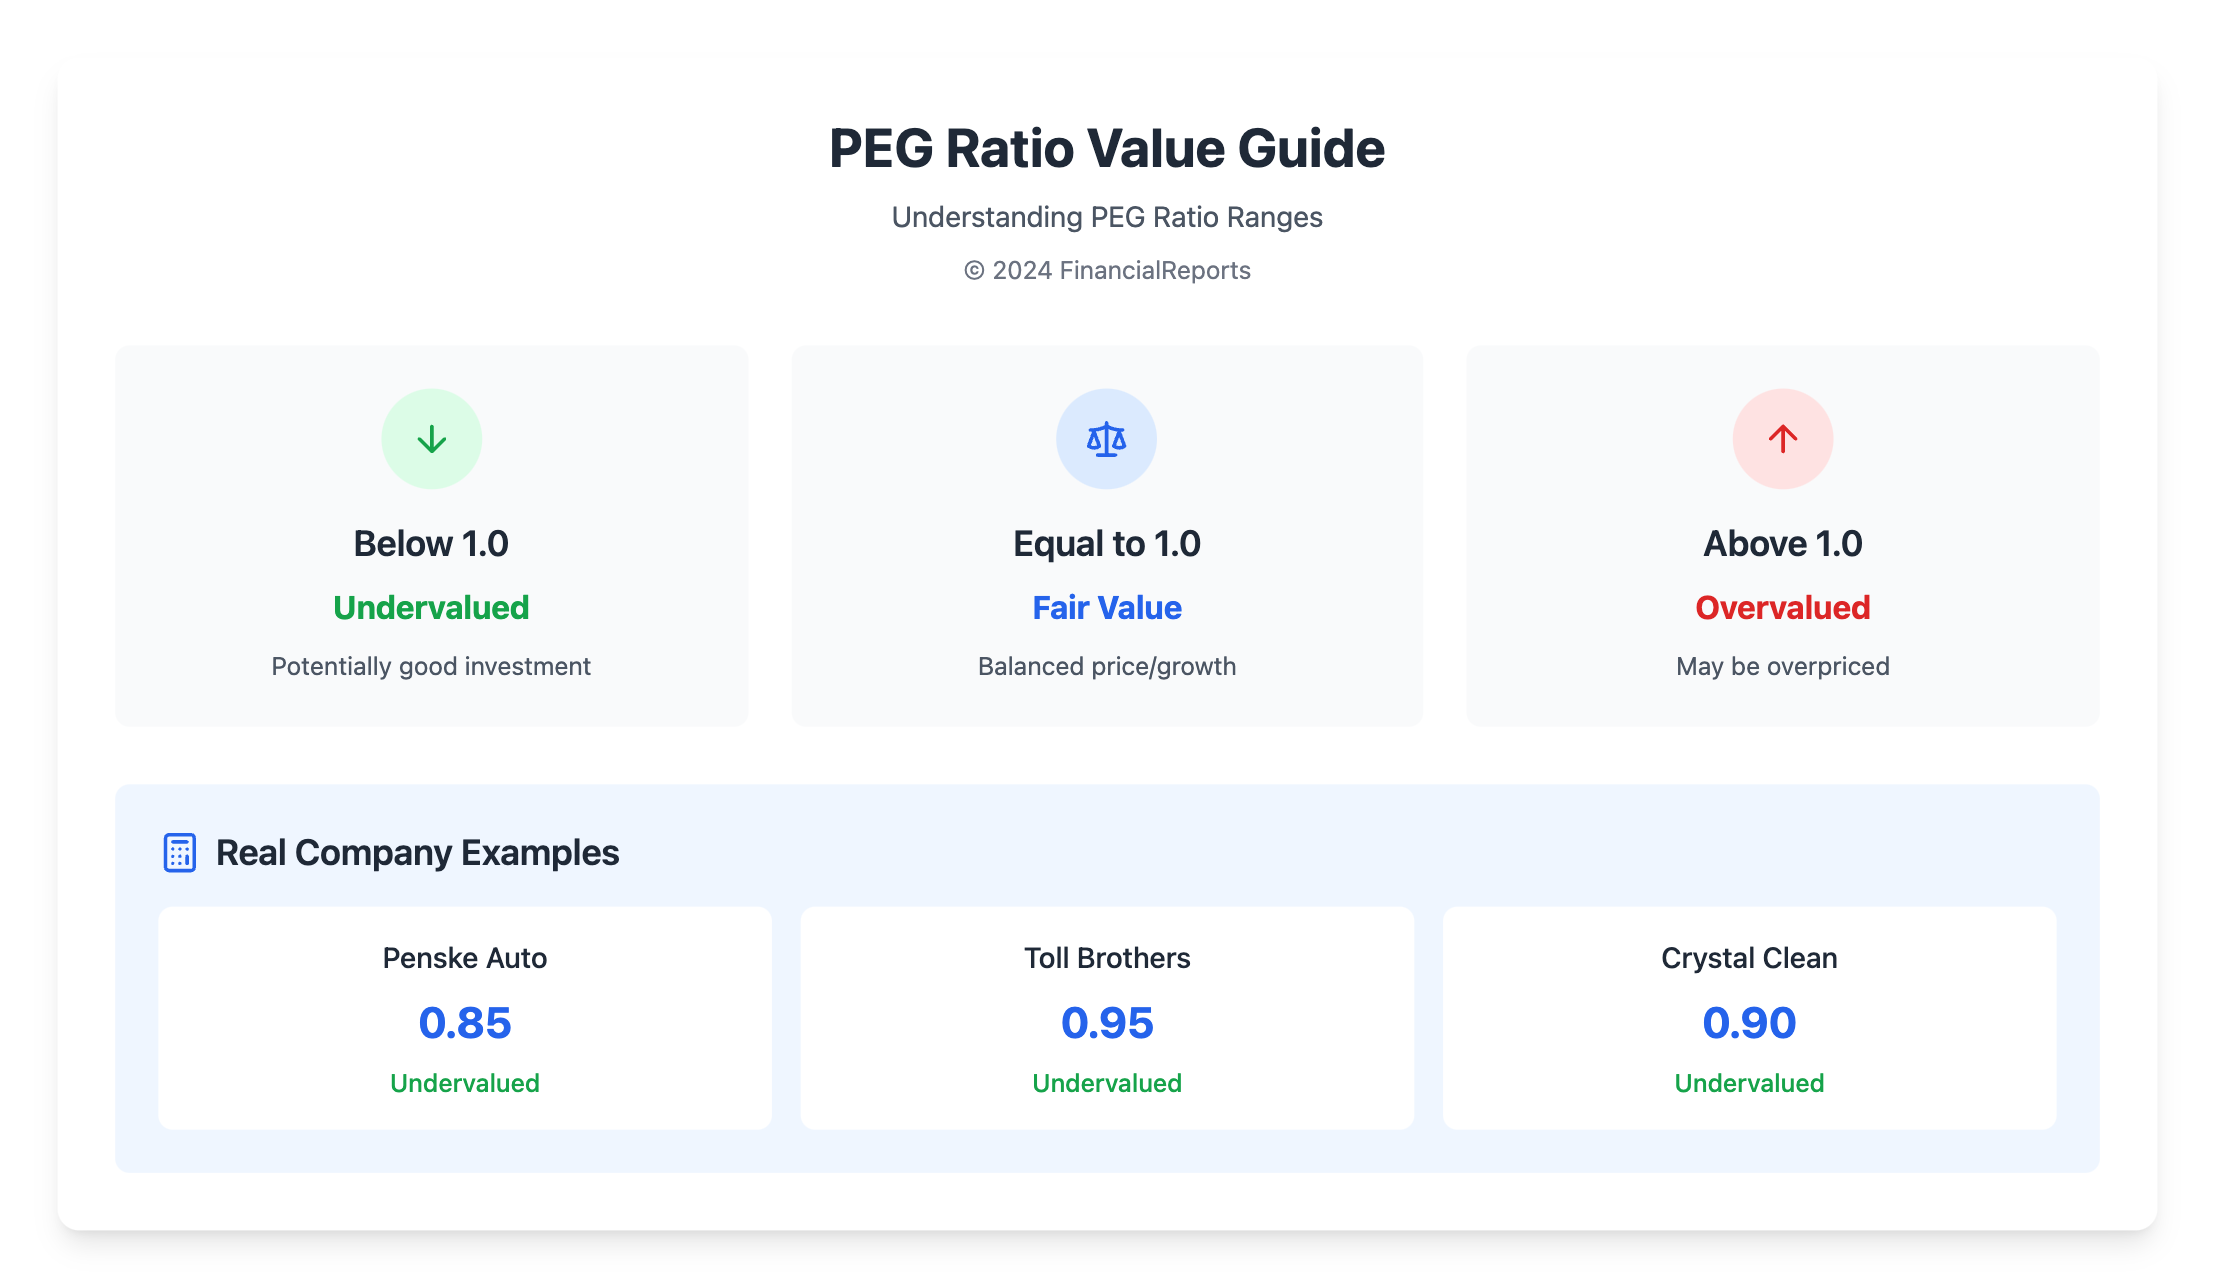
A peg ratio under 1.0 is the best, showing a company is underpriced. Investor Peter Lynch says a peg ratio of 1.0 is fair. A higher ratio means a stock is overvalued, and a lower ratio means it's undervalued.
The aim is to find a peg ratio that shows a stock might be undervalued. This makes it a key part of smart investing.
Key Takeaways
- The peg ratio is a key factor in smart investing, giving a fuller view than P/E ratio for stock value.
- A peg ratio lower than 1.0 is considered best, showing a company is relatively undervalued.
- Understanding what is a good peg ratio is essential for spotting undervalued stocks and boosting returns.
- The peg ratio meaning is simple: it's a stock's price-to-earnings ratio divided by the growth rate of its earnings for a specified time period.
- A peg ratio below 1 generally signifies an undervalued stock, making it an attractive option for investors.
- Investors should consider the peg ratio when making investment decisions, as it provides a more complete picture of a stock's value.
- The peg ratio is a key metric used to determine a stock's value, and understanding its significance is essential for smart investing.
What is the PEG Ratio and Why is it Important?
The PEG ratio is a way to value a company by looking at its earnings growth. It's more detailed than the P/E ratio. Investors use the peg ratio formula to see a stock's real worth. This ratio divides the P/E ratio by the earnings growth rate, giving a clearer picture of a stock's future.
A low PEG ratio means a stock might be a good buy. Stocks with a PEG ratio under 1 are seen as cheap. Those with a ratio over 1 are thought to be too pricey. The peg formula focuses on earnings growth, which is key for fast-growing companies.
Definition of PEG Ratio
The PEG ratio compares a company's market value to its expected earnings growth. It's a key tool for investors. It helps figure out if a stock is worth its price, too cheap, or too expensive.
Importance in Valuation
The PEG ratio is vital for understanding a stock's value. It looks at earnings growth, helping investors make smarter choices. Here's why the PEG ratio matters in valuation:
| PEG Ratio | Interpretation |
|---|---|
| Less than 1 | Undervalued |
| Equal to 1 | Fairly valued |
| Greater than 1 | Overvalued |
With the PEG ratio, investors can better understand a stock's value. This helps them make more informed choices.
How to Calculate the PEG Ratio
The PEG ratio is a key tool for investors. It's easy to figure out. To calculate the PEG ratio, you need two things: the stock's P/E ratio and its expected earnings growth. The PEG ratio formula is: PEG Ratio = (P/E ratio) / Expected annual EPS growth.
Let's say a stock has a P/E ratio of 16 and its earnings grow by 15% yearly. The PEG ratio would be 1.07. This shows the stock's price is 1.07 times its growth rate. To get the right PEG ratio, use the correct P/E ratio and growth rate.
The Formula Explained
The PEG ratio formula is simple but needs accurate data. The P/E ratio is the stock's price divided by its earnings per share. To find the expected growth rate, look at the company's financials and analyst predictions.
Step-by-Step Calculation Guide
To calculate the PEG ratio, just follow these steps:
- Find the stock's current price and earnings per share.
- Calculate the P/E ratio by dividing the stock's current price by its earnings per share.
- Research the company's expected growth rate.
- Use the PEG ratio formula to calculate the PEG ratio.
| Stock | P/E Ratio | Expected Growth Rate | PEG Ratio |
|---|---|---|---|
| Company A | 16 | 15% | 1.07 |
| Company B | 12 | 10% | 1.20 |
By following these steps and using the PEG ratio formula, you can calculate the PEG ratio for any stock. This helps you make better investment choices.
Significance of a Good PEG Ratio
A good PEG ratio is usually 1 or less. This means a stock is fairly priced compared to its earnings growth. If a PEG is lower than the industry average, it might mean the stock is undervalued. This could be a good time to invest.
For example, a company with a PEG ratio of 0.5 is likely cheaper than its peers.
To figure out a good PEG ratio, look at the company's growth and compare it to the industry. A low PEG ratio doesn't always mean the stock is a good buy. It could mean the company is growing slowly. But, a high PEG ratio might show the stock is overvalued. Yet, if the company is growing faster than others, a higher PEG ratio might be okay.
When checking a company's PEG ratio, keep these things in mind:
- Look at the company's past and current PEG ratios.
- Compare the company's PEG ratio to the industry and its competitors.
- Think about the company's growth and earnings outlook.
By looking at these points and understanding what makes a good PEG ratio, investors can make smart choices. If the PEG is lower than the industry average, it could mean the stock is a good deal. But, always check the company's growth and industry standards before investing.
| PEG Ratio | Interpretation |
|---|---|
| Less than 1 | Undervaluation, possible investment opportunity |
| Equal to 1 | Fair pricing |
| Greater than 1 | Overvaluation |
Industry Standards for PEG Ratios
PEG ratios vary across industries because of growth rates and market dynamics. The peg of stock is key in valuing a company. Knowing the peg value is vital for investors. A peg multiple helps compare PEG ratios of companies in the same field.
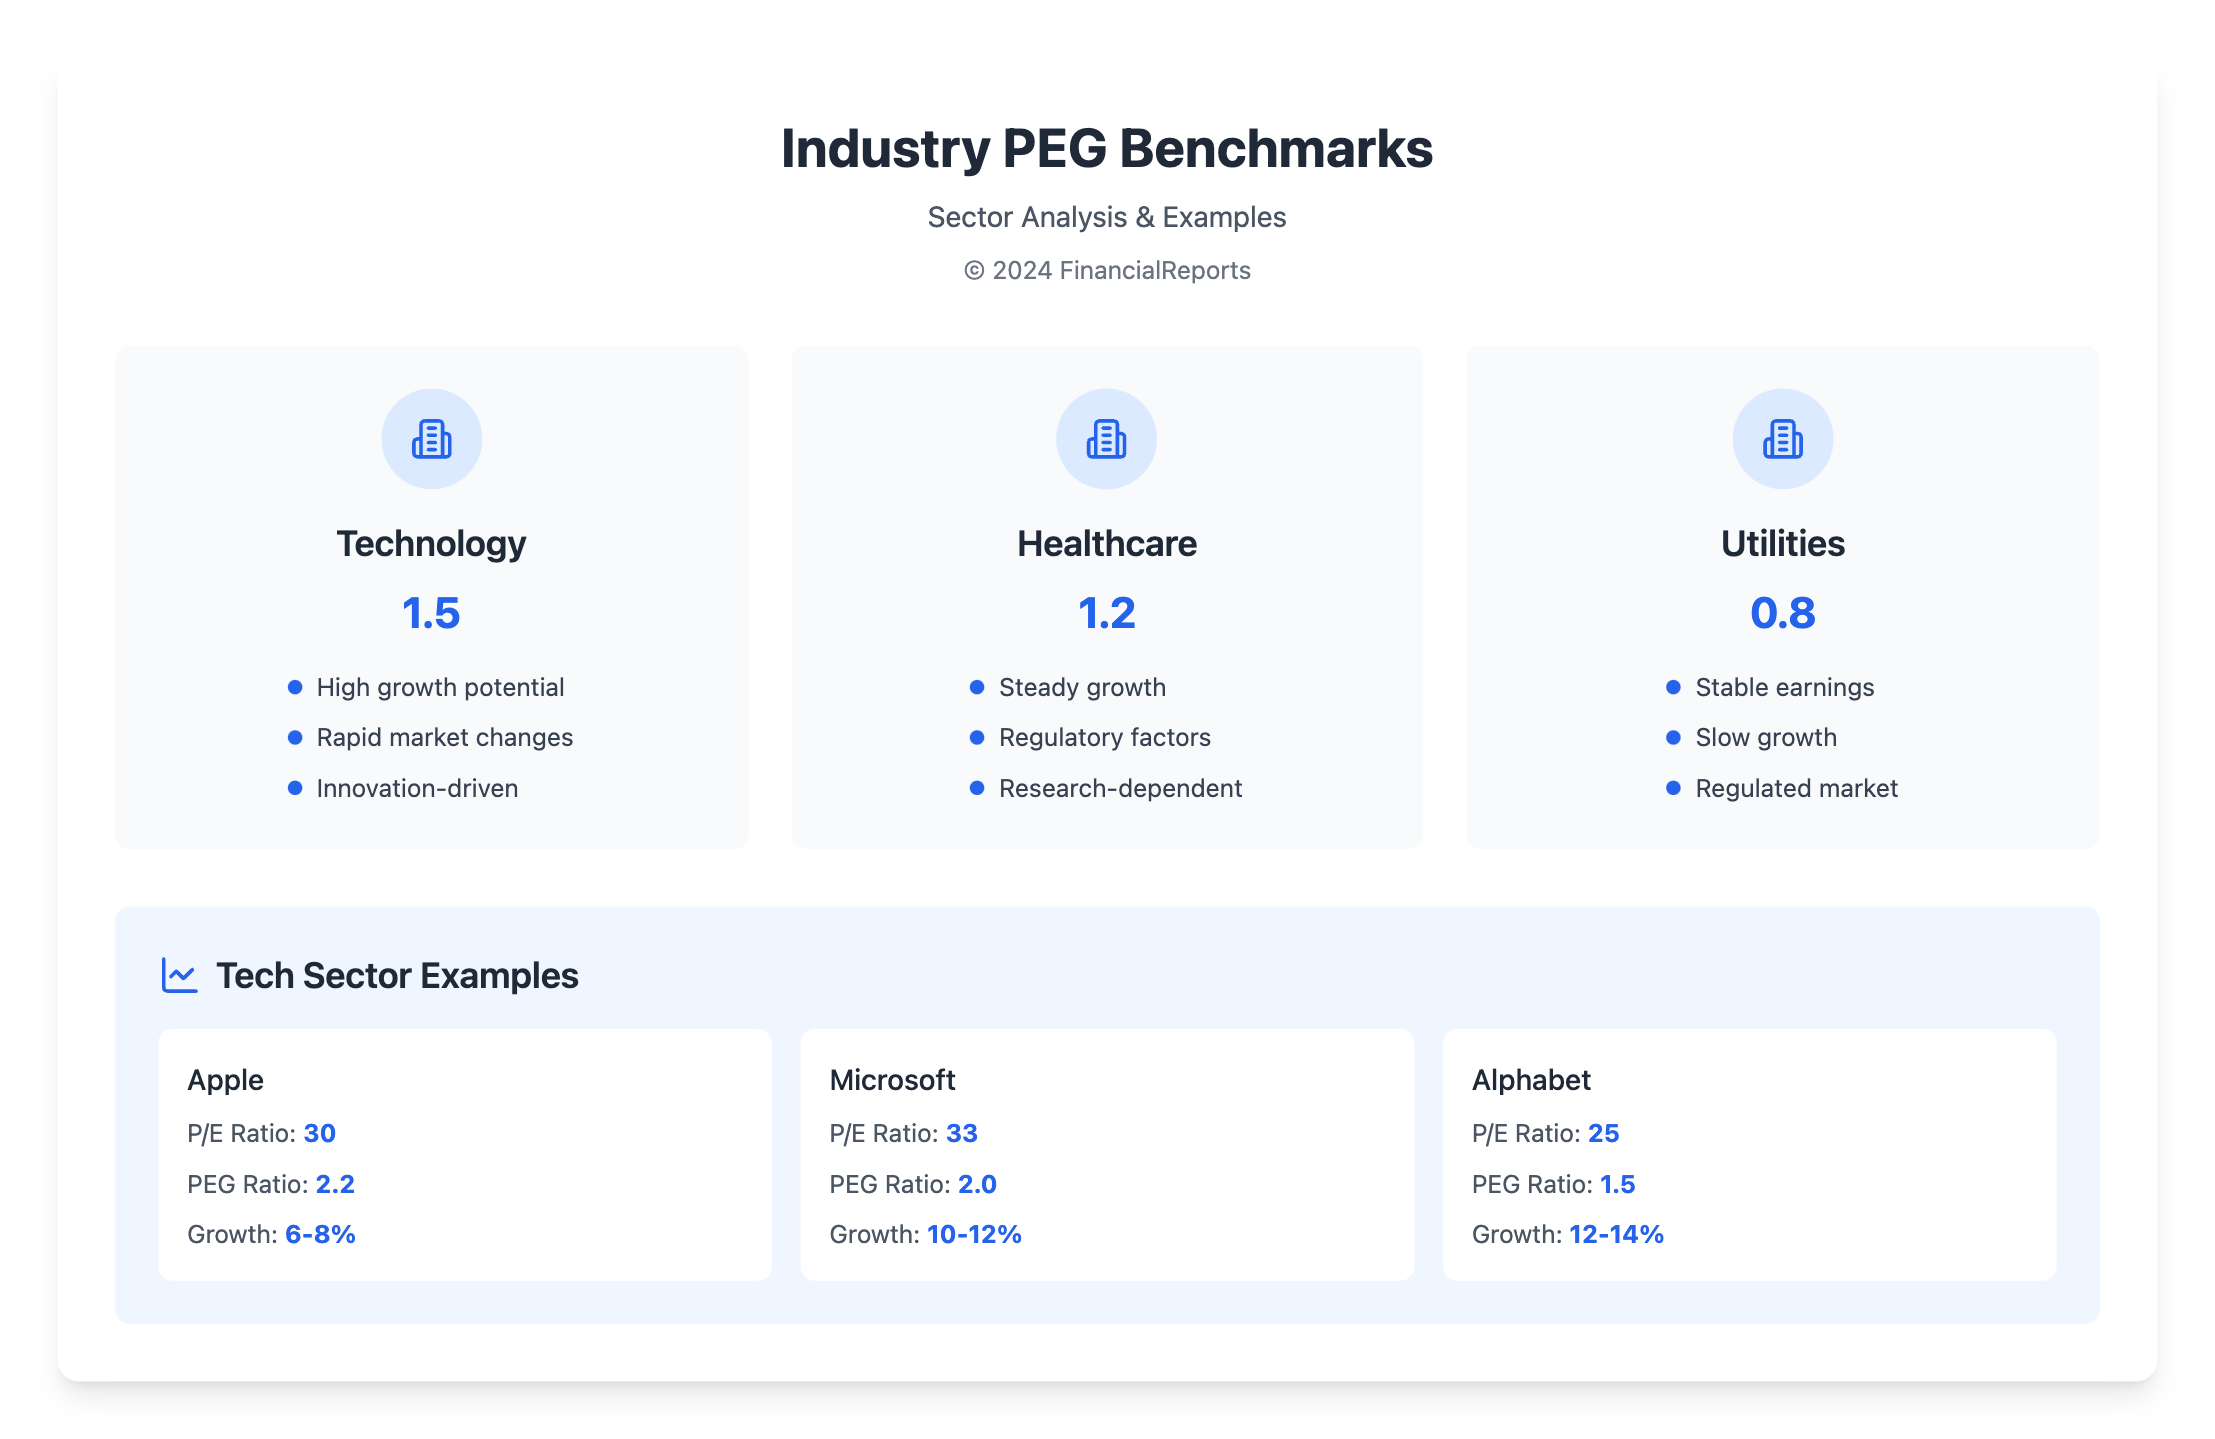
When looking at a company's PEG ratio, the industry average is important. For instance, tech has high PEG ratios because of its fast growth. Utilities, on the other hand, have lower ratios due to steady but slow growth. Here's a table showing average PEG ratios for various industries:
| Industry | Average PEG Ratio |
|---|---|
| Technology | 1.5 |
| Utilities | 0.8 |
| Healthcare | 1.2 |
Knowing industry PEG ratio standards helps investors make better choices. A PEG ratio of 1 or less might mean a stock is cheap. But a ratio over 1 could suggest it's overpriced. Yet, it's also important to look at the company's financial health and future growth.
Limitations of the PEG Ratio
The PEG ratio is a useful tool in peg finance. But, it has its own limits that investors need to know. It relies on earnings estimates, which can sometimes be wrong, mainly when they're too high or too low.
Contextual Factors to Consider
Many things can affect how reliable the PEG ratio is. Getting earnings forecasts right is key, but it's hard because of market changes and surprises. The PEG ratio also doesn't look at a company's financial health, like its balance sheet or cash flow.
Situations Where PEG Falls Short
In some cases, the PEG ratio can be misleading. For companies with earnings that go up and down a lot, like those in the materials sector, it's hard to use. Also, companies going through big changes might show a PEG ratio that doesn't really show their value. And, for companies with earnings going down, like JPMorgan (JPM) and Bank of America (BAC), the PEG ratio doesn't work well.
| Company | P/E Ratio | Growth Rate | PEG Ratio | Assessment |
|---|---|---|---|---|
| Amazon (AMZN) | 41x | 29% | 1.4x | Overvalued |
| Verizon (VZ) | 8x | 1% | 6x | Overvalued |
| VF Corp (VFC) | 9x | 22% | 0.41x | Undervalued |
| Conagra (CAG) | 10x | 3% | 3.3x | Overvalued |
| JPMorgan (JPM) | 15.4x | -4% | — | Meaningless |
| Bank of America (BAC) | — | - | — | Meaningless |
Using the PEG Ratio in Investment Strategies
Investors often use the PEG ratio with other metrics to understand a stock's value. The peg price is key in this, showing if a stock is cheap or pricey. This helps investors decide wisely.
Using the PEG ratio with other tools like price-to-book ratios and discounted cash flow analysis is smart. It helps spot undervalued growth stocks. For instance, a stock with a low PEG ratio and high pe ratio growth could be a good pick.
| Company | PEG Ratio | PE Ratio Growth |
|---|---|---|
| Apple Inc. | 1.66 | 10.77% |
| Coca-Cola Co | 2.40 | 7.14% |
Looking at the PEG ratio and pe ratio growth helps investors make better choices. It's important to look at many metrics. But, remember, the PEG ratio assumes growth that might not always happen.
Comparing PEG with Other Ratios
Investors use many financial ratios to check a company's value. The PEG ratio and the P/E ratio are two common ones. The PEG ratio definition looks at a company's growth, while the P/E ratio is a general value measure. Knowing the difference between PE ratio indicates vs PEG helps investors make better choices.
The PEG ratio includes a company's expected growth. This gives a fuller view of its value. For instance, a high P/E ratio might seem too high, but a strong growth rate could make the PEG ratio more appealing. On the flip side, a low P/E ratio might look good, but weak growth could make the PEG ratio less attractive.
| Company | P/E Ratio | PEG Ratio | Expected Growth Rate |
|---|---|---|---|
| Apple (AAPL) | ~30 | ~2.2 | 6%-8% annually |
| Microsoft (MSFT) | ~33 | ~2.0 | 10%-12% annually |
| Alphabet (GOOGL) | ~25 | ~1.5 | 12%-14% annually |
In summary, the PEG ratio gives a detailed look at a company's value by considering its growth. By understanding the PEG ratio and other ratios like the P/E ratio, investors can make smarter choices. This helps in building a solid investment strategy.
How PEG Ratios Change Over Time
PEG ratios change over time due to many factors. These include changes in earnings growth expectations and shifts in market sentiment. Economic conditions also play a role. To understand peg ratio, it's key to know it's the P/E ratio divided by earnings growth. A ratio of 1 is seen as a fair balance between value and growth.
Looking at historical PEG ratios helps us see how they change. This insight is vital for investors. For example, a PEG ratio below 1.0 means a stock might be undervalued. On the other hand, a ratio above 1.0 suggests it might be overvalued. This metric is useful for peg shares to assess their growth prospects.
Factors Driving Changes in PEG Ratios
Several factors influence PEG ratios:
- Changes in company performance
- Industry trends
- Macroeconomic conditions
These elements can greatly affect a PEG ratio. It's important to consider them when evaluating a stock's value. By understanding these changes and their causes, investors can make better choices.
| PEG Ratio | Interpretation |
|---|---|
| Below 1.0 | Undervalued |
| 1.0 | Fairly valued |
| Above 1.0 | Overvalued |
Real-World Applications of PEG Ratios
The PEG ratio is key for investors looking to make smart choices. It helps spot undervalued growth stocks and warns about overvalued ones.
Examples from Successful Companies
- Penske Automotive Group Inc. (PAG) - PEG Ratio: 0.85
- Toll Brothers Inc. (TOL) - PEG Ratio: 0.95
- Heritage-Crystal Clean Inc. (HCCI) - PEG Ratio: 0.90
- Hess Midstream LP (HESM) - PEG Ratio: 0.88
- Flex Ltd. (FLEX) - PEG Ratio: 0.92
These companies show good PEG ratios. This means they have strong growth and solid market performance.
Analyzing Underperformers with PEG Ratios
A high PEG ratio can mean a stock is overvalued. For example, a PEG ratio over 2 might lead to a market correction. This is because growth expectations are too high.
| Company | P/E Ratio | EPS Growth Rate (%) | PEG Ratio | Assessment |
|---|---|---|---|---|
| Example Corp | 25 | 10 | 2.5 | Overvalued |
| Sample Industries | 18 | 9 | 2.0 | Fairly Valued |
| Test Enterprises | 30 | 12 | 2.5 | Overvalued |
Looking at these ratios helps investors understand a company's value and growth. It's a way to make better investment decisions.
Tools and Resources for PEG Analysis
Investors can use online platforms and financial websites to apply the PEG ratio. These tools help calculate the PEG ratio for certain companies and compare it to industry standards. For peg finance, knowing the PEG ratio is key for smart investment choices.
Popular online financial platforms offer peg multiple data and analysis tools. They let investors check a company's growth chances. These sites have real-time data, customizable charts, and alerts to keep investors updated and informed.
Books and academic articles also provide deep dives into PEG ratios. They help investors understand the PEG ratio better and its uses. By using these resources, investors can improve their PEG ratio analysis and make better investment choices.
| Resource | Description |
|---|---|
| Online PEG Ratio Calculators | Provide real-time data and customizable charts for calculating PEG ratios |
| Financial Websites | Offer in-depth analysis and news on companies and industries, including PEG ratio data |
| Books and Academic Articles | Provide a detailed guide to understanding and using PEG ratios in investment strategies |
Expert Opinions on PEG Ratios
Experts have different views on the peg ratio. Some say a peg ratio under 1 means a stock is undervalued. Others warn against using just one number to judge a stock. Peter Lynch, a well-known fund manager, believes a peg ratio under 1 can signal a stock might do well in the future.
What's considered a good peg ratio changes based on the industry. For instance, the S&P 500 has a peg ratio of 1.56, while communications services are at 1.12. Generally, a peg ratio of 1 is seen as fair. But, for companies growing fast, a higher ratio might be okay.
Here are some key points to consider when evaluating peg ratios:
- A peg ratio of 1 is often seen as fair, with less than 1 being undervalued and more than 1 being overvalued.
- The FVPEG simulation shows high-earning growth companies can have values above 1, indicating fair value for their growth.
- The interest rate level greatly affects the FVPEG; a 2-point change in the risk-free rate from 2% to 4% can lower the average FPEG by 30%.
In conclusion, experts agree that peg ratios are just one part of the puzzle when valuing a company. Knowing how to use peg ratios in different industries helps investors make better choices. It shows the value of looking at many factors when analyzing investments.
| Company | PEG Ratio |
|---|---|
| Meta Platforms (NASDAQ:FB) | 1.74 |
| Alphabet (Google) | 2.09 |
| S&P 500 | 1.56 |
Future Trends in PEG Ratio Analysis
As financial markets grow, the PEG ratio analysis will get more advanced. New data analytics and artificial intelligence will improve PEG ratio accuracy. Investors will get better insights into a company's growth and market position.
Intangible assets like intellectual property and brand value will also play a bigger role. This could change how we value companies. Analysts will need to find new ways to include these assets in their strategies.
The PEG ratio's role in investing will change too. Investors will use it with other metrics and tools. Understanding the PEG ratio's strengths and weaknesses will help investors make better choices.
FAQ
What is the PEG ratio and why is it important?
The PEG ratio is a financial tool that looks at a company's price and growth. It combines the price-to-earnings (P/E) ratio with expected earnings growth. This helps find stocks that are cheap but have good growth chances.
How is the PEG ratio calculated?
To find the PEG ratio, you divide the P/E ratio by the expected earnings growth rate. This growth rate is usually for the next 1-5 years. The formula is: PEG ratio = P/E ratio / Earnings growth rate.
What constitutes a "good" PEG ratio?
A PEG ratio under 1 is good, meaning the stock might be cheap. A ratio between 1 and 2 is okay. But a ratio over 2 might mean the stock is too expensive compared to its growth.
How do PEG ratios vary across different industries?
PEG ratios change a lot by industry. Tech companies often have higher ratios because they grow fast. Compare a stock's PEG ratio to its industry to see if it's fairly priced.
What are the limitations of the PEG ratio?
The PEG ratio has some downsides. It relies on accurate earnings forecasts and can be affected by the growth time frame. It's best used with other metrics for a full picture.
How can investors incorporate the PEG ratio into their investment strategies?
Smart investors use the PEG ratio with other tools like P/E ratio and cash flow analysis. This helps find cheap growth stocks. Professional investors use it to make smart choices.
What are some emerging trends and future developments in PEG ratio analysis?
The PEG ratio's role might change as markets evolve. Intangible assets and tech disruption could play bigger parts. Better analytics and AI could also improve PEG ratio use in the future.