Comprehensive Companies Fundamentals Analysis for Professionals
Fundamental analysis is key for checking a company's financial health and investment worth. It looks at financial statements and economic signs to find a stock's true value. Important factors like revenue growth, profit, and competitive edge are key in this analysis.
By studying financial reports, ratios, and trends, investors can see past price changes. They focus on what really matters for a company's future. This method helps investors figure out a company's worth, its financial health, and make smart choices about stocks.
Key Takeaways
- Fundamental analysis involves examining a company's financial statements and broader economic indicators to uncover a security's intrinsic value.
- Companies fundamentals, such as revenue growth and profitability, are essential aspects to consider when conducting fundamental analysis.
- Fundamental analysis helps investors identify undervalued companies with growth and avoid risky investments.
- Key ratios, such as the price-to-earnings (P/E) ratio and debt-to-equity (D/E) ratio, are used to determine a company's financial health.
- Fundamental analysis is a data-driven approach that enables investors to make informed decisions about buying, holding, or selling stocks.
- Financial databases and industry publications provide valuable tools and resources for conducting fundamental analysis of stocks.
- Companies fundamentals analysis is critical for evaluating stocks and can also be applied to other securities, such as bonds or derivatives.
Understanding Companies Fundamentals
Companies' fundamentals are the base of fundamental investing. It's about looking at a company's financials, management, industry, and competition. This helps investors see a company's true value. It's a way to pick stocks that might grow a lot over time.
Looking at a company's financial statements is key. These include the balance sheet, income statement, and cash flow statement. They show a company's income, expenses, assets, debts, and cash flow. By studying these, investors can spot trends and make better choices.
Important metrics in fundamental analysis are earnings per share (EPS), price-to-earnings (P/E) ratio, and dividend yield. These numbers show a company's profit, growth, and investment return. For instance, a high EPS and low P/E ratio might mean a stock is cheap and worth buying.
| Metric | Description |
|---|---|
| Earnings Per Share (EPS) | A company's net income divided by the number of outstanding shares |
| Price-to-Earnings (P/E) Ratio | A company's stock price divided by its EPS |
| Dividend Yield | A company's annual dividend payout divided by its stock price |
Understanding a company's basics and these key numbers helps investors make smart choices. Fundamental investing is about patience and knowing your investments well. It's a strategy for long-term success.
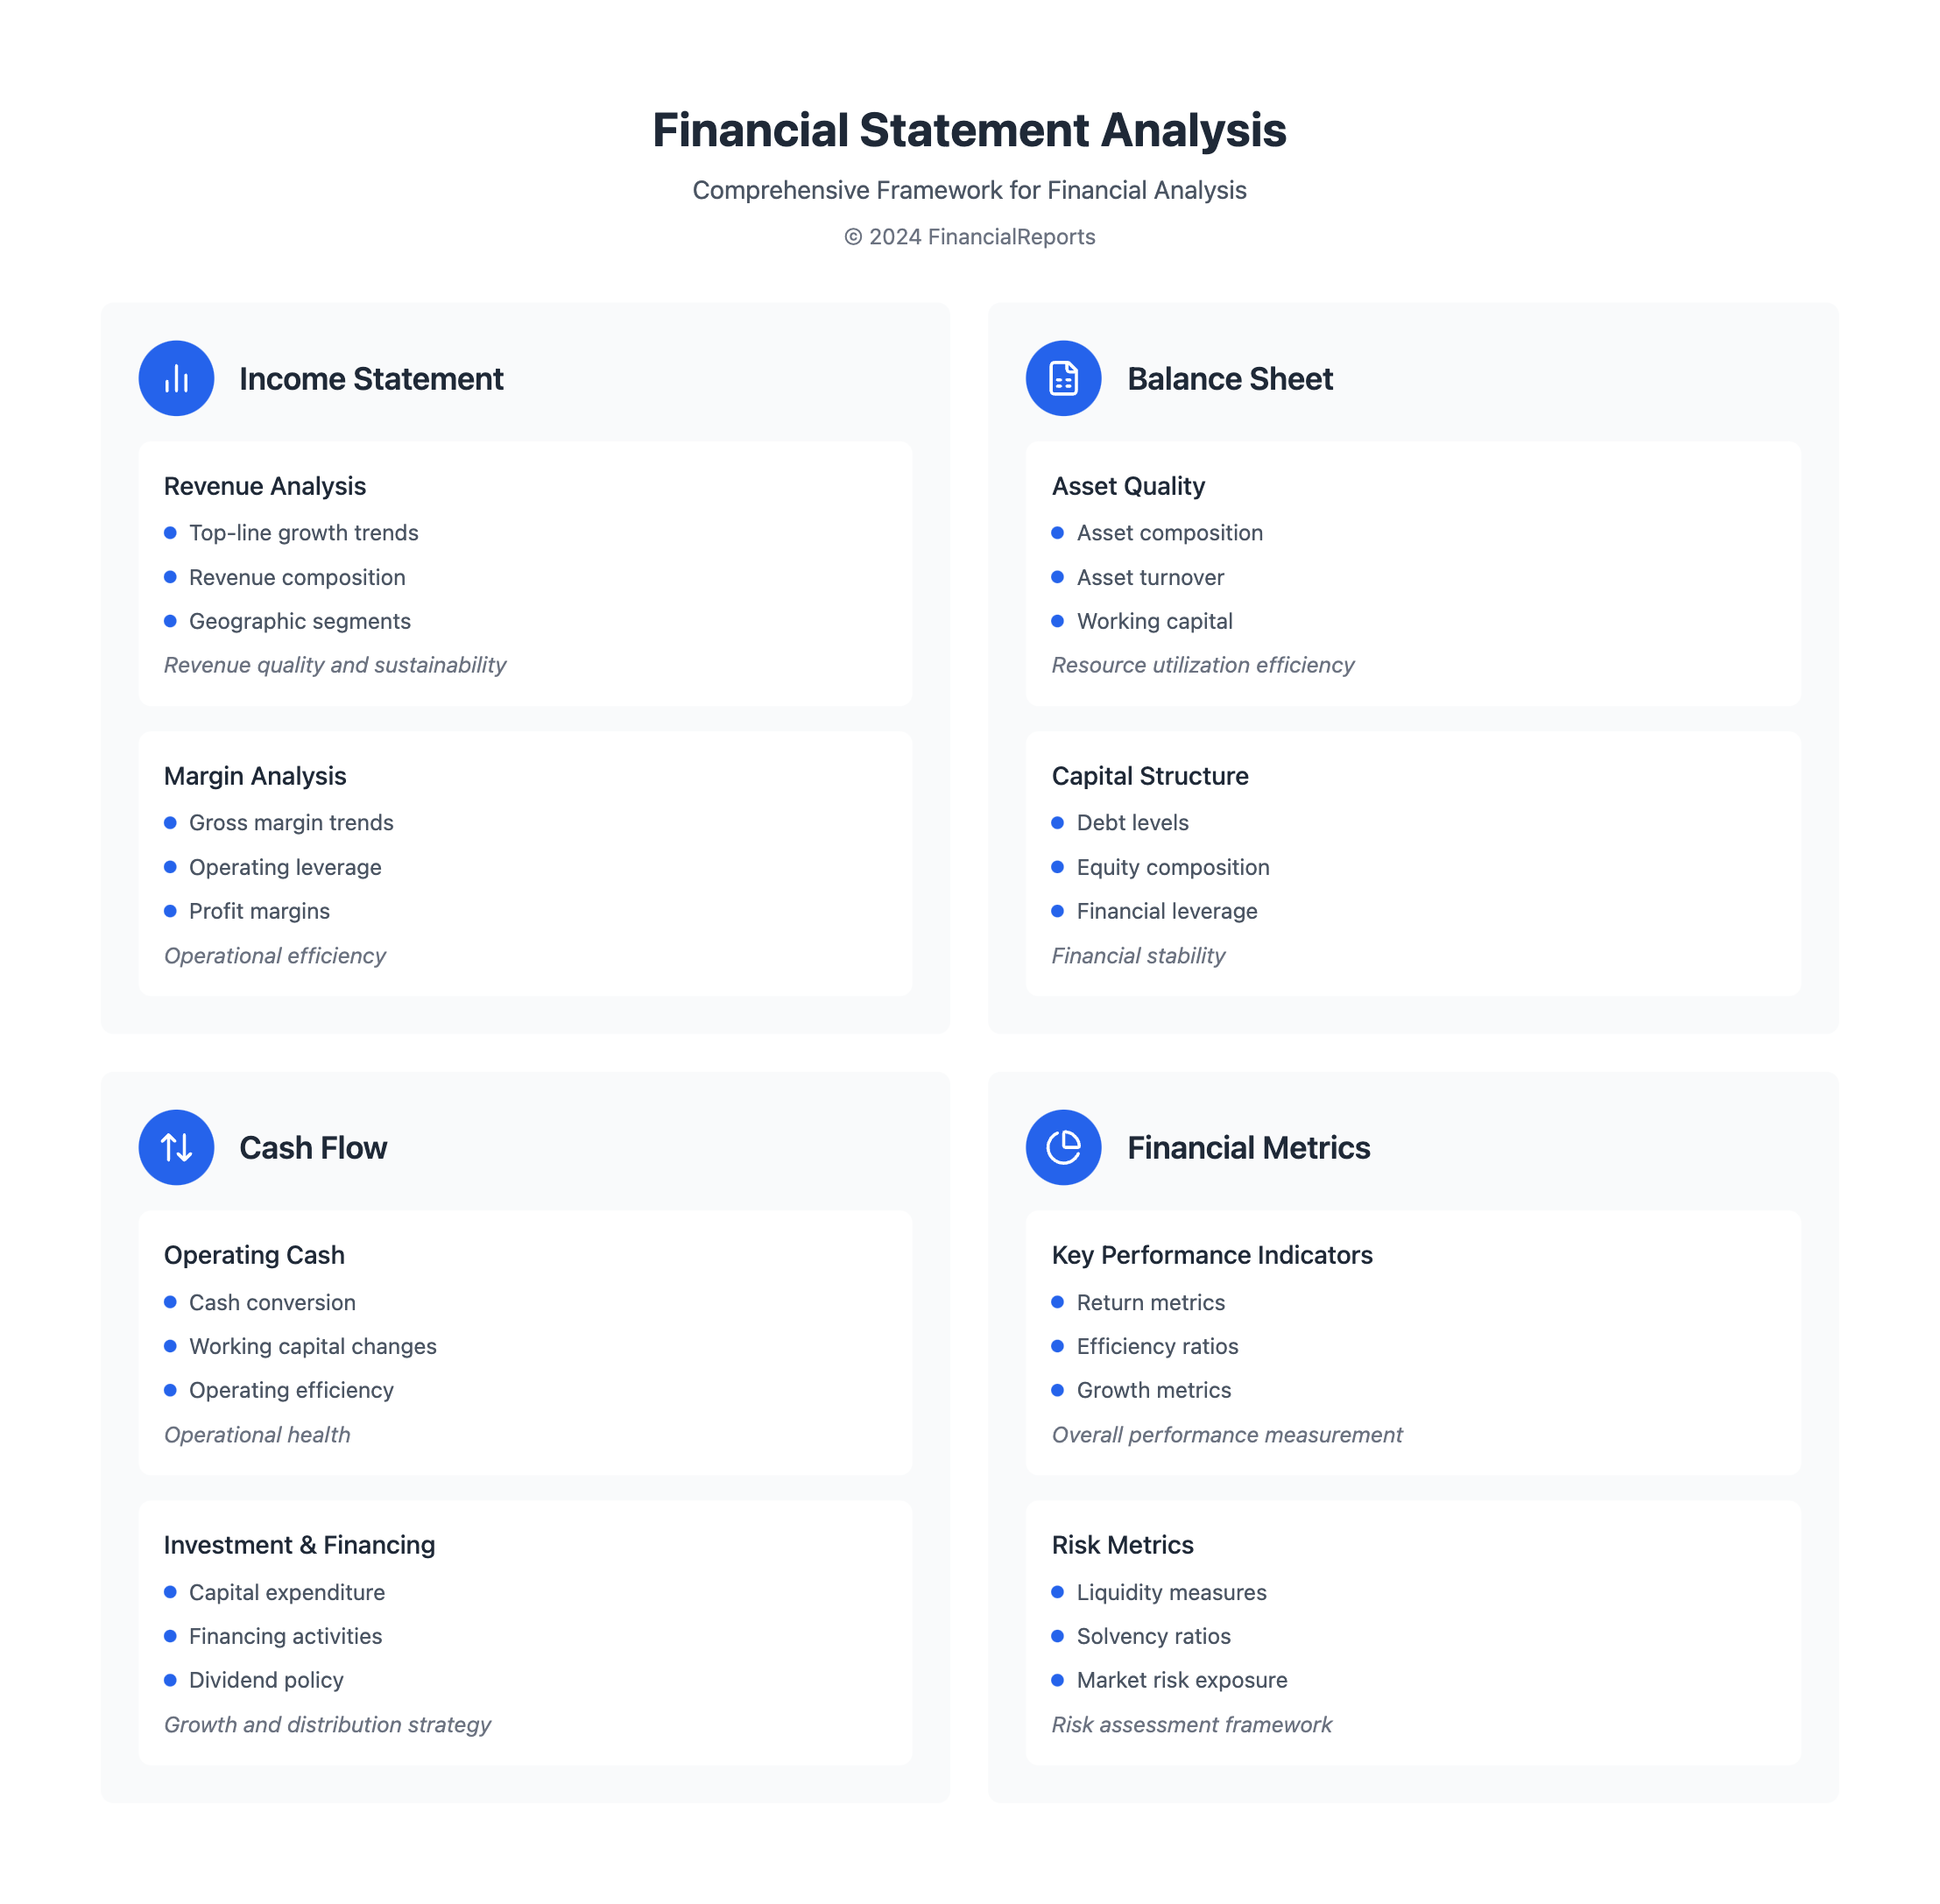
Analyzing Financial Statements
Financial statements are key in equity fundamental analysis. They show a company's financial health and performance. Experts say analyzing these statements involves looking at historical trends and future expectations. This helps investors and financial experts see a company's strengths, weaknesses, and growth possibilities.
Looking closely at financial statements means checking the income statement, balance sheet, and cash flow statement. The income statement shows revenue against expenses to find profit or loss. The balance sheet lists assets, liabilities, and shareholder equity. The cash flow statement gives details on cash flows from different activities.
Key Components of Financial Statement Analysis
- Horizontal, vertical, and ratio analysis are common techniques used in financial statement analysis.
- Analysts use ratios like asset turnover, operating profit margin, and return on equity for financial analysis.
- Free cash flow statements help determine a company's value.
By using these methods and looking at financial statements over time, investors and financial experts get a full picture of a company's financial health. Equity fundamental analysis is a vital tool for assessing a company's growth and value.
| Financial Statement | Key Components |
|---|---|
| Income Statement | Revenue, Expenses, Profit/Loss |
| Balance Sheet | Assets, Liabilities, Shareholder Equity |
| Cash Flow Statement | Cash Flows from Operating, Investing, and Financing Activities |
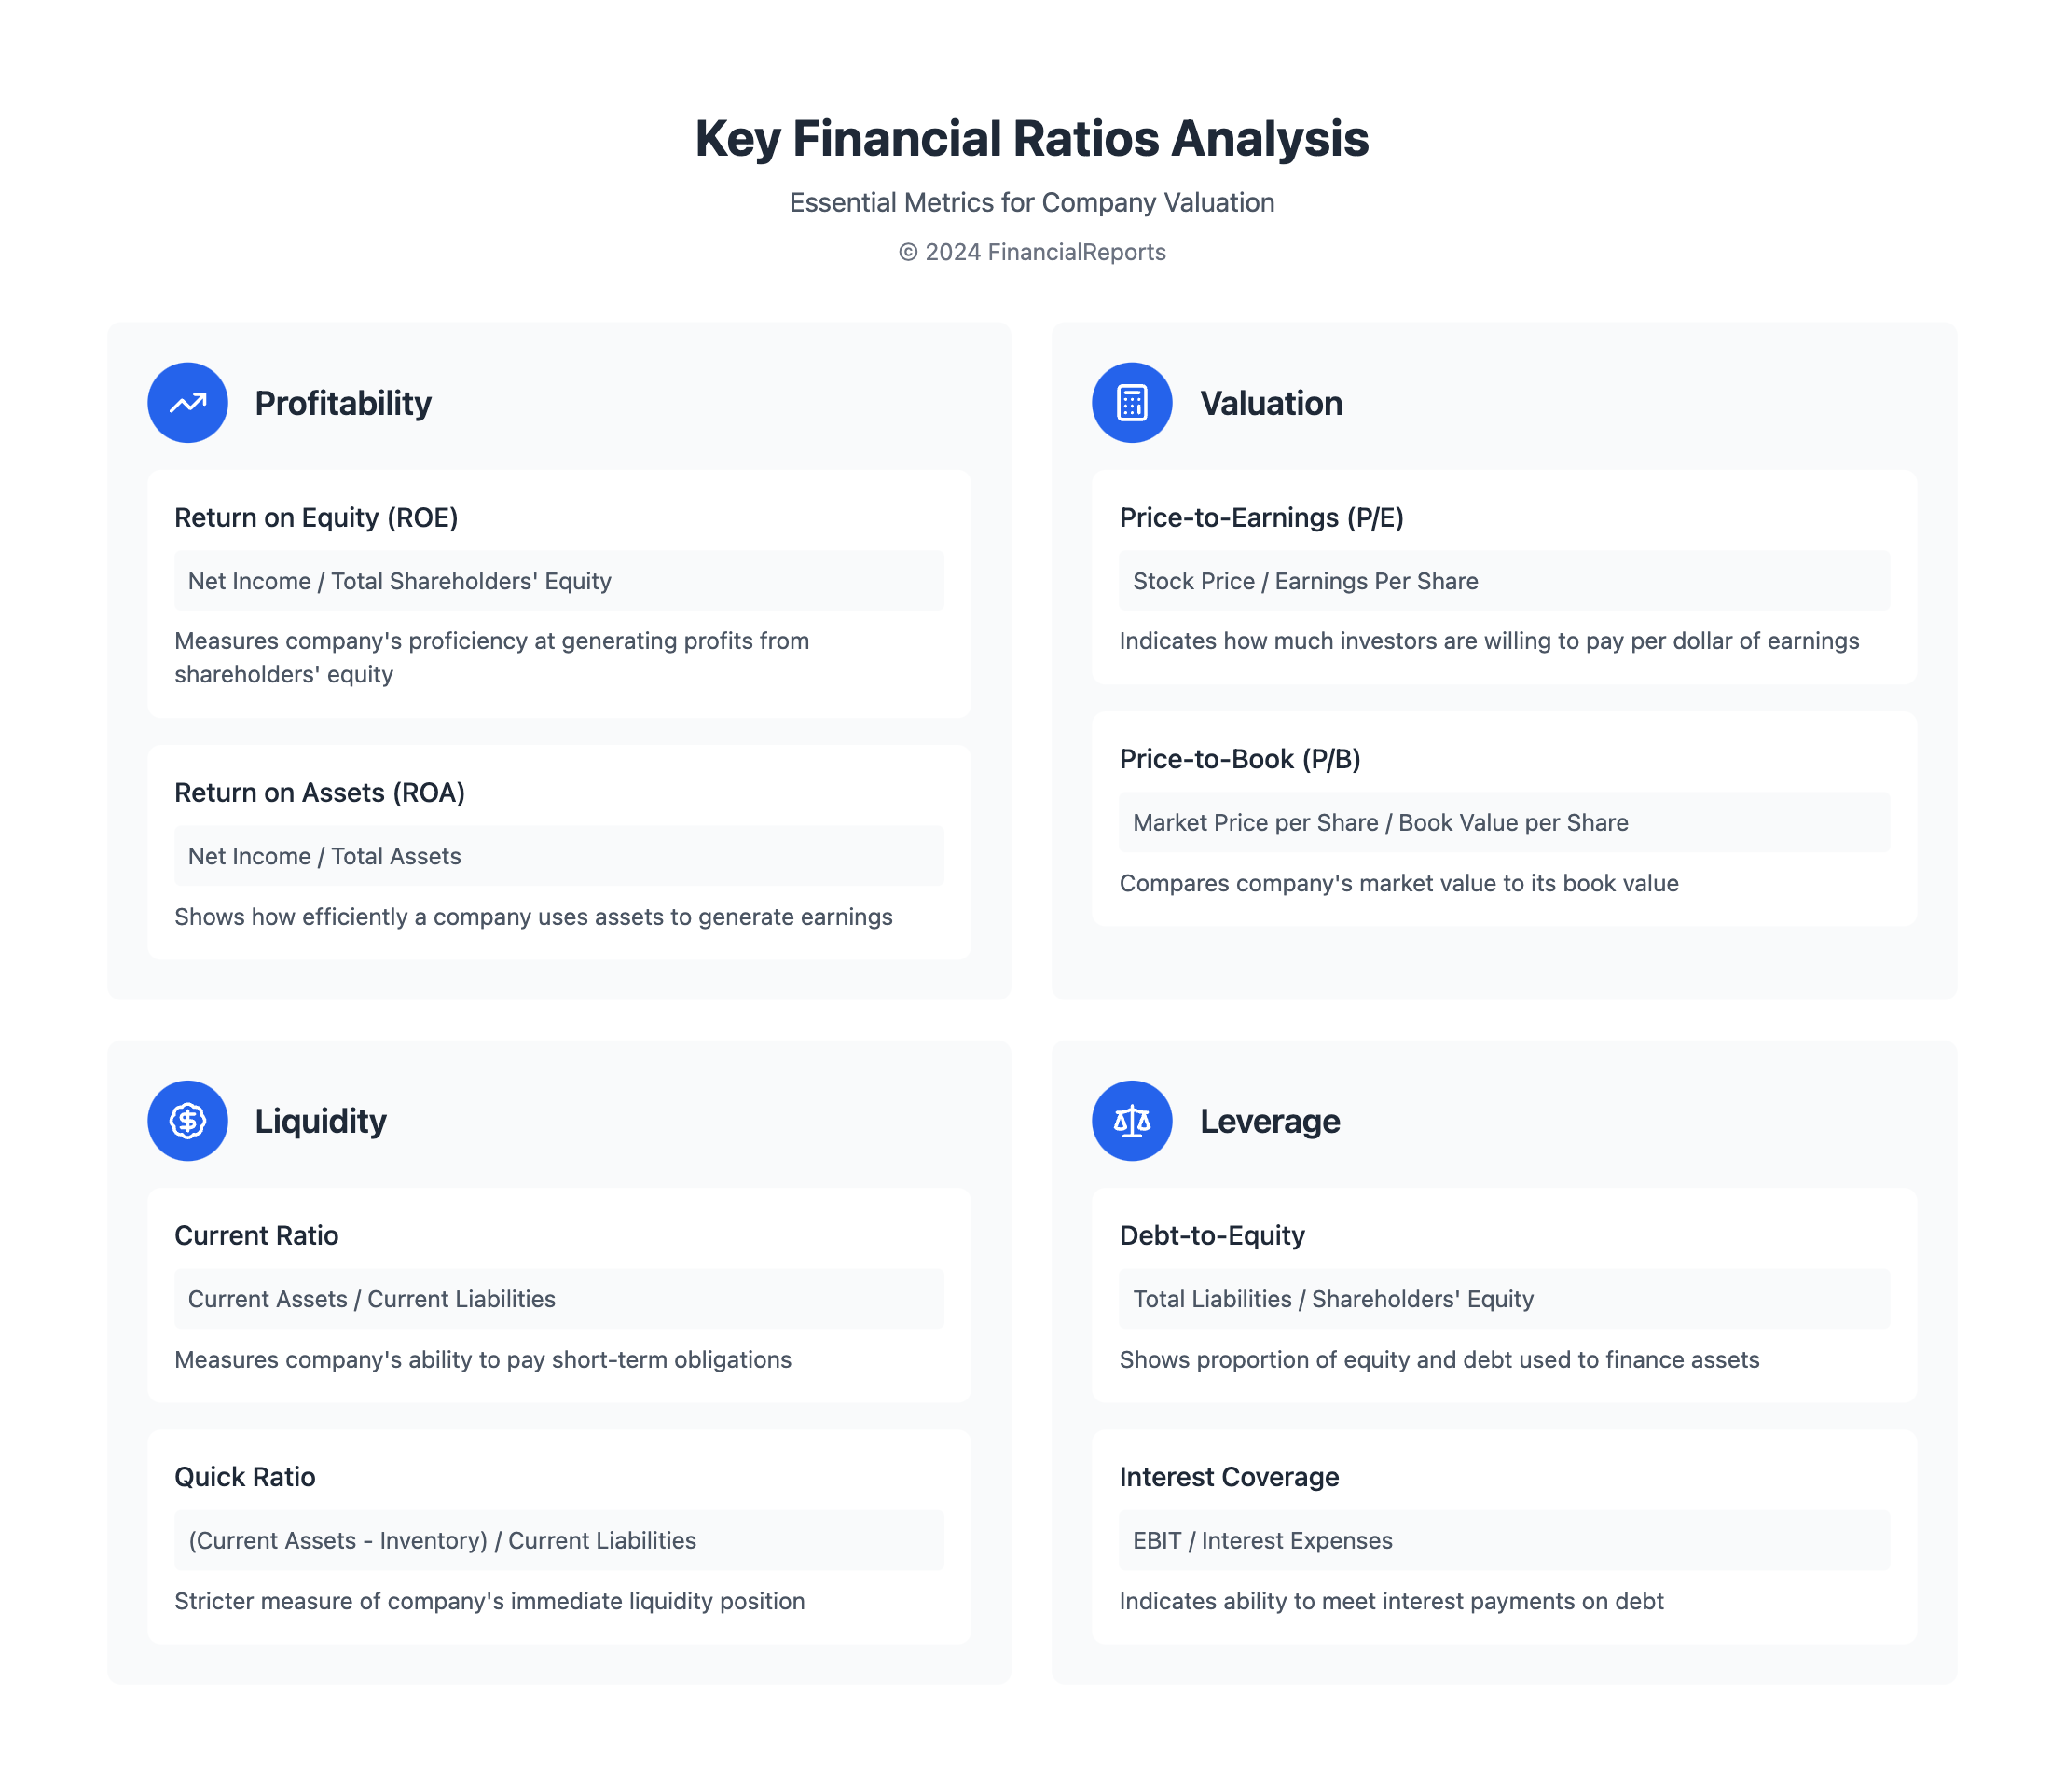
Key Financial Ratios
When we analyze stocks, looking at key financial ratios is key. These ratios show how well a company is doing financially. They help investors make smart choices. Ratios like profitability, liquidity, leverage, and efficiency are important.
There are many ways to check a company's financial health. For example, the price-to-earnings (P/E) ratio shows how much investors are paying for each share. The debt-to-equity (D/E) ratio shows how much debt a company has compared to its equity. These ratios are vital for understanding a company's health and making good investment choices.
Profitability Ratios Explained
Profitability ratios like return on equity (ROE) and return on assets (ROA) are key. They show how well a company makes money. ROE is net income divided by total shareholders' equity. ROA is net income divided by total assets. These ratios are essential for evaluating a company's financial health.
- Return on Equity (ROE): Net Income / Total Shareholders' Equity
- Return on Assets (ROA): Net Income / Total Assets
By looking at these ratios, investors can understand a company's financial health better. This is a big part of making smart investment choices. It's all about understanding the stock fundamentals.
Valuation Methods
Valuation methods are key in figuring out a company's true worth. They help investors understand a company's financial health and growth prospects. We'll look at three main methods: Discounted Cash Flow (DCF) analysis, Price-to-Earnings (P/E) ratio, and asset-based valuation.
Discounted Cash Flow (DCF) Analysis
The DCF method calculates a company's value by looking at its future cash flows. It considers the time value of money, giving a clearer picture of a company's worth. For example, Microsoft's market value is about $3 trillion, with 7.43 billion shares.
Price-to-Earnings (P/E) Ratio Comparison
The P/E ratio compares a company's stock price to its earnings per share. It helps investors see how a company stacks up against its peers. For instance, tech companies might be valued at 3x revenue, while service firms could be valued at 0.5x revenue.
| Valuation Method | Description |
|---|---|
| Discounted Cash Flow (DCF) Analysis | Estimates a company's value by discounting its future cash flows |
| Price-to-Earnings (P/E) Ratio Comparison | Compares a company's stock price to its earnings per share |
| Asset-Based Valuation Approaches | Values a company based on its assets, such as book value or liquidation value |
These methods help investors understand a company's true value. By using them, investors can make better choices about where to put their money.
Evaluating Competitive Position
When we do a fundamental analysis of stocks, checking a company's competitive position is key. We look at its market share, industry trends, and SWOT analysis. This helps us see how well it can compete in the market.
A good equity fundamental analysis needs to check the company's strengths, weaknesses, opportunities, and threats. This helps us understand its competitive edge.
Important parts of competitive position analysis are:
- Market share and industry analysis
- SWOT analysis to identify strengths and weaknesses
- Benchmarking against peers to determine competitive advantages
By doing a deep competitive position analysis, investors get important insights. They learn about a company's ability to compete in the market. This helps them make better investment choices. This analysis is a big part of understanding a company's equity fundamental analysis and its place in the industry.
Assessing Management Effectiveness
When looking at a company's growth and success, checking the management team is key. We look at leadership, governance, performance, and culture. These insights help us see if a company can reach its goals.
Management's ability to grow and improve is important. We use fundamental indicators stocks like revenue and profitability. Also, stock fundamentals show a company's financial health.
Some important metrics for management include:
- Customer satisfaction levels
- Employee engagement and retention
- Innovation and product development
- Financial performance and growth
By looking at these metrics, we can spot a company's strong and weak points. This helps us make smart investment choices.
| Metric | Description |
|---|---|
| Customer Satisfaction | Measures the level of customer satisfaction with a company's products or services |
| Employee Engagement | Evaluates the level of employee engagement and motivation within a company |
| Innovation | Assesses a company's ability to develop new and innovative products or services |
| Financial Performance | Examines a company's financial health and stability, including revenue growth and profitability |
Role of Economic Indicators
Economic indicators are key in fundamental investing. They give insights into a company's performance in the economy. These indicators are divided into leading, coincident, and lagging types. Leading indicators, like the yield curve and consumer durables, forecast future economic trends.
Coincident indicators, such as GDP and employment levels, show what's happening now in the economy. Lagging indicators, like GNP and unemployment rates, reveal data after economic events have passed. Knowing these indicators is vital for investors and financial experts. It helps them spot trends and make smart choices.
The table below shows some common economic indicators and what they mean.
| Indicator | Type | Description |
|---|---|---|
| Yield Curve | Leading | Predicts future economic movements |
| GDP | Coincident | Provides real-time information on current economic activities |
| Unemployment Rate | Lagging | Shows data after specific economic activities have occurred |
By studying these economic indicators, investors can better understand a company's strengths. This knowledge aids in making informed choices in fundamental investing. It helps investors stay ahead in the market and find growth opportunities.
Trends in Companies Fundamentals
Understanding fundamental analysis of stocks is key. It involves looking at technology, sustainable practices, and data analytics. This helps see how well a company can handle market changes. Equity fundamental analysis is vital for making smart investment choices.
Today, companies focus on technology, sustainability, and data to grow. These trends will keep shaping the market. Companies that adapt and innovate will thrive.
Technology's Impact on Financial Analysis
Technology is changing fundamental analysis of stocks a lot. It lets investors quickly analyze big data. Tools like machine learning and natural language processing help spot trends in financial statements.
Sustainable Practices and Financial Health
Sustainable practices are now critical for companies. They matter to investors and customers who care about the environment and society. Companies that go green are better at managing risks and finding opportunities.
Tools and Resources for Professionals
Mastering stock analysis needs the right tools and resources. Financial pros use software for deep financial modeling and data analysis. Tools like Excel, Bloomberg Terminal, and fintech platforms help break down financial statements and predict future performance.
Online databases and research tools also provide a wealth of company info. Sites like Morningstar, Yahoo Finance, and SEC.gov offer historical data, analyst reports, and industry insights. Staying updated with trends and best practices is vital. This is where continuing education comes in.
By using the right tools, financial experts can better understand company fundamentals. They can spot opportunities and make smart investment choices. Being skilled in these areas is essential for success in today's markets.
FAQ
What is the importance of fundamental analysis in evaluating companies' financial health and investment?
Fundamental analysis is key to understanding a company's financial health and investment worth. It digs deep into financial statements, ratios, and trends. These factors greatly affect a company's performance and value.
What are the key components of a company's fundamentals?
A company's fundamentals include its financial statements and ratios. Also, industry trends, competitive position, and management effectiveness are important. Economic indicators play a role too.
How do a company's fundamentals influence investment decisions?
A company's fundamentals greatly affect investment choices. They help spot undervalued companies and predict their growth. This information guides investors in making decisions that fit their goals and risk levels.
What are the key financial statements, and how are they used in fundamental analysis?
The income statement, balance sheet, and cash flow statement are key. They show a company's profitability, liquidity, and stability. These insights are vital for assessing a company's financial health.
What are the most important financial ratios in fundamental analysis, and how are they interpreted?
Important ratios include profitability, liquidity, leverage, and efficiency ratios. They reveal a company's financial performance, risk, and efficiency. This information is critical for evaluating a company's health.
What are the common valuation methods used in fundamental analysis, and how do they help assess a company's intrinsic value?
Valuation methods include discounted cash flow, price-to-earnings ratio, and asset-based approaches. These methods help find a company's true value. This value is then compared to its market price to spot undervaluation or overvaluation.
How can an analysis of a company's competitive position and management effectiveness contribute to fundamental analysis?
Analyzing a company's competitive position and management effectiveness is vital. It shows its strengths and weaknesses. It also reveals its ability to execute its strategy and create value for shareholders.
What role do economic indicators play in fundamental analysis, and how can they impact a company's performance?
Economic indicators like macroeconomic factors, interest rates, and inflation are critical. They affect a company's financials, operations, and growth. Understanding these indicators is essential for making smart investment choices.
What are some emerging trends in companies' fundamentals that professionals should be aware of?
Trends include technology's impact, the importance of sustainable practices, and data analytics in finance. Knowing these trends helps analysts understand a company's financial performance and competitive edge.
What tools and resources are available for professionals to conduct fundamental analysis?
Professionals have many tools and resources for analysis. These include financial software, online databases, and education programs. These help gather and analyze data for informed investment decisions.