How to Calculate Stock Price | Investment Guide
For any investor, knowing how to find stock price is key. Learning to calculate stock value involves many factors that define a stock's true worth. A stock's trading price is just a glimpse of its value. However, not all investors grasp the complicated details behind these numbers.
Exploring the current stock price formula reveals complex elements. These range from company finances to market feelings. To assess a stock, one must do more than guess. It requires deep analysis to understand a company's earnings future, its growth outlook, and how it compares with the market's direction.
Key Takeaways
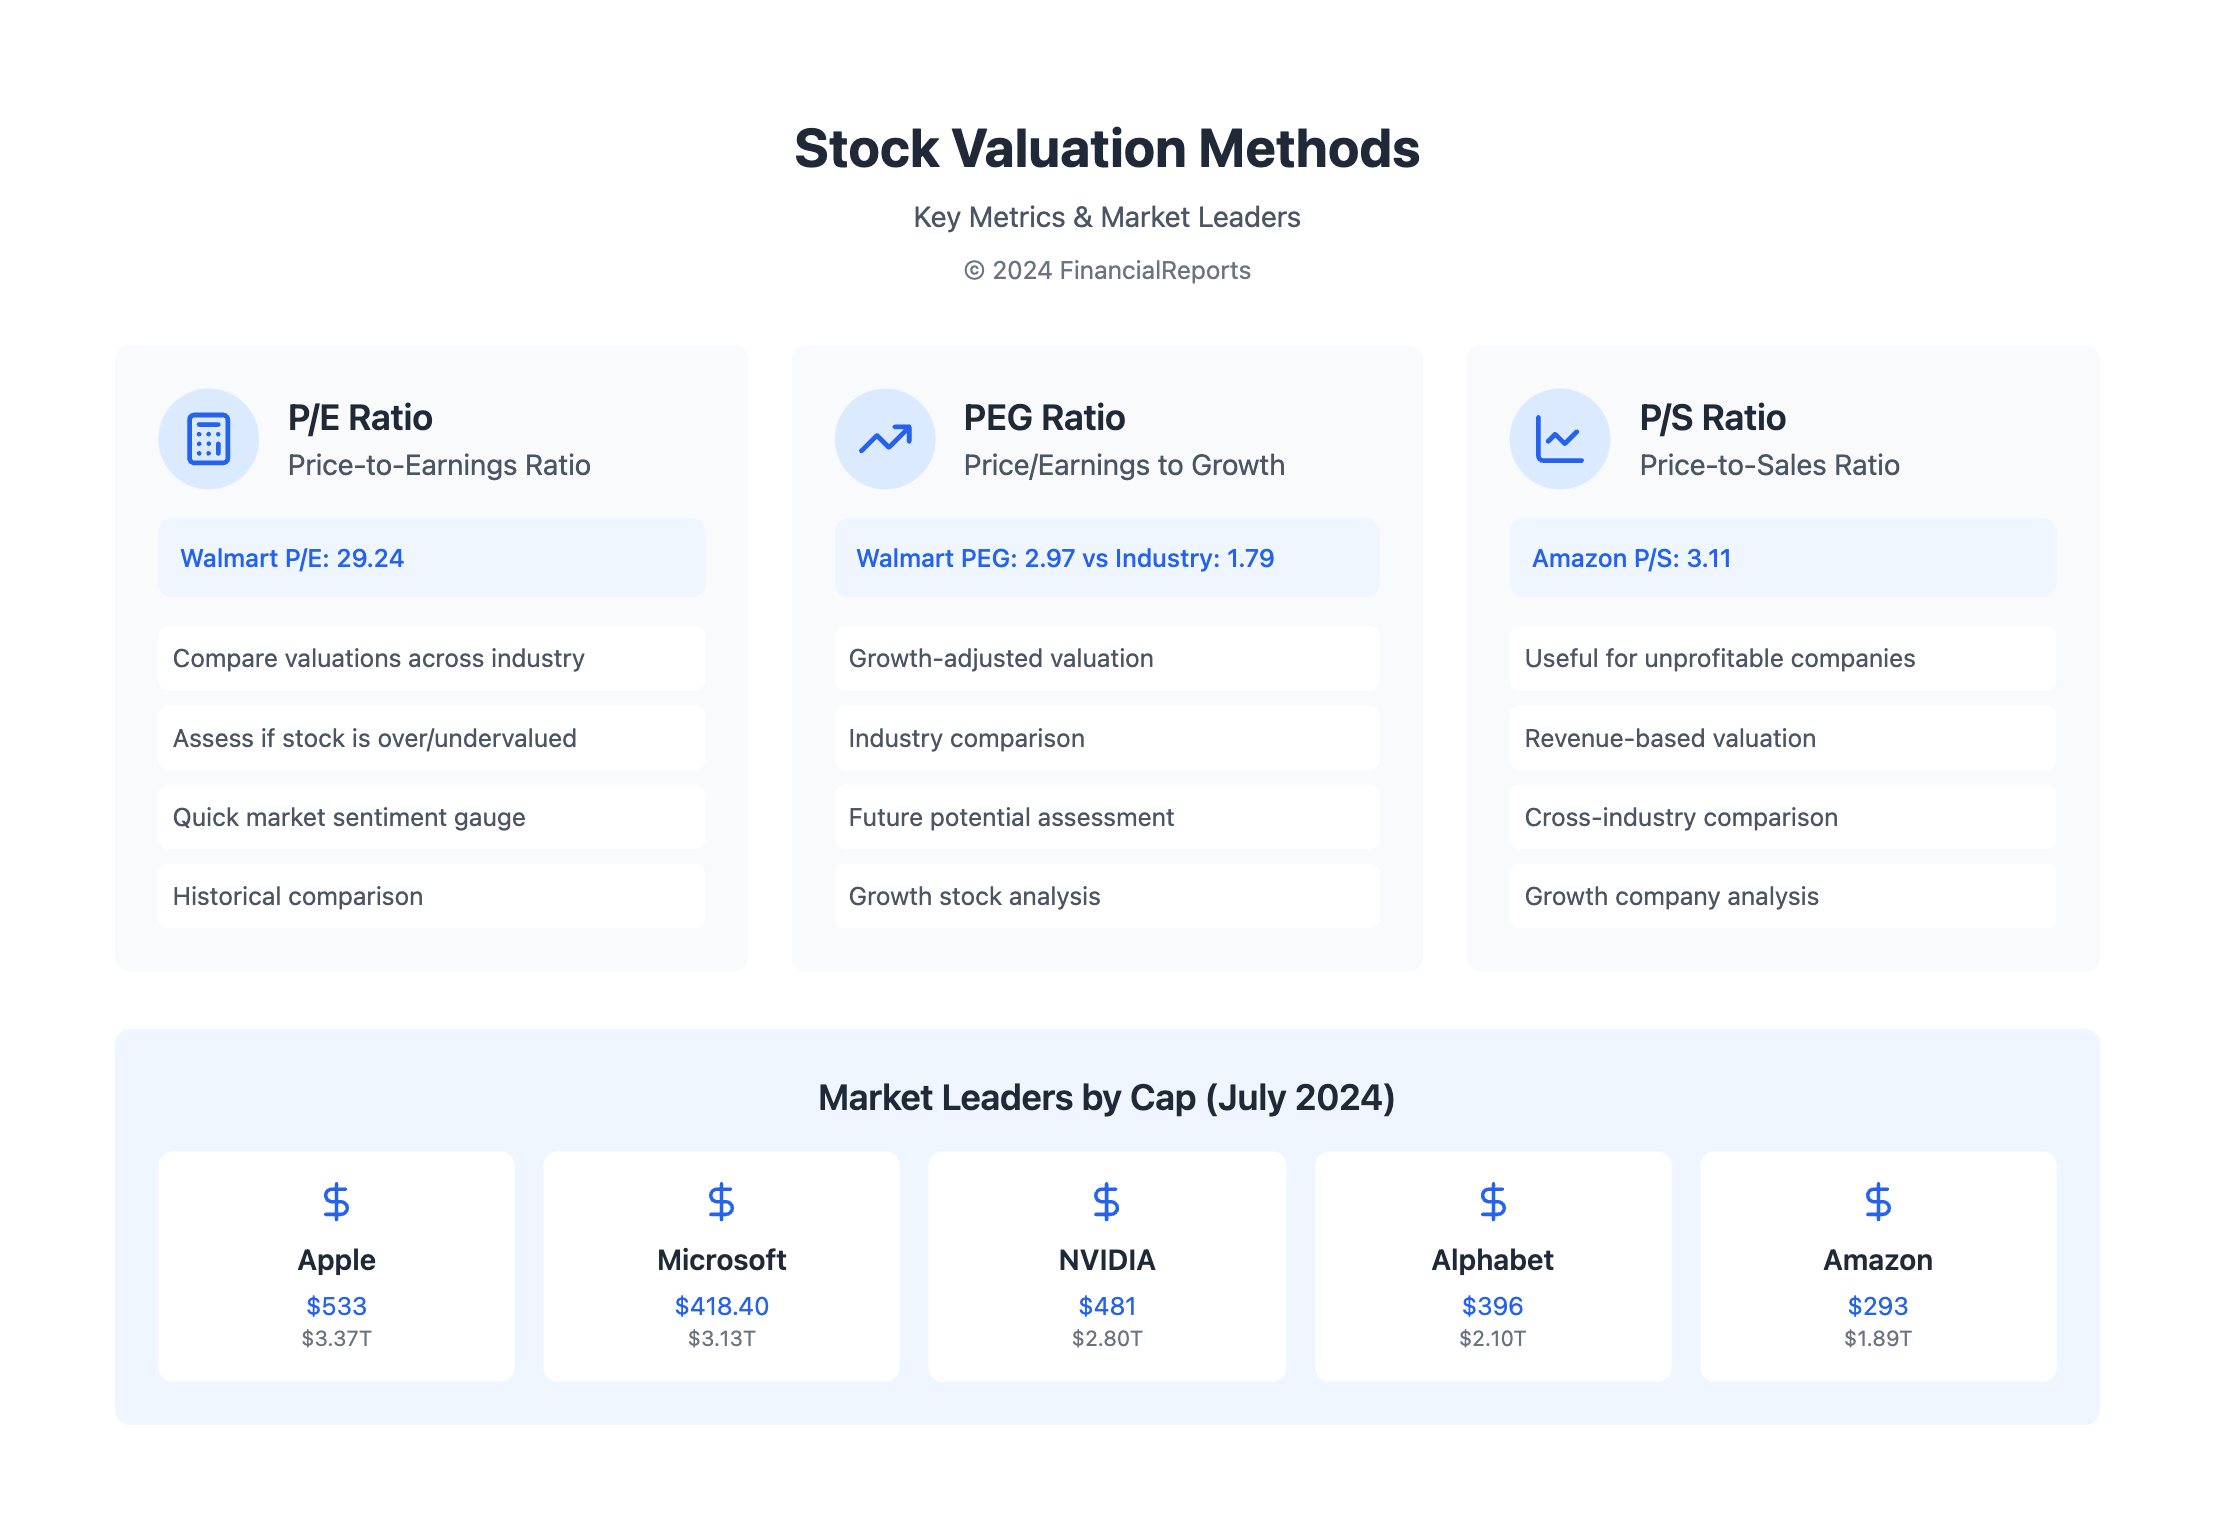
- Price-to-Earnings (P/E) Ratio: For instance, retail giant Walmart showed a P/E ratio of 29.24.
- Price-to-Earnings Growth (PEG) Ratio: Walmart's PEG ratio was 2.97, indicating a value higher than the supermarket industry average of 1.79.
- Price/Sales (P/S) Ratio: E-commerce leader Amazon had a P/S ratio of 3.11 in August 2024. This shows its valuation despite erratic earnings growth.
- Market Analysis: Using ratios like P/B and total dividend yields helps in finding undervalued opportunities across sectors.
- Valuation Nuances: It's wise to think about less obvious factors like economic moat, network effects, and cost benefits along with usual metrics.
- Intrinsic Value: Techniques like the Dividend Discount Model (DDM) let us peek into a stock's core value, taking into account expected dividends and equity costs.
- Investor Awareness: Being aware of methods such as FCFE in Discounted Cash Flow (DCF) models sharpens investors' sense for the real value of stocks.
What is Stock Price?
Understanding what is a stock and its price is key for investors. The stock price shows how much company shares cost on the market. It tells us what the market thinks about a company's value and future.
Definition and Importance
Stock price is linked to a company's market capitalization, or market cap. This is calculated by multiplying the stock price by the number of shares. For example, Microsoft has a stock price of $418.40 and 7.43 billion shares, leading to a $3.1 trillion market cap.
This market cap helps investors understand a company's size and the value of its shares. It shows how big or small a company is compared to others. Market cap also highlights stock liquidity, important for big investors.
How Stock Price Affects Investment Decisions
Learning how to calculate stock price means looking beyond the numbers. It's about finding the real value of a company, which can differ from its market price. Factors like P/E ratios and growth models are crucial here.
Analyzing a company like Home Depot, with its P/E ratio, helps investors. They can see if the stock price is a good deal. It's also about checking if a high price matches the company's earnings and growth.
Here’s a snapshot of the leading companies by market cap as of July 25, 2024:
| Company | Stock Price | Market Cap (Trillions) |
|---|---|---|
| Apple | $533 | $3.37 |
| Microsoft | $418.40 | $3.13 |
| NVIDIA | $481 | $2.80 |
| Alphabet | $396 | $2.10 |
| Amazon | $293 | $1.89 |
This table shows how big these tech companies are. It signals strong investor confidence and their big market impact.
In the end, understanding stock price is vital for smart investing. It helps investors see not just today's value but future growth too. This way, they make informed decisions on buying or selling shares.
Factors Influencing Stock Price
Knowing what makes stock prices move is key for those who invest professionally. We'll look at what drives market values and their role in assessing stocks.
Company Performance and Earnings Reports
How a company does, shown in earnings reports, is critical for stock evaluation. These reports reveal a company's financial state through metrics like earnings per share (EPS). A strong EPS growth boosts investor trust, raising stock prices. On the flip side, poor earnings might lower them.
Market Conditions and Economic Indicators
Stock prices are also affected by the broader economy. Factors like interest rates, set by bodies such as the Reserve Bank of India, play a role. GDP growth and job numbers show how the economy is doing, impacting how people feel about investing. Even strong companies can see stock price drops in tough economic times due to negative investor mood.
Investor Sentiment
The way people feel about the market significantly impacts stock prices. Good news or strong market conditions can push prices up. But fear or bad news can cause them to fall, no matter the company's real situation. This shows how stock prices reflect both concrete data and human emotions.
For those in the field, it's important to see how company performance, market trends, and emotions connect. A deep understanding of these factors helps in making smart investment choices. Balancing hard data with human insights gives a more complete view for investing in stocks.

Methods for Calculating Stock Price
Learning about stock price calculation formula is key for investors. It helps understand the real value of their investments. We'll look at three main methods: the Price-to-Earnings (P/E) Ratio, Discounted Cash Flow (DCF) Analysis, and the Dividend Discount Model (DDM). Each offers insight into how to calculate stock price effectively.
Price-to-Earnings (P/E) Ratio
The P/E Ratio measures the relationship between a company's stock price and its earnings. It shows what investors are ready to pay for each dollar of earnings. For example, Flying Pigs Corporation has a P/E ratio of 18. This is found by dividing its stock price of $67 by earnings per share of $4.19. This tells us investors will pay $18 for every earnings dollar, showing market value and sentiment.
Discounted Cash Flow (DCF) Analysis
DCF Analysis estimates a stock’s value by looking at expected cash flows in the future. It evaluates these cash flows' present value using a discount rate. This gives a reliable stock value estimate. For example, with future cash projection and an 8% discount rate, Flying Pigs' intrinsic value might differ from its market price. This difference points to possible over or undervaluation.
Dividend Discount Model (DDM)
DDM finds a stock’s value using forecasted dividends and their growth rate. For Flying Pigs Corporation, seeing an annual dividend of $2.68 per share and a growth of 7% makes the value equal to the $67 stock price. This method suits investors looking for steady dividend returns.
How to Use Earnings Reports for Stock Valuation
Earnings reports are key for anyone wanting to gauge a stock's worth. They offer insights into a company's financial condition. This includes data on revenue, earnings per share (EPS), and future earnings outlook. These elements are vital for using the stock value formula right. We'll look at important metrics for correct stock valuation. We'll also see why knowing future earnings projections is helpful for investors.
Key Metrics to Look For
Understanding a company's financial health starts with its earnings reports. The EPS is especially important as it shows how profitable a company is for each share. This figure is essential for figuring out if a stock's price is fair. It compares the stock to its past performance and similar companies. Focus on these essential metrics:
- Earnings Per Share (EPS): Critical for understanding company profits. It's found by dividing total earnings by the share count.
- Price-to-Earnings Ratio (P/E): This compares a stock's current price to its EPS. It helps gauge market expectations and stock affordability.
- Debt-to-Equity Ratio (D/E): This shows a company's financial leverage. It's key for assessing financial stability and risk.
Comparing these metrics among similar companies gives a clearer investment picture. It helps in making choices grounded in solid data.
Understanding Forward Guidance
Forward guidance is crucial information from company leaders during earnings calls. It includes future earnings estimates. This information is vital for predicting a company’s path. Knowing this helps use the stock value formula effectively. It shapes how investors see the company and influences the market.
| Financial Metric | Indicator | Purpose in Stock Evaluation |
|---|---|---|
| Earnings Per Share (EPS) | Profitability Measure | Directly influences P/E ratio, impacting stock price evaluation |
| Price-to-Earnings Ratio (P/E) | Value Indicator | Assesses if a stock is overvalued or undervalued relative to earnings |
| Debt-to-Equity Ratio (D/E) | Risk Assessment | Helps analyze financial health and stability of a company |
By analyzing earnings reports in detail, investors can fully grasp a company’s present and future. This approach combines EPS and future earnings insights. It's a powerful way to streamline stock valuation in your investment strategy.
The Role of Technical Analysis in Stock Pricing
Technical analysis is key in financial markets for figuring out share prices. It uses past market data, like price and volume, to guess future market moves. This method helps in deciding share values.
Basic Concepts of Technical Analysis
Technical analysis is based on some main ideas. It believes market prices show all known info, prices follow trends, and history often repeats. These ideas help analysts use old data to forecast future prices.
Common Indicators Used to Forecast Prices
Analysts have many tools to predict where prices will go. These tools include:
- Trendlines and channels show price directions.
- Moving averages make price data smoother to spot trends.
- Momentum indicators, like the Relative Strength Index (RSI), check how fast prices change to find extremes.
- Candlestick patterns, where specific shapes hint at market turns or continuations.
Using these tools together makes technical analysis strong. Tools like moving averages can hint at when to buy or sell. Studying candlestick patterns, like doji, gives clues on market feelings and possible price changes.
| Indicator | Description | Common Use |
|---|---|---|
| Moving Average (MA) | Averages price data to identify trends | Identify buy or sell signals through crossovers |
| Relative Strength Index (RSI) | Momentum oscillator that measures speed and change of price movements | Determine overbought or oversold conditions |
| Fibonacci Retracement | Uses Fibonacci numbers to identify potential support and resistance levels | Predict price corrections or reversals |
| Candlestick Patterns | Graphic representations of price movement depicted in patterns | Spot potential reversals or continuation of trends |
With solid technical analytics and the right use of tools, investors can make smarter decisions. This shows our firm's dedication to improving access to financial data and the use of expertise in investment solutions.
The Impact of Market Trends on Stock Price
It's key for investors to grasp how market trends can sway stock prices. Elements like bull and bear markets impact stock values deeply. Understanding these can help determine a stock's worth.
Bull and Bear Markets
Bull or bear markets hugely influence how investors feel and value stocks. In bull markets, optimism drives stock prices up. During bear markets, however, prices fall, spreading gloom among investors. Adapting investment strategies in these conditions is vital.
Sector Rotation and Its Effects
Sector rotation involves moving funds based on economic forecasts. It targets growth in burgeoning sectors while withdrawing from declining ones. This approach can affect stock prices in different industries. For example, shifting funds from tech to utilities before an economic downturn helps manage investment risks.
Understanding market dynamics is crucial in evaluating stocks. How can you judge a stock's value with market ups and downs? It's about assessing broad economic trends and diving into a company's core strengths. Techniques like fundamental analysis are tools in this process.
Using this knowledge can refine investment decisions. It helps investors in navigating the stock market's twists and turns. With a clear grasp of economic signals and sector trends, achieving financial objectives becomes more feasible.
Common Pitfalls in Stock Valuation
Finding the right stock price is filled with challenges. Various errors in valuation methods can impact investment choices greatly. It's key to understand the balance between stock valuation and market changes. This involves looking at common mistakes like using the stock value formula wrong and the effects of trading based on emotions.
Overvalued vs. Undervalued Stocks
Investors often struggle to tell if stocks are overvalued or undervalued. An overvalued stock has a high price-to-earnings (P/E) ratio compared to the industry average. This may seem attractive but can result in losses if the price corrects to a more realistic value. Meanwhile, undervalued stocks have low P/E ratios and may seem like good deals.
However, these could be risky if their low prices are due to real problems in the business, leading to "value traps." To find true bargains, it’s important to look at long-term profitability and growth, not just current prices.
Emotional Decision-Making in Trading
Another big problem in stock valuation is making choices based on emotions. Fear, greed, or other feelings can make investors buy high and sell low. This goes against smart investment practices. The ups and downs of the stock market can trigger emotional trading, which usually doesn't end well.
To avoid this, investors should stick to a clear strategy based on thorough financial analysis and market trends. Using both numbers and market insights helps keep a balanced perspective. This way, emotional mistakes can be minimized.
To sum up, avoiding valuation mistakes and emotional biases is crucial for good investing. This means studying financial ratios carefully and keeping emotions in check. The aim is to have a strong investment plan that can stand up to market challenges and valuation myths.
How to Build a Stock Investment Strategy
To create a strong stock investment strategy, you need to understand financial metrics and market behaviors. It's all about doing your homework and planning well, especially to calculate stock value right. It's important to mix things up in your investments and think about how long you'll hold onto them. This way, your investment can handle ups and downs in the market and unexpected economic changes.
Diversification Techniques
- Asset Allocation: Spreading your money across different types of investments like stocks, bonds, and real estate can protect you from big losses in one area.
- Geographical Diversification: Putting money in international markets lets you tap into growth in emerging markets, lowering the risk of losing out because of problems in one economy.
- Sector Diversification: Investing in different industries, such as technology, healthcare, and energy, helps prevent a slump in one sector from hurting your whole investment.
Long-Term vs. Short-Term Investments
It's key to know the difference between long-term and short-term investments when looking at how to evaluate a stock. Long-term investments are about growing your money steadily over time, aiming for reliable returns over years. On the other hand, short-term investments look for quick gains by taking advantage of brief market changes or trends. Your choice should match how much risk you're okay with and what your financial goals are.
Using a mix of diversification and understanding the difference between long and short-term investing helps you how to find stock price that meets your needs. With these strategies, you can tackle market challenges and reduce risks. This approach aims to build a strong and flexible investment portfolio.
Conclusion and Final Thoughts
Understanding how to calculate stock price is crucial for smart investing. This guide has covered key financial calculations like P/E ratios, DCF analysis, and dividend yield. These tools are vital for those looking to grow their investments. It's important to use these share valuation formulas while considering the market, your investment goals, and risks.
Recap of Key Calculation Methods
Valuing a stock is complex, touching on more than just the ups and downs. It involves looking at long-term price changes and dividends. This gives a full picture of what a stock is really worth.
It helps to compare the stock's performance to big market indexes. This way, you can see if it's doing better, worse, or just as expected.
Encouragement for Further Learning
If you are dedicated to excelling in the financial markets, you have to keep learning. It's not just about the numbers. You also need to understand the impact of outside factors. These include investor sentiment, new technologies, inflation, and government actions.
We suggest continuous education and using excellent resources to stay ahead. The world of investing is always changing. To navigate it well, you must get the hang of stock evaluation. This will help you handle the market's ups and downs with confidence.
FAQ
How is a stock's value calculated?
A stock's value can be found using several methods. Some include the Price-to-Earnings (P/E) Ratio, Discounted Cash Flow (DCF) Analysis, and the Dividend Discount Model (DDM). Each method looks at different financials and projections of the company.
What is the importance of the stock price in investment decisions?
Stock price reflects what people think a company's worth is. It sets the cost of owning a share of that company. Knowing what affects stock prices can help you decide when to buy, hold, or sell.
What company performance metrics are important for evaluating stock price?
Metrics like earnings reports, revenue trends, profit margins are key. They give insights into a company’s health and future outlook. This, in turn, affects its stock price.
How do market conditions and economic indicators affect stock price?
Economic indicators like inflation rates and employment figures matter. So do market conditions. They shape how people feel about investing, pushing stock prices up or down.
Why does investor sentiment have such an impact on stock prices?
Investor sentiment impacts stock prices a lot. It's about how investors feel towards the stock market or a particular stock. News, economic reports, and trends can sway these feelings, moving prices.
What role does technical analysis play in determining stock prices?
Technical analysis predicts stock price movements by looking at past data. It uses trends, chart patterns, and indicators like moving averages to forecast prices.
How do bull and bear markets influence stock prices?
In a bull market, stock prices go up. Investor confidence is high, and economic signs are good. In a bear market, it's the opposite. Prices drop due to negative sentiment and bad economic news.
What is sector rotation, and how does it affect stock prices?
Sector rotation means moving investments from one sector to another based on the economic cycle. It changes stock demand in these sectors, affecting prices.
How can one avoid common pitfalls in stock valuation, such as emotional decision-making?
To avoid mistakes, rely on data, not emotions. Avoid market rumors. Focus on the long-term value and trends of stocks, not just immediate price moves.
How does diversification aid in building a solid stock investment strategy?
Diversification spreads risk across different areas. This can lessen the impact of volatility on your investments. It's key to building a strategy that meets your goals and risk level.
What should be considered when comparing long-term vs. short-term investments?
Think about your goals, how long you want to invest, and your risk comfort. Long-term has lower risk but grows steadily. Short-term could bring quick profits but has more ups and downs.
Why is ongoing learning important for successful stock investing?
Markets change all the time. New trends and regulations come up. Learning non-stop helps you adapt and make better investment choices.